تقرير سوق المصادقة الآمنة ثلاثية الأبعاد 2031 حسب القطاعات والجغرافيا والديناميكيات والتطورات الأخيرة والرؤى الاستراتيجية
البيانات التاريخية : 2021-2022 | سنة الأساس : 2023 | فترة التنبؤ : 2024-2031تقرير تحليل حجم سوق المصادقة الآمنة ثلاثية الأبعاد وتوقعاته (2021-2031)، والحصة العالمية والإقليمية، والاتجاهات، وفرص النمو: يغطي التقرير: حسب المكون (الحلول والخدمات)، والمستخدم النهائي (البنوك والتجار ومعالجات الدفع)، والموقع الجغرافي.
- تاريخ التقرير : Mar 2026
- رمز التقرير : TIPRE00021739
- الفئة : التكنولوجيا والإعلام والاتصالات
- الحالة : البيانات الصادرة
- تنسيقات التقارير المتاحة :


- عدد الصفحات : 150
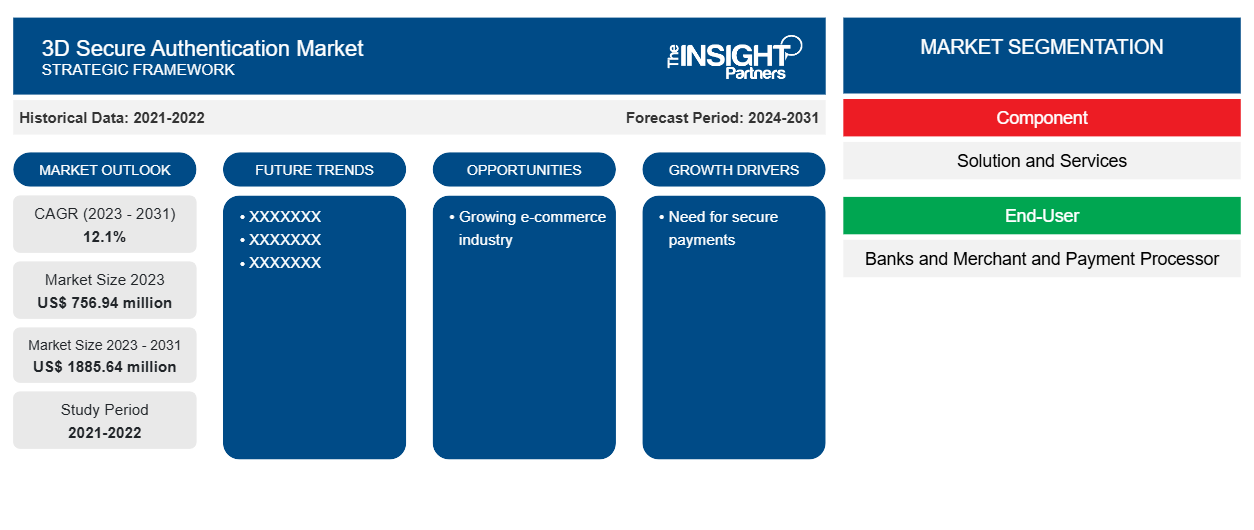
من المتوقع أن يصل حجم سوق المصادقة الآمنة ثلاثية الأبعاد إلى 1885.64 مليون دولار أمريكي بحلول عام 2031 من 756.94 مليون دولار أمريكي في عام 2023. ومن المتوقع أن يسجل السوق معدل نمو سنوي مركب بنسبة 12.1٪ خلال الفترة 2023-2031. ومن المرجح أن تظل المعاملات عبر الإنترنت المتزايدة والهجمات الإلكترونية المتزايدة من الاتجاهات الرئيسية في السوق.
تحليل سوق المصادقة الآمنة ثلاثية الأبعاد
إن ارتفاع معدل انتشار الإنترنت، وارتفاع الدخل المتاح للمستهلك، وزيادة تبني الرقمنة هي بعض العوامل التي تدفع نمو السوق. كما أن صناعة التجارة الإلكترونية والتجارة عبر الأجهزة المحمولة الصاعدة تولد الطلب على حلول لتأمين المعاملات، مما يؤدي إلى نمو السوق. ومع العدد المتزايد من المعاملات عبر الإنترنت، فإن المخاوف بشأن عمليات الاحتيال عبر الإنترنت تدفع السوق.
نظرة عامة على سوق المصادقة الآمنة ثلاثية الأبعاد
3D Secure (3DS) هي طريقة مصادقة وبروتوكول أمان تتبناه الشركات لتأمين نظام الدفع الخاص بها . وهي توفر طبقة إضافية من الأمان لمعاملات بطاقات الائتمان. وتتحقق عملية المصادقة هذه من هوية العميل أثناء الدفع. تعمل لائحة المصادقة القوية PSD2 في أوروبا واللوائح المماثلة في المملكة المتحدة والهند وأستراليا على تعزيز تبني حلول المصادقة الآمنة ثلاثية الأبعاد لمدفوعات البطاقات.
قم بتخصيص هذا التقرير ليناسب متطلباتك
ستحصل على تخصيص لأي تقرير - مجانًا - بما في ذلك أجزاء من هذا التقرير، أو تحليل على مستوى الدولة، وحزمة بيانات Excel، بالإضافة إلى الاستفادة من العروض والخصومات الرائعة للشركات الناشئة والجامعات
سوق المصادقة الآمنة ثلاثية الأبعاد: رؤى استراتيجية
-
احصل على أهم اتجاهات السوق الرئيسية لهذا التقرير.ستتضمن هذه العينة المجانية تحليلاً للبيانات، بدءًا من اتجاهات السوق وحتى التقديرات والتوقعات.
محركات وفرص سوق المصادقة الآمنة ثلاثية الأبعاد
الحاجة إلى الدفع الآمن.
مع تزايد التحول الرقمي، تتبنى الشركات الحلول الرقمية لإدارة عملياتها التجارية بكفاءة. ويؤدي هذا العامل إلى تبني الحلول وإجراء المدفوعات وجمعها بين الشركات. يعد تأمين نظام الدفع من أهم أولويات أي شركة، حيث يعد بناء ثقة العملاء والحفاظ عليها أمرًا مهمًا. ولهذا السبب، تتبنى الشركات حلول المصادقة الآمنة ثلاثية الأبعاد لإضافة طبقة أمان إضافية لمنع المعاملات عبر الإنترنت غير المصرح بها.
صناعة التجارة الإلكترونية المتنامية
تكتسب صناعة التجارة الإلكترونية زخمًا بسبب ارتفاع معدل انتشار الإنترنت ومبيعات الهواتف الذكية وارتفاع القدرة الشرائية للمستهلكين. تعد الجدوى والأسعار المعقولة ومجموعة المنتجات الواسعة بعضًا من مزايا التسوق عبر الإنترنت مقارنة بالتسوق التقليدي. لذلك، يميل العملاء نحو التسوق عبر منصات التجارة الإلكترونية. وقد أدى هذا إلى زيادة المدفوعات من قبل العملاء، مما أدى إلى سوق المصادقة الآمنة ثلاثية الأبعاد. تساعد المصادقة الآمنة ثلاثية الأبعاد الشركات والعملاء على إجراء معاملات أكثر أمانًا عبر الإنترنت. يقلل اعتماد هذا الحل من خطر الاحتيال ويوفر المزيد من الأمان مع طبقة إضافية من المصادقة.
تقرير تحليلي لتجزئة سوق المصادقة الآمنة ثلاثية الأبعاد
إن القطاعات الرئيسية التي ساهمت في استخلاص تحليل سوق المصادقة الآمنة ثلاثية الأبعاد هي المكون والمستخدم النهائي.
- بناءً على المكون، ينقسم سوق المصادقة الآمنة ثلاثية الأبعاد إلى حلول وخدمات. احتل قطاع الحلول الحصة الأكبر من السوق في عام 2023.
- بناءً على المستخدم النهائي، يتم تقسيم سوق المصادقة الآمنة ثلاثية الأبعاد إلى البنوك والتجار ومعالجي الدفع. احتل قطاع البنوك حصة كبيرة من السوق في عام 2023.
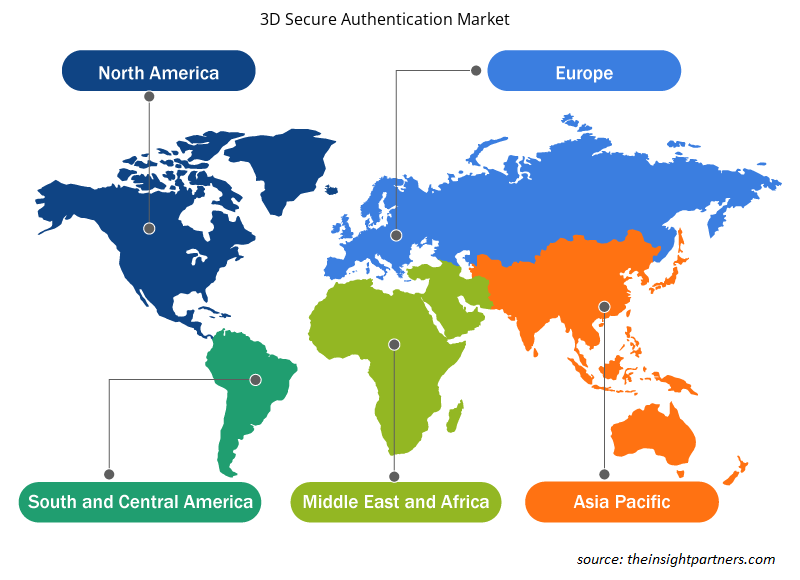
تحليل حصة سوق المصادقة الآمنة ثلاثية الأبعاد حسب المنطقة الجغرافية
ينقسم النطاق الجغرافي لتقرير سوق المصادقة الآمنة ثلاثية الأبعاد بشكل أساسي إلى خمس مناطق: أمريكا الشمالية، ومنطقة آسيا والمحيط الهادئ، وأوروبا، والشرق الأوسط وأفريقيا، وأمريكا الجنوبية والوسطى.
استحوذت منطقة آسيا والمحيط الهادئ على أكبر حصة في السوق ومن المتوقع أن تنمو بمعدل نمو سنوي مركب هو الأعلى. وتستحوذ دول مثل الهند واليابان والصين على غالبية حصة السوق في منطقة آسيا والمحيط الهادئ. ويساهم تبني التقنيات الرقمية في تعزيز نمو السوق في المنطقة. كما تساهم صناعة التجارة الإلكترونية المتنامية في نمو سوق المصادقة الآمنة ثلاثية الأبعاد.
رؤى إقليمية حول سوق المصادقة الآمنة ثلاثية الأبعاد
لقد قام المحللون في Insight Partners بشرح الاتجاهات والعوامل الإقليمية المؤثرة على سوق المصادقة الآمنة ثلاثية الأبعاد طوال فترة التوقعات بشكل شامل. يناقش هذا القسم أيضًا قطاعات سوق المصادقة الآمنة ثلاثية الأبعاد والجغرافيا في جميع أنحاء أمريكا الشمالية وأوروبا ومنطقة آسيا والمحيط الهادئ والشرق الأوسط وأفريقيا وأمريكا الجنوبية والوسطى.
- احصل على البيانات الإقليمية المحددة لسوق المصادقة الآمنة ثلاثية الأبعاد
نطاق تقرير سوق المصادقة الآمنة ثلاثية الأبعاد
| سمة التقرير | تفاصيل |
|---|---|
| حجم السوق في عام 2023 | 756.94 مليون دولار أمريكي |
| حجم السوق بحلول عام 2031 | 1885.64 مليون دولار أمريكي |
| معدل النمو السنوي المركب العالمي (2023 - 2031) | 12.1% |
| البيانات التاريخية | 2021-2022 |
| فترة التنبؤ | 2024-2031 |
| القطاعات المغطاة |
حسب المكون
|
| المناطق والدول المغطاة |
أمريكا الشمالية
|
| قادة السوق وملفات تعريف الشركات الرئيسية |
|
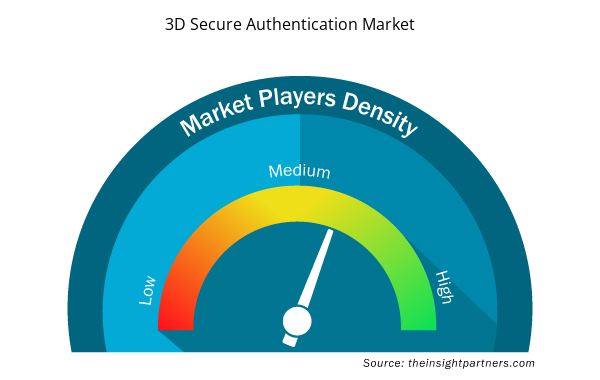
كثافة اللاعبين في سوق المصادقة الآمنة ثلاثية الأبعاد: فهم تأثيرها على ديناميكيات الأعمال
يشهد سوق المصادقة الآمنة ثلاثية الأبعاد نموًا سريعًا، مدفوعًا بالطلب المتزايد من المستخدم النهائي بسبب عوامل مثل تفضيلات المستهلكين المتطورة والتقدم التكنولوجي والوعي المتزايد بفوائد المنتج. ومع ارتفاع الطلب، تعمل الشركات على توسيع عروضها والابتكار لتلبية احتياجات المستهلكين والاستفادة من الاتجاهات الناشئة، مما يؤدي إلى زيادة نمو السوق.
تشير كثافة اللاعبين في السوق إلى توزيع الشركات أو المؤسسات العاملة في سوق أو صناعة معينة. وهي تشير إلى عدد المنافسين (اللاعبين في السوق) الموجودين في مساحة سوق معينة نسبة إلى حجمها أو قيمتها السوقية الإجمالية.
الشركات الرئيسية العاملة في سوق المصادقة الآمنة ثلاثية الأبعاد هي:
- نيتسيتيرا
- شركة جي بايمنت المحدودة
- مجموعة ASEE
- آسياباي المحدودة
- مودروم
- شركة مسينيا
إخلاء المسؤولية : الشركات المذكورة أعلاه ليست مرتبة بأي ترتيب معين.
- احصل على نظرة عامة على أهم اللاعبين الرئيسيين في سوق المصادقة ثلاثية الأبعاد الآمنة
أخبار سوق المصادقة الآمنة ثلاثية الأبعاد والتطورات الأخيرة
يتم تقييم سوق المصادقة الآمنة ثلاثية الأبعاد من خلال جمع البيانات النوعية والكمية بعد البحث الأولي والثانوي، والتي تتضمن منشورات الشركات المهمة وبيانات الجمعيات وقواعد البيانات. فيما يلي بعض التطورات في سوق المصادقة الآمنة ثلاثية الأبعاد:
- أعلنت شركة Everlink عن استكمال شهادة 3D Secure وإطلاق خدمة 3D Secure Authentication من خلال خدمة مصادقة المستهلك VISA (VCAS) لكل من منتجات بطاقات Visa وMastercard. مع تسارع التجارة الإلكترونية في جميع أنحاء العالم، يتعين على الشركات منع الاحتيال وضمان الموافقة على المعاملات بسلاسة. حاليًا، يحدث أكثر من 79٪ من جميع عمليات الاحتيال من خلال المعاملات التي لا يتم فيها تقديم البطاقة. توفر مصادقة 3D Secure طبقة إضافية من الأمان للمستهلكين، مما يوفر تجربة أفضل وأكثر مرونة لحاملي البطاقات للمعاملات التي لا يتم فيها تقديم البطاقة عبر أجهزة متعددة. (المصدر: Everlink، بيان صحفي، يناير 2022)
- أعلنت PayU، الشركة الرائدة في تقديم حلول الدفع عبر الإنترنت في الهند، عن إطلاق مجموعة أدوات تطوير البرمجيات 3D Secure 2.0، التي تقدم خدمة دفع أصلية كاملة وتجربة عملاء فائقة لجميع معاملات البطاقات. يمكن لتجار PayU توفير تجربة عملاء محسنة مع الامتثال لترقيات شبكة البطاقات الرئيسية - بما في ذلك Visa وMastercard مع اكتساب أمان وحماية أفضل من الاحتيال. توفر مجموعة أدوات تطوير البرمجيات 3DS 2.0 خفيفة الوزن من PayU زمن انتقال أقل وتخفيضًا بنسبة 40% في وقت الدفع. طورت PayU هذا العرض المعتمد من EMVCo بالتعاون مع Wibmo، وهي شركة PayTech عالمية مملوكة لشركة PayU. (المصدر: Procurato، بيان صحفي، فبراير 2023)
تقرير سوق المصادقة الآمنة ثلاثية الأبعاد: التغطية والنتائج المتوقعة
يوفر تقرير "حجم سوق المصادقة الآمنة ثلاثية الأبعاد والتوقعات (2021-2031)" تحليلاً مفصلاً للسوق يغطي المجالات التالية:
- حجم سوق المصادقة الآمنة ثلاثية الأبعاد وتوقعاته على المستويات العالمية والإقليمية والوطنية لجميع قطاعات السوق الرئيسية التي يغطيها النطاق
- اتجاهات سوق المصادقة الآمنة ثلاثية الأبعاد بالإضافة إلى ديناميكيات السوق مثل المحركات والقيود والفرص الرئيسية
- تحليل مفصل لقوى PEST/Porter الخمس وSWOT
- تحليل سوق المصادقة الآمنة ثلاثية الأبعاد يغطي اتجاهات السوق الرئيسية والإطار العالمي والإقليمي والجهات الفاعلة الرئيسية واللوائح والتطورات الأخيرة في السوق
- تحليل المشهد الصناعي والمنافسة الذي يغطي تركيز السوق، وتحليل خريطة الحرارة، واللاعبين البارزين، والتطورات الأخيرة لسوق المصادقة الآمنة ثلاثية الأبعاد
- ملفات تعريف الشركة التفصيلية

أنكيتا خبيرة ديناميكية في أبحاث السوق والاستشارات، تتمتع بخبرة تزيد عن 8 سنوات في قطاعات التكنولوجيا والإعلام وتكنولوجيا المعلومات والاتصالات والإلكترونيات وأشباه الموصلات. وقد قادت ونفذت بنجاح أكثر من 100 مهمة استشارية وبحثية لعملاء عالميين مثل مايكروسوفت وأوراكل وشركة NEC وSAP وKPMG وExpeditors International. تشمل كفاءاتها الأساسية تقييم السوق، وتحليل البيانات، والتنبؤ، وصياغة الاستراتيجيات، والاستخبارات التنافسية، وكتابة التقارير.
أنكيتا بارعة في إدارة دورات المشاريع الكاملة، بدءًا من تصميم عروض ما قبل البيع ومناقشات العملاء، وصولًا إلى تقديم رؤى عملية بعد البيع. كما أنها ماهرة في إدارة فرق متعددة الوظائف، وهيكلة وحدات بحثية معقدة، ومواءمة الحلول مع أهداف العمل الخاصة بالعملاء. وقد مكنتها مهاراتها الممتازة في التواصل والقيادة والعرض التقديمي من تحقيق نتائج قيّمة باستمرار في بيئات سوقية سريعة التطور.
- التحليل التاريخي (سنتان)، سنة الأساس، التوقعات (7 سنوات) مع معدل النمو السنوي المركب
- تحليل PEST و SWOT
- حجم السوق والقيمة / الحجم - عالمي، إقليمي، بلد
- الصناعة والمنافسة
- مجموعة بيانات إكسل
التقارير الحديثة
تقارير ذات صلة
شهادات العملاء
تقرير سوق أنظمة SCADA من Insight Partners شامل، ويقدم رؤى قيّمة حول الاتجاهات الحالية والتوقعات المستقبلية. تميّز الفريق باحترافية عالية وسرعة في الاستجابة ودعم مستمر طوال الوقت. نحن راضون جدًا ونوصي بشدة بخدماتهم.
ران كيديم شريك, شركة ريالي تكنولوجيز المحدودةطلبتُ تقريرًا عن سوق برمجيات محدد، وأعدّه الفريق في غضون أيام قليلة. كانت المعلومات ذات صلة وثيقة وعرضها جيد. ثم طلبتُ بعض التعديلات والإضافات على التقرير. وكان الفريق متجاوبًا للغاية، وحصلتُ على التقرير النهائي في أقل من أسبوع.
جان هيرفيه جين رئيس مجلس الإدارة, فيوتشر أناليتيكاعملنا مع شركة "إنسايت بارتنرز" لإجراء دراسة سوقية وتوقعات مهمة. زودونا برؤى واضحة حول الفرص والمخاطر، مما ساعدنا في صياغة خططنا. كانت أبحاثهم سهلة الاستخدام ومبنية على بيانات دقيقة، مما ساعدنا على اتخاذ قرارات ذكية وواثقة. نوصي بهم بشدة.
بيوش ناجبال نائب الرئيس الأول, شعاع عالي عالميقدّمت شركة Insight Partners أبحاثًا سوقية ثاقبة ومنظمة جيدًا بخبرة واسعة في هذا المجال. تميّز فريقهم بالاحترافية وسرعة الاستجابة طوال الوقت. وسهّل موقعهم الإلكتروني سهل الاستخدام الوصول إلى تقارير القطاع. نوصي بهم بشدة لخدمات بحثية موثوقة وعالية الجودة.
يوكيهيكو أداتشي المدير التنفيذي, ديب بلو، ذ.م.م.هذه أول مرة أشتري فيها تقرير سوق من The Insight Partners. رغم أنني كنت مترددًا في البداية، إلا أنني زرت موقعهم الإلكتروني وشعرت براحة أكبر للمخاطرة وشراء تقرير السوق. أنا راضٍ تمامًا عن جودة التقرير وخدمة العملاء. كانت لديّ عدة أسئلة وتعليقات حول التقرير الأولي، ولكن بعد بضع محادثات عبر البريد الإلكتروني مع محللهم، أعتقد أن لديّ تقريرًا يمكنني استخدامه كمدخل لعملية التخطيط الاستراتيجي لدينا. شكرًا جزيلاً لكم على تخصيص وقتكم الإضافي وجعل هذه التجربة إيجابية. سأوصي بخدماتكم للآخرين بالتأكيد، وستكونون أول من ألجأ إليه عندما نحتاج إلى المزيد من بيانات السوق.
جون سوزوكي الرئيس والرئيس التنفيذي وعضو مجلس الإدارة, بي كيه تكنولوجيزأود أن أقدّر دعمكم واحترافيتكم في الاستجابة لطلبي للحصول على معلومات بشأن سوق التشخيص المخبري للأمراض المعدية في نيجيريا. كما أُقدّر صبركم وتوجيهكم، واستعدادكم لتقديم خصم، مما مكّننا في النهاية من إتمام الصفقة. أتطلع إلى التعامل مع "ذا إنسايت بارتنرز" مستقبلًا، كل ذلك بفضل الانطباع الذي تركتموه لديّ نتيجةً لهذا اللقاء الأول.
الدكتور تشيجيوك أونيا المدير الإداري, شركة باينكريست للرعاية الصحية المحدودةسبب الشراء
- اتخاذ قرارات مدروسة
- فهم ديناميكيات السوق
- تحليل المنافسة
- رؤى العملاء
- توقعات السوق
- تخفيف المخاطر
- التخطيط الاستراتيجي
- مبررات الاستثمار
- تحديد الأسواق الناشئة
- تحسين استراتيجيات التسويق
- تعزيز الكفاءة التشغيلية
- مواكبة التوجهات التنظيمية


 احصل على عينة مجانية ل - سوق المصادقة الآمنة ثلاثية الأبعاد