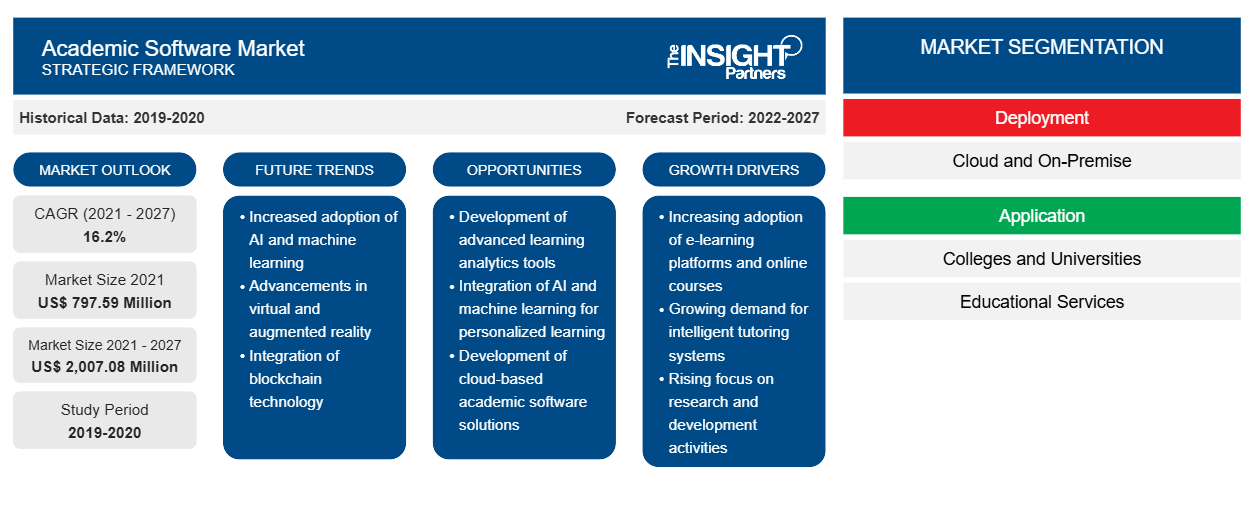
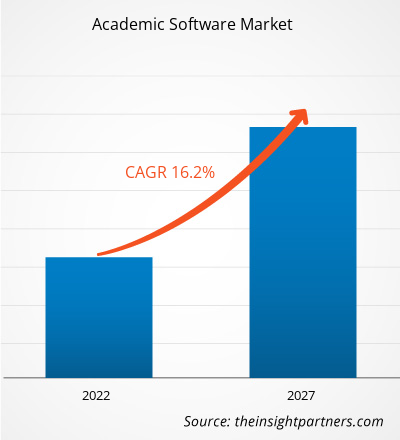
من المتوقع أن ينمو سوق البرامج الأكاديمية من 797.59 مليون دولار أمريكي في عام 2021 إلى 2،007.08 مليون دولار أمريكي بحلول عام 2027. ومن المتوقع أن ينمو سوق البرامج الأكاديمية بمعدل نمو سنوي مركب قدره 16.2٪ خلال الفترة المتوقعة من 2021 إلى 2027.
إن زيادة اعتماد التعلم الإلكتروني عبر المؤسسات هو العامل الرئيسي الذي يدفع نمو سوق البرمجيات الأكاديمية. في التعلم الإلكتروني، من خلال قراءة أو مشاهدة المحتوى، فإنه يغير طريقة تقديم التعليم. العديد من دورات التعلم الإلكتروني مثل الرسوم المتحركة والبودكاست ومقاطع الفيديو تخلق بيئة تعليمية متعددة الوسائط وواقعية. يفتح التعلم الإلكتروني، المحتوى التعليمي، العديد من فرص التعلم الغامرة للمتعلمين من خلال أجهزة الكمبيوتر أو أجهزة الكمبيوتر المحمولة أو الأجهزة اللوحية أو الهواتف الذكية. بدلاً من التواجد في بيئة سلبية، يمكن للطلاب اختيار ما يحتاجون إلى تعلمه بسهولة وبسرعة. هذه الفوائد تزيد من الطلب على البرامج الأكاديمية في جميع أنحاء العالم.
لقد أثر وباء كوفيد-19 بشدة على قطاع التعليم في جميع أنحاء العالم. وقد أدى ذلك أيضًا إلى تعزيز اعتماد نظام التعليم عبر الإنترنت في جميع الاقتصادات الكبرى في جميع أنحاء العالم؛ وبالتالي، التأثير على اعتماد البرامج لتطبيقات مختلفة، مثل إلقاء المحاضرات وإدارة الطلاب والأنشطة التشغيلية الأخرى من مواقع بعيدة. وبالتالي، من المتوقع أن يؤثر التبني المتزايد للحلول المتقدمة تقنيًا في جميع أنحاء القطاع بشكل إيجابي على نمو سوق البرامج الأكاديمية أثناء الوباء.
بناءً على النشر، يتم تقسيم سوق البرامج الأكاديمية إلى سحابية ومحلية. في عام 2019، استحوذ قطاع السحابة على حصة أعلى في السوق. في السنوات الأخيرة، شهدت صناعة التكنولوجيا زيادة كبيرة في تبني الحوسبة السحابية. ويرجع ذلك إلى حقيقة أن الحوسبة السحابية تبسط وقت التنفيذ وتقلل تكاليف النشر بشكل كبير. وقد اجتذبت هذه الميزة عددًا كبيرًا من المستخدمين النهائيين؛ وبالتالي، تقدم غالبية شركات سوق البرامج الأكاديمية منتجات قائمة على السحابة بالتزامن مع الطلب المتزايد على البرامج القائمة على السحابة. بالإضافة إلى ذلك، تطورت البنية التحتية للإنترنت في البلدان المتقدمة وازدهرت في العديد من البلدان النامية، مما مكن المستخدمين النهائيين من الوصول إلى الحلول القائمة على السحابة في كل من البلدان المتقدمة والنامية.
قم بتخصيص هذا التقرير ليناسب متطلباتك
ستحصل على تخصيص لأي تقرير - مجانًا - بما في ذلك أجزاء من هذا التقرير، أو تحليل على مستوى الدولة، وحزمة بيانات Excel، بالإضافة إلى الاستفادة من العروض والخصومات الرائعة للشركات الناشئة والجامعات
- احصل على أهم اتجاهات السوق الرئيسية لهذا التقرير.ستتضمن هذه العينة المجانية تحليلاً للبيانات، بدءًا من اتجاهات السوق وحتى التقديرات والتوقعات.
رؤى سوق البرمجيات الأكاديمية
دمج التقنيات مثل الذكاء الاصطناعي مع حلول البرمجيات الأكاديمية
الذكاء الاصطناعي هو تقنية تمنح أجهزة الكمبيوتر القدرة، بنفس الطريقة التي يتمتع بها البشر، على التواصل مع الناس وفهم الأحداث والتعلم والتفاعل معها. وعلى مر السنين، لم يكن للذكاء الاصطناعي تطبيقات ضخمة في مختلف الصناعات فحسب - مثل الأمن والمراقبة وتكنولوجيا المعلومات - بل شهد أيضًا ارتفاعًا في تبني التقنيات في قطاع التعليم. يتم اعتماد الذكاء الاصطناعي في المدارس والكليات والجامعات لأتمتة المهام المتكررة، مثل التصنيف والتحليل المالي وعمليات القبول. على سبيل المثال، يمكن معايرة الذكاء الاصطناعي لتعلم ونمذجة تصرفات المعلم أثناء التصنيف، من خلال برامج الكمبيوتر المتقدمة - مثل التصنيف الآلي - لتعيين الدرجات تلقائيًا في المستقبل. بمرور الوقت، يتعلم البرنامج المهارات الأكاديمية لطلاب متعددين، وبناءً على أدائهم، يعد خطط تدريب مخصصة.
رؤى السوق القائمة على النشر
بناءً على نوع النشر، يتم تقسيم سوق البرامج الأكاديمية العالمية إلى سحابية ومحلية. تشهد البرامج الأكاديمية المستندة إلى السحابة طلبًا مرتفعًا مقارنة بالبرامج الأكاديمية المحلية. يولد قطاع السحابة غالبية الطلب لأنه أقل تكلفة نسبيًا بسبب البنية التحتية القوية للشبكة في البلدان المتقدمة. بالإضافة إلى ذلك، يركز بائعو البرامج الأكاديمية المستندة إلى السحابة بشكل كبير على تطوير تصحيح أمان عالي المستوى من أجل القضاء على خطر الهجمات الإلكترونية. هذا العامل يخلق أيضًا طلبًا كبيرًا من المستخدمين النهائيين، وبالتالي يقود سوق البرامج الأكاديمية.
رؤى السوق القائمة على التطبيق
بناءً على التطبيق، يتم تقسيم سوق البرامج الأكاديمية إلى الكليات والجامعات والخدمات التعليمية وغيرها. إن زيادة اعتماد الحلول الحديثة في المؤسسات التعليمية والجامعات لتقديم دورات عبر الإنترنت وخارجها للطلاب إلى جانب المبادرة لتوفير حلول متقدمة لجميع الموظفين والطلاب تؤثر على اعتماد البرامج الأكاديمية. وهذا يغذي نمو السوق على مر السنين.
يركز اللاعبون العاملون في سوق البرمجيات الأكاديمية على الاستراتيجيات، مثل مبادرات السوق، والاستحواذات، وإطلاق المنتجات، للحفاظ على مواقعهم في سوق البرمجيات الأكاديمية. وفيما يلي بعض التطورات التي قام بها اللاعبون الرئيسيون في سوق البرمجيات الأكاديمية:
في ديسمبر 2020، قدمت منصة نظام معلومات الطلاب Alma ميزة متوسط النقاط التراكمية (GPA) التي تمت إضافتها إلى أداة دفتر الدرجات. يعتمد التصنيف القائم على المعايير (SBG) على مواءمة ملاحظات الطلاب وقياس التقدم مع المهارات المحددة التي يتم تدريسها وتقييمها، بدلاً من استخدام درجة واحدة لتغطية مواضيع أو معايير متعددة.
في يوليو 2020، قامت ConexED بتحديث تطبيق iOS الخاص بها إلى الإصدار 2.2.3 لتوفير تجربة أكثر سهولة في الاستخدام. يتيح هذا التطبيق للطلاب والموظفين وأعضاء هيئة التدريس الانضمام إلى الاجتماعات الافتراضية ومؤتمرات الفيديو على أجهزتهم المحمولة.
رؤى إقليمية حول سوق البرمجيات الأكاديمية
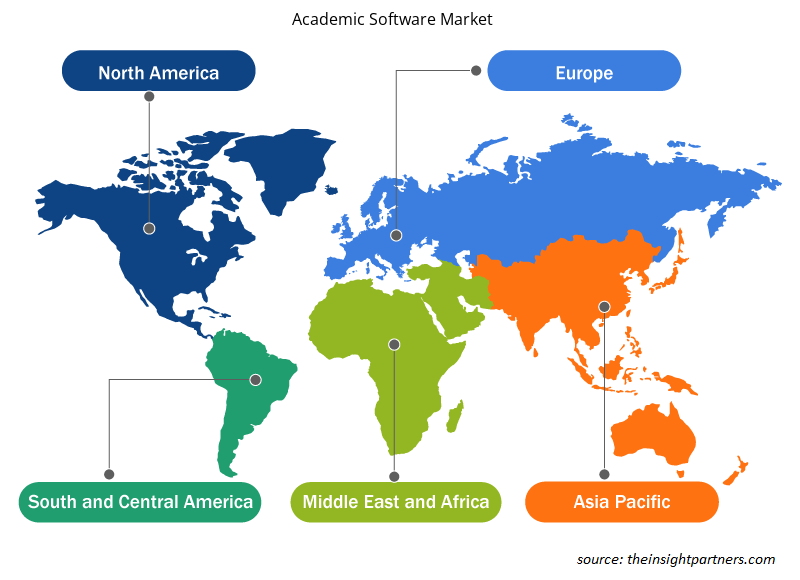
لقد قام المحللون في Insight Partners بشرح الاتجاهات والعوامل الإقليمية المؤثرة على سوق البرمجيات الأكاديمية طوال فترة التوقعات بشكل شامل. يناقش هذا القسم أيضًا قطاعات سوق البرمجيات الأكاديمية والجغرافيا في جميع أنحاء أمريكا الشمالية وأوروبا ومنطقة آسيا والمحيط الهادئ والشرق الأوسط وأفريقيا وأمريكا الجنوبية والوسطى.

- احصل على البيانات الإقليمية المحددة لسوق البرمجيات الأكاديمية
نطاق تقرير سوق البرمجيات الأكاديمية
| سمة التقرير | تفاصيل |
|---|---|
| حجم السوق في عام 2021 | 797.59 مليون دولار أمريكي |
| حجم السوق بحلول عام 2027 | 2,007.08 مليون دولار أمريكي |
| معدل النمو السنوي المركب العالمي (2021 - 2027) | 16.2% |
| البيانات التاريخية | 2019-2020 |
| فترة التنبؤ | 2022-2027 |
| القطاعات المغطاة | حسب النشر
|
| المناطق والدول المغطاة | أمريكا الشمالية
|
| قادة السوق وملفات تعريف الشركات الرئيسية |
|
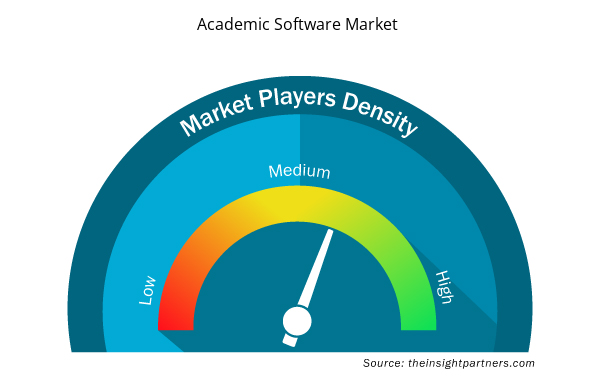
كثافة اللاعبين في سوق البرمجيات الأكاديمية: فهم تأثيرها على ديناميكيات الأعمال
يشهد سوق البرمجيات الأكاديمية نموًا سريعًا، مدفوعًا بالطلب المتزايد من المستخدم النهائي بسبب عوامل مثل تفضيلات المستهلك المتطورة والتقدم التكنولوجي والوعي المتزايد بفوائد المنتج. ومع ارتفاع الطلب، تعمل الشركات على توسيع عروضها والابتكار لتلبية احتياجات المستهلكين والاستفادة من الاتجاهات الناشئة، مما يؤدي إلى زيادة نمو السوق.
تشير كثافة اللاعبين في السوق إلى توزيع الشركات أو المؤسسات العاملة في سوق أو صناعة معينة. وهي تشير إلى عدد المنافسين (اللاعبين في السوق) الموجودين في مساحة سوق معينة نسبة إلى حجمها أو قيمتها السوقية الإجمالية.
الشركات الرئيسية العاملة في سوق البرمجيات الأكاديمية هي:
- ألما
- برنامج CAMPUS CAFÉ
- كونيكس إي دي
- شركة إنفيسيو سوليوشنز
- قماش كامل
إخلاء المسؤولية : الشركات المذكورة أعلاه ليست مرتبة بأي ترتيب معين.

- احصل على نظرة عامة على أهم اللاعبين الرئيسيين في سوق البرمجيات الأكاديمية
سوق البرمجيات الأكاديمية – حسب النشر
- سحاب
- في الموقع
سوق البرمجيات الأكاديمية – حسب التطبيق
- الكليات والجامعات
- الخدمات التعليمية
- آحرون
سوق البرمجيات الأكاديمية – حسب المنطقة الجغرافية
أمريكا الشمالية
- نحن
- كندا
- المكسيك
أوروبا
- فرنسا
- ألمانيا
- روسيا
- المملكة المتحدة
- إيطاليا
- بقية أوروبا
آسيا والمحيط الهادئ (APAC)
- الصين
- الهند
- اليابان
- أستراليا
- كوريا الجنوبية
- بقية منطقة آسيا والمحيط الهادئ
الشرق الأوسط وأفريقيا
- المملكة العربية السعودية
- الامارات العربية المتحدة
- جنوب أفريقيا
- باقي منطقة الشرق الأوسط وأفريقيا
سام
- البرازيل
- الأرجنتين
- بقية سام
سوق البرمجيات الأكاديمية – نبذة عن الشركة
- ألما
- برنامج CAMPUS CAFÉ
- كونيكس إي دي
- شركة إنفيسيو سوليوشنز
- قماش كامل
- شركة باور فيستا للبرمجيات
- شركة كوالتريكس المحدودة
- شركة توبات مونوكل
- حوار حقيقي
- ويزهايف
- التحليل التاريخي (سنتان)، السنة الأساسية، التوقعات (7 سنوات) مع معدل النمو السنوي المركب
- تحليل PEST و SWOT
- حجم السوق والقيمة / الحجم - عالميًا وإقليميًا وقطريًا
- الصناعة والمنافسة
- مجموعة بيانات Excel


Report Coverage
Revenue forecast, Company Analysis, Industry landscape, Growth factors, and Trends

Segment Covered
This text is related
to segments covered.

Regional Scope
North America, Europe, Asia Pacific, Middle East & Africa, South & Central America

Country Scope
This text is related
to country scope.
الأسئلة الشائعة
Increase in adoption of modern technologies and rapid shift from traditional teaching methodologies to modern teaching techniques are influencing the adoption of academic software solutions across colleges and universities across the globe. Additionally, software packages taken by universities and colleges for a large number of users are also cost efficient for both the institutions and the students. In the private sector, for instance, many software packages that a student wants are very expensive. This is why VIVES University of Applied Sciences has developed a partnership to deliver academic solutions with Signpost. Bulk transaction or software license transactions would substantially lower the cost of all their students' required application. A standard software package is compiled by VIVES on Signpost's Academic Software platform, which consists of hundreds of software titles that must be purchased by any VIVES student as a compulsory learning material, regardless of the education or training process. The same can be installed and used on personal laptops and desktops of students. Thus, increasing initiatives by colleges and universities to install bulk academic solutions for students are contributing to the academic software market growth across the globe.
The software industry is growing at a fast pace in the region as it attracts various technological developments. The US federal government spends ~US$ 79 billion every year on the development of primary and secondary education programs. In addition, the trend of privatizing schools in the US is prevailing which is another aspect that would help in boosting the scope of integrating advanced software in schools. In the 21st century, the education sector is experiencing numerous efforts to privatize educational services which were provided by public agencies & school systems. Privatization is expected to transform the method of running schools and will open up opportunities for integrating new software and technologies to manage operations in educational institutes efficiently.
Artificial intelligence (AI) is a technology that gives computers the ability, in the same way as humans, to communicate with people, understand events, and learn and react to events. Over the years, artificial intelligence not only had huge applications across industries—such as security and surveillance and information technology—but it had also experienced a rise in adoption of the technologies in the education sector. AI is being adopted across schools, colleges, and universities for automating repetitive tasks, such as grading, financial analysis, and admission processes. For example, AI can be calibrated to learn and model teacher actions while grading, through advanced computer programs—such as Automated Grading—for automatic grade assignment in the future. Over time, the program would learn the academic skills of multiple students and, based on their performances, prepare customized training plans.
Trends and growth analysis reports related to Technology, Media and Telecommunications : READ MORE..
The List of Companies - Academic Software Market
- Alma
- CAMPUS CAFÉ SOFTWARE
- ConexED
- Envisio Solutions Inc.
- FULL FABRIC
- PowerVista Software, Inc.
- Qualtrics LLC
- Tophatmonocle Corp
- TrueDialog
- WizeHive
The Insight Partners performs research in 4 major stages: Data Collection & Secondary Research, Primary Research, Data Analysis and Data Triangulation & Final Review.
- Data Collection and Secondary Research:
As a market research and consulting firm operating from a decade, we have published and advised several client across the globe. First step for any study will start with an assessment of currently available data and insights from existing reports. Further, historical and current market information is collected from Investor Presentations, Annual Reports, SEC Filings, etc., and other information related to company’s performance and market positioning are gathered from Paid Databases (Factiva, Hoovers, and Reuters) and various other publications available in public domain.
Several associations trade associates, technical forums, institutes, societies and organization are accessed to gain technical as well as market related insights through their publications such as research papers, blogs and press releases related to the studies are referred to get cues about the market. Further, white papers, journals, magazines, and other news articles published in last 3 years are scrutinized and analyzed to understand the current market trends.
- Primary Research:
The primarily interview analysis comprise of data obtained from industry participants interview and answers to survey questions gathered by in-house primary team.
For primary research, interviews are conducted with industry experts/CEOs/Marketing Managers/VPs/Subject Matter Experts from both demand and supply side to get a 360-degree view of the market. The primary team conducts several interviews based on the complexity of the markets to understand the various market trends and dynamics which makes research more credible and precise.
A typical research interview fulfils the following functions:
- Provides first-hand information on the market size, market trends, growth trends, competitive landscape, and outlook
- Validates and strengthens in-house secondary research findings
- Develops the analysis team’s expertise and market understanding
Primary research involves email interactions and telephone interviews for each market, category, segment, and sub-segment across geographies. The participants who typically take part in such a process include, but are not limited to:
- Industry participants: VPs, business development managers, market intelligence managers and national sales managers
- Outside experts: Valuation experts, research analysts and key opinion leaders specializing in the electronics and semiconductor industry.
Below is the breakup of our primary respondents by company, designation, and region:

Once we receive the confirmation from primary research sources or primary respondents, we finalize the base year market estimation and forecast the data as per the macroeconomic and microeconomic factors assessed during data collection.
- Data Analysis:
Once data is validated through both secondary as well as primary respondents, we finalize the market estimations by hypothesis formulation and factor analysis at regional and country level.
- Macro-Economic Factor Analysis:
We analyse macroeconomic indicators such the gross domestic product (GDP), increase in the demand for goods and services across industries, technological advancement, regional economic growth, governmental policies, the influence of COVID-19, PEST analysis, and other aspects. This analysis aids in setting benchmarks for various nations/regions and approximating market splits. Additionally, the general trend of the aforementioned components aid in determining the market's development possibilities.
- Country Level Data:
Various factors that are especially aligned to the country are taken into account to determine the market size for a certain area and country, including the presence of vendors, such as headquarters and offices, the country's GDP, demand patterns, and industry growth. To comprehend the market dynamics for the nation, a number of growth variables, inhibitors, application areas, and current market trends are researched. The aforementioned elements aid in determining the country's overall market's growth potential.
- Company Profile:
The “Table of Contents” is formulated by listing and analyzing more than 25 - 30 companies operating in the market ecosystem across geographies. However, we profile only 10 companies as a standard practice in our syndicate reports. These 10 companies comprise leading, emerging, and regional players. Nonetheless, our analysis is not restricted to the 10 listed companies, we also analyze other companies present in the market to develop a holistic view and understand the prevailing trends. The “Company Profiles” section in the report covers key facts, business description, products & services, financial information, SWOT analysis, and key developments. The financial information presented is extracted from the annual reports and official documents of the publicly listed companies. Upon collecting the information for the sections of respective companies, we verify them via various primary sources and then compile the data in respective company profiles. The company level information helps us in deriving the base number as well as in forecasting the market size.
- Developing Base Number:
Aggregation of sales statistics (2020-2022) and macro-economic factor, and other secondary and primary research insights are utilized to arrive at base number and related market shares for 2022. The data gaps are identified in this step and relevant market data is analyzed, collected from paid primary interviews or databases. On finalizing the base year market size, forecasts are developed on the basis of macro-economic, industry and market growth factors and company level analysis.
- Data Triangulation and Final Review:
The market findings and base year market size calculations are validated from supply as well as demand side. Demand side validations are based on macro-economic factor analysis and benchmarks for respective regions and countries. In case of supply side validations, revenues of major companies are estimated (in case not available) based on industry benchmark, approximate number of employees, product portfolio, and primary interviews revenues are gathered. Further revenue from target product/service segment is assessed to avoid overshooting of market statistics. In case of heavy deviations between supply and demand side values, all thes steps are repeated to achieve synchronization.
We follow an iterative model, wherein we share our research findings with Subject Matter Experts (SME’s) and Key Opinion Leaders (KOLs) until consensus view of the market is not formulated – this model negates any drastic deviation in the opinions of experts. Only validated and universally acceptable research findings are quoted in our reports.
We have important check points that we use to validate our research findings – which we call – data triangulation, where we validate the information, we generate from secondary sources with primary interviews and then we re-validate with our internal data bases and Subject matter experts. This comprehensive model enables us to deliver high quality, reliable data in shortest possible time.


 احصل على عينة مجانية لهذا التقرير