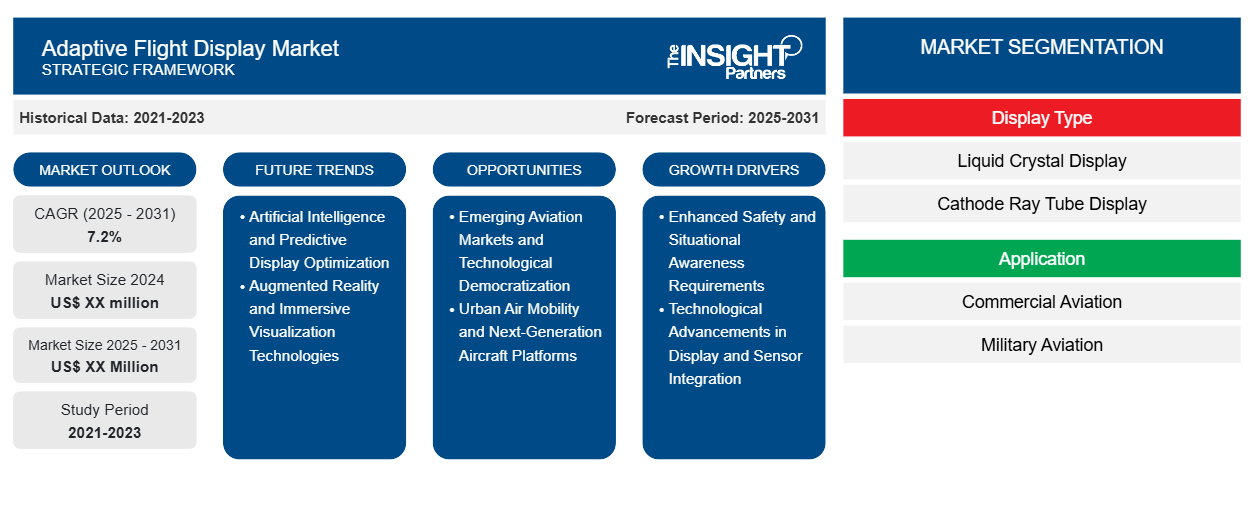
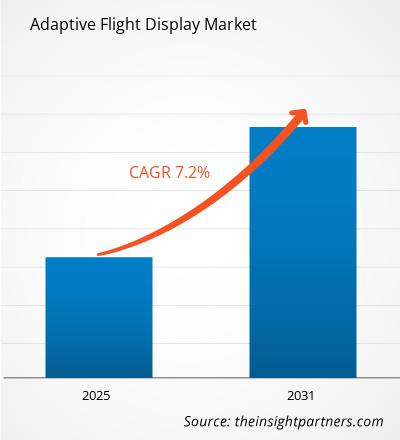
من المتوقع أن يسجل سوق شاشات الطيران التكيفية معدل نمو سنوي مركب بنسبة 7.2٪ من عام 2023 إلى عام 2031، مع توسع حجم السوق من XX مليون دولار أمريكي في عام 2023 إلى XX مليون دولار أمريكي بحلول عام 2031.
تم تقسيم التقرير حسب نوع العرض (شاشة الكريستال السائل، شاشة أنبوب أشعة الكاثود). كما يقدم التقرير تحليلاً بناءً على التطبيق (الطيران التجاري، الطيران العسكري). كما تم تقسيم التحليل العالمي على المستوى الإقليمي والدول الرئيسية. يقدم التقرير القيمة بالدولار الأمريكي للتحليل والقطاعات المذكورة أعلاه.
غرض التقرير
يهدف تقرير سوق شاشات العرض التكيفية الصادر عن The Insight Partners إلى وصف المشهد الحالي والنمو المستقبلي وأهم العوامل الدافعة والتحديات والفرص. وسيوفر هذا رؤى لمختلف أصحاب المصلحة في الأعمال التجارية، مثل:
- مزودي/مصنعي التكنولوجيا: لفهم ديناميكيات السوق المتطورة ومعرفة فرص النمو المحتملة، وتمكينهم من اتخاذ قرارات استراتيجية مستنيرة.
- المستثمرون: إجراء تحليل شامل للاتجاهات فيما يتعلق بمعدل نمو السوق، وتوقعات السوق المالية، والفرص المتاحة عبر سلسلة القيمة.
- الهيئات التنظيمية: لتنظيم السياسات ومراقبة الأنشطة في السوق بهدف تقليل الانتهاكات والحفاظ على ثقة المستثمرين والحفاظ على سلامة السوق واستقرارها.
تجزئة سوق شاشات الطيران التكيفية
نوع العرض
- شاشة الكريستال السائل
- شاشة أنبوب أشعة الكاثود
طلب
- الطيران التجاري
- الطيران العسكري
قم بتخصيص هذا التقرير ليناسب متطلباتك
ستحصل على تخصيص لأي تقرير - مجانًا - بما في ذلك أجزاء من هذا التقرير، أو تحليل على مستوى الدولة، وحزمة بيانات Excel، بالإضافة إلى الاستفادة من العروض والخصومات الرائعة للشركات الناشئة والجامعات
سوق شاشات الطيران التكيفية: رؤى استراتيجية
- احصل على أهم اتجاهات السوق الرئيسية لهذا التقرير.ستتضمن هذه العينة المجانية تحليلاً للبيانات، بدءًا من اتجاهات السوق وحتى التقديرات والتوقعات.
عوامل نمو سوق شاشات الطيران التكيفية
- متطلبات السلامة المحسنة والوعي بالموقف: إن الطلب المتزايد على الوعي المتقدم بالموقف للطيارين هو المحرك الأساسي لنمو سوق شاشات الطيران التكيفية. تتطلب بيئات الطيران الحديثة تقنيات عرض معلومات متطورة بشكل متزايد يمكنها ضبط معلمات الطيران المعقدة ديناميكيًا في الوقت الفعلي. تعطي قطاعات الطيران التجاري والعسكري الأولوية لتقنيات العرض التي تقلل من عبء العمل المعرفي وتقلل من خطأ الطيار وتوفر تصورًا بديهيًا للمعلومات واعيًا بالسياق، مما يتيح اتخاذ قرارات أسرع أثناء عمليات الطيران الحرجة والظروف البيئية الصعبة.
- التطورات التكنولوجية في دمج الشاشات وأجهزة الاستشعار: إن التطورات السريعة في تقنيات العرض ودمج أجهزة الاستشعار والقدرات الحاسوبية تدفع سوق شاشات الطيران التكيفية إلى الأمام. وتمكن التقنيات الناشئة من إنشاء أنظمة عرض أكثر تطوراً واستجابة يمكنها إعادة تكوين المعلومات المرئية تلقائيًا بناءً على ظروف الطيران الحالية ومعايير المهمة وسيناريوهات المخاطر المحتملة. وتعمل تقنيات العرض المتقدمة التي تتميز برسومات عالية الدقة وخوارزميات تنبؤية ودمج بيانات أجهزة الاستشعار بسلاسة على إنشاء أنظمة إدارة معلومات قمرة القيادة أكثر ذكاءً واستجابة.
الاتجاهات المستقبلية لسوق شاشات الطيران التكيفية
- الذكاء الاصطناعي وتحسين العرض التنبؤي: أحد الاتجاهات البارزة في أسواق شاشات الطيران التكيفية هو التكامل المتزايد للذكاء الاصطناعي لإنشاء واجهات عرض أكثر ذكاءً ووعيًا بالسياق. تعمل الأنظمة التي تعمل بالذكاء الاصطناعي على تمكين الشاشات التي يمكنها تعلم تفضيلات الطيارين وتوقع احتياجات المعلومات وإعطاء الأولوية بشكل ديناميكي لمعلومات الطيران المهمة. تعمل خوارزميات التعلم الآلي على تحويل شاشات الطيران من لوحات معلومات ثابتة إلى بيئات ذكية وقابلة للتكيف يمكنها التنبؤ بالمشاكل المحتملة وتحسين عرض المعلومات وتعزيز سلامة الطيران بشكل عام.
- الواقع المعزز وتقنيات التصور الغامر: يشهد سوق شاشات الطيران التكيفية اتجاهًا كبيرًا نحو الواقع المعزز وتقنيات التصور الغامر. حيث تعمل الشركات المصنعة على تطوير أنظمة عرض تراكب معلومات الطيران المهمة مباشرة على الزجاج الأمامي للطائرة، مما يوفر عرضًا سلسًا وبديهيًا للمعلومات دون الحاجة إلى تحويل الطيارين انتباههم عن مسارات الطيران الأساسية. ويدفع هذا الاتجاه تطوير شاشات عرض أمامية متقدمة وأنظمة مثبتة على الخوذة تدمج بيانات الطيران المعقدة مع البيئات المرئية في العالم الحقيقي.
فرص سوق شاشات الطيران التكيفية
- الأسواق الناشئة للطيران والديمقراطية التكنولوجية: إن أسواق الطيران النامية وزيادة إمكانية الوصول إلى التكنولوجيا تقدم فرصًا كبيرة لتقنيات العرض المتكيفة للطيران. وتسعى قطاعات الطيران التجاري المتنامية في الاقتصادات الناشئة إلى الحصول على تقنيات قمرة القيادة المتقدمة التي تعزز السلامة والكفاءة التشغيلية. وتتيح التكاليف المتناقصة لتقنيات العرض المتقدمة تبنيها على نطاق أوسع عبر أنواع مختلفة من الطائرات والمجالات التشغيلية، مما يخلق فرصًا للشركات المصنعة لتوسيع نطاق وصولها إلى السوق.
- التنقل الجوي الحضري ومنصات الطائرات من الجيل التالي: يمثل النظام البيئي الناشئ للتنقل الجوي الحضري وتطوير منصات الطائرات من الجيل التالي فرصًا كبيرة لتوسيع سوق شاشات الطيران التكيفية. تتطلب المركبات الكهربائية للإقلاع والهبوط العمودي (eVTOL)، والمركبات الجوية ذاتية القيادة، وتصميمات الطائرات المبتكرة تقنيات عرض متطورة وقابلة للتكيف يمكنها إدارة المعلمات التشغيلية المعقدة. تتطلب هذه المنصات الناشئة أنظمة عرض أكثر بديهية واستجابة ووعيًا بالسياق يمكنها دعم أنماط جديدة من النقل الجوي.
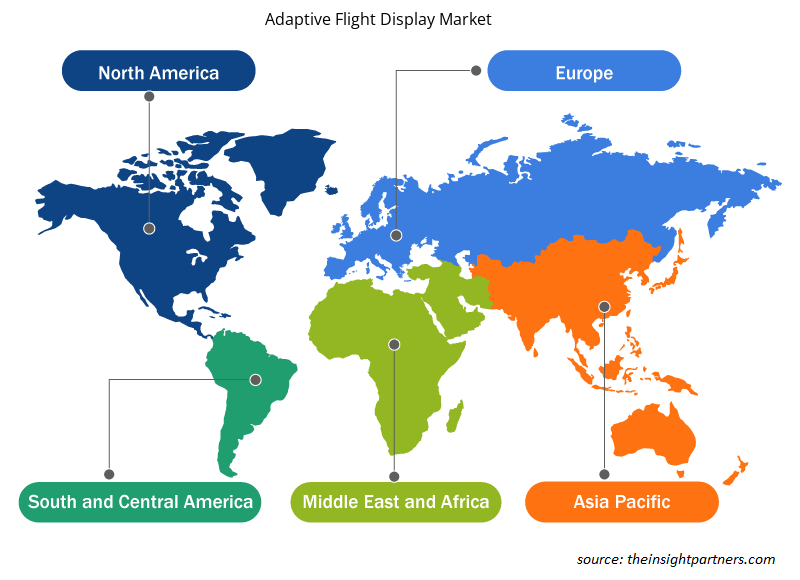
رؤى إقليمية حول سوق شاشات الطيران التكيفية
لقد قام المحللون في Insight Partners بشرح الاتجاهات والعوامل الإقليمية المؤثرة على سوق شاشات الطيران التكيفية طوال فترة التوقعات بشكل شامل. يناقش هذا القسم أيضًا قطاعات سوق شاشات الطيران التكيفية والجغرافيا في جميع أنحاء أمريكا الشمالية وأوروبا ومنطقة آسيا والمحيط الهادئ والشرق الأوسط وأفريقيا وأمريكا الجنوبية والوسطى.
- احصل على البيانات الإقليمية المحددة لسوق شاشات العرض التكيفية للطيران
نطاق تقرير سوق شاشات الطيران التكيفية
| سمة التقرير | تفاصيل |
|---|---|
| حجم السوق في عام 2023 | XX مليون دولار أمريكي |
| حجم السوق بحلول عام 2031 | XX مليون دولار أمريكي |
| معدل النمو السنوي المركب العالمي (2023 - 2031) | 7.2% |
| البيانات التاريخية | 2021-2022 |
| فترة التنبؤ | 2024-2031 |
| القطاعات المغطاة | حسب نوع العرض
|
| المناطق والدول المغطاة | أمريكا الشمالية
|
| قادة السوق وملفات تعريف الشركات الرئيسية |
|
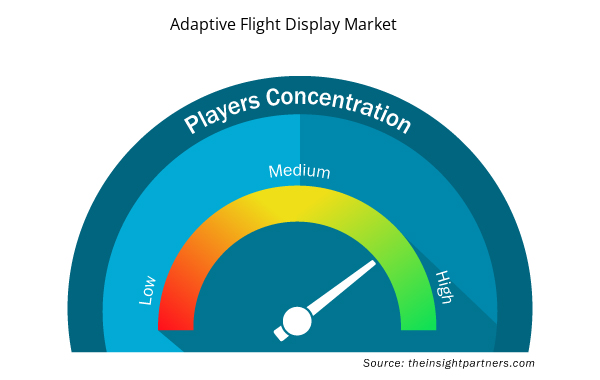
كثافة اللاعبين في سوق شاشات الطيران التكيفية: فهم تأثيرها على ديناميكيات الأعمال
يشهد سوق شاشات الطيران التكيفية نموًا سريعًا، مدفوعًا بالطلب المتزايد من المستخدم النهائي بسبب عوامل مثل تفضيلات المستهلك المتطورة والتقدم التكنولوجي والوعي المتزايد بفوائد المنتج. ومع ارتفاع الطلب، تعمل الشركات على توسيع عروضها والابتكار لتلبية احتياجات المستهلكين والاستفادة من الاتجاهات الناشئة، مما يؤدي إلى زيادة نمو السوق.
تشير كثافة اللاعبين في السوق إلى توزيع الشركات أو المؤسسات العاملة في سوق أو صناعة معينة. وهي تشير إلى عدد المنافسين (اللاعبين في السوق) الموجودين في مساحة سوق معينة نسبة إلى حجمها أو قيمتها السوقية الإجمالية.
الشركات الرئيسية العاملة في سوق العرض التكيفي للطيران هي:
- إيرباص ساس
- شركة أسبن للطائرات الإلكترونية
- كولينز للطيران
- دينون افيونيكس
- شركة جارمين المحدودة
إخلاء المسؤولية : الشركات المذكورة أعلاه ليست مرتبة بأي ترتيب معين.
- احصل على نظرة عامة على أهم اللاعبين الرئيسيين في سوق شاشات العرض التكيفية
نقاط البيع الرئيسية
- التغطية الشاملة: يغطي التقرير بشكل شامل تحليل المنتجات والخدمات والأنواع والمستخدمين النهائيين لسوق شاشات الطيران التكيفية، مما يوفر صورة شاملة.
- تحليل الخبراء: تم تجميع التقرير على أساس الفهم العميق لخبراء الصناعة والمحللين.
- معلومات محدثة: يضمن التقرير أهمية الأعمال التجارية بسبب تغطيته للمعلومات الحديثة واتجاهات البيانات.
- خيارات التخصيص: يمكن تخصيص هذا التقرير لتلبية متطلبات العملاء المحددة وبما يتناسب مع استراتيجيات العمل بشكل مناسب.
وبالتالي، يمكن أن يساعد تقرير البحث حول سوق شاشات الطيران التكيفية في تمهيد الطريق لفك شفرة وفهم سيناريو الصناعة وآفاق النمو. ورغم وجود بعض المخاوف المشروعة، فإن الفوائد الإجمالية لهذا التقرير تميل إلى التفوق على العيوب.
- التحليل التاريخي (سنتان)، السنة الأساسية، التوقعات (7 سنوات) مع معدل النمو السنوي المركب
- تحليل PEST و SWOT
- حجم السوق والقيمة / الحجم - عالميًا وإقليميًا وقطريًا
- الصناعة والمنافسة
- مجموعة بيانات Excel


Report Coverage
Revenue forecast, Company Analysis, Industry landscape, Growth factors, and Trends

Segment Covered
This text is related
to segments covered.

Regional Scope
North America, Europe, Asia Pacific, Middle East & Africa, South & Central America

Country Scope
This text is related
to country scope.
الأسئلة الشائعة
Some of the customization options available based on the request are an additional 3-5 company profiles and country-specific analysis of 3-5 countries of your choice. Customizations are to be requested/discussed before making final order confirmation, as our team would review the same and check the feasibility.
The report can be delivered in PDF/PPT format; we can also share excel dataset based on the request.
The leading players operating in the Adaptive Flight Display Market include Airbus S.A.S., Aspen Avionics, Inc., Collins Aerospace, Dynon Avionics, Garmin Ltd., L3Harris Technologies, Inc., Meggitt PLC, Sandel Avionics, Inc., Thales Group, Universal Avionics Systems Corporation
The Adaptive Flight Display Market is estimated to witness a CAGR of 7.2% from 2023 to 2031
Shift Towards Modular Display Solutions and Emphasis on User-Centric Design are the key future trends of the Adaptive Flight Display Market
The major factors driving the Adaptive Flight Display Market are: Continuous Development of Display Technologies and Rising Demand for Higher Situational Awareness of Pilots
Trends and growth analysis reports related to Aerospace and Defense : READ MORE..
1. Airbus S.A.S.
2. Aspen Avionics, Inc.
3. Collins Aerospace
4. Dynon Avionics
5. Garmin Ltd.
6. L3Harris Technologies, Inc.
7. Meggitt PLC
8. Sandel Avionics, Inc.
9. Thales Group
10. Universal Avionics Systems Corporation
The Insight Partners performs research in 4 major stages: Data Collection & Secondary Research, Primary Research, Data Analysis and Data Triangulation & Final Review.
- Data Collection and Secondary Research:
As a market research and consulting firm operating from a decade, we have published and advised several client across the globe. First step for any study will start with an assessment of currently available data and insights from existing reports. Further, historical and current market information is collected from Investor Presentations, Annual Reports, SEC Filings, etc., and other information related to company’s performance and market positioning are gathered from Paid Databases (Factiva, Hoovers, and Reuters) and various other publications available in public domain.
Several associations trade associates, technical forums, institutes, societies and organization are accessed to gain technical as well as market related insights through their publications such as research papers, blogs and press releases related to the studies are referred to get cues about the market. Further, white papers, journals, magazines, and other news articles published in last 3 years are scrutinized and analyzed to understand the current market trends.
- Primary Research:
The primarily interview analysis comprise of data obtained from industry participants interview and answers to survey questions gathered by in-house primary team.
For primary research, interviews are conducted with industry experts/CEOs/Marketing Managers/VPs/Subject Matter Experts from both demand and supply side to get a 360-degree view of the market. The primary team conducts several interviews based on the complexity of the markets to understand the various market trends and dynamics which makes research more credible and precise.
A typical research interview fulfils the following functions:
- Provides first-hand information on the market size, market trends, growth trends, competitive landscape, and outlook
- Validates and strengthens in-house secondary research findings
- Develops the analysis team’s expertise and market understanding
Primary research involves email interactions and telephone interviews for each market, category, segment, and sub-segment across geographies. The participants who typically take part in such a process include, but are not limited to:
- Industry participants: VPs, business development managers, market intelligence managers and national sales managers
- Outside experts: Valuation experts, research analysts and key opinion leaders specializing in the electronics and semiconductor industry.
Below is the breakup of our primary respondents by company, designation, and region:

Once we receive the confirmation from primary research sources or primary respondents, we finalize the base year market estimation and forecast the data as per the macroeconomic and microeconomic factors assessed during data collection.
- Data Analysis:
Once data is validated through both secondary as well as primary respondents, we finalize the market estimations by hypothesis formulation and factor analysis at regional and country level.
- Macro-Economic Factor Analysis:
We analyse macroeconomic indicators such the gross domestic product (GDP), increase in the demand for goods and services across industries, technological advancement, regional economic growth, governmental policies, the influence of COVID-19, PEST analysis, and other aspects. This analysis aids in setting benchmarks for various nations/regions and approximating market splits. Additionally, the general trend of the aforementioned components aid in determining the market's development possibilities.
- Country Level Data:
Various factors that are especially aligned to the country are taken into account to determine the market size for a certain area and country, including the presence of vendors, such as headquarters and offices, the country's GDP, demand patterns, and industry growth. To comprehend the market dynamics for the nation, a number of growth variables, inhibitors, application areas, and current market trends are researched. The aforementioned elements aid in determining the country's overall market's growth potential.
- Company Profile:
The “Table of Contents” is formulated by listing and analyzing more than 25 - 30 companies operating in the market ecosystem across geographies. However, we profile only 10 companies as a standard practice in our syndicate reports. These 10 companies comprise leading, emerging, and regional players. Nonetheless, our analysis is not restricted to the 10 listed companies, we also analyze other companies present in the market to develop a holistic view and understand the prevailing trends. The “Company Profiles” section in the report covers key facts, business description, products & services, financial information, SWOT analysis, and key developments. The financial information presented is extracted from the annual reports and official documents of the publicly listed companies. Upon collecting the information for the sections of respective companies, we verify them via various primary sources and then compile the data in respective company profiles. The company level information helps us in deriving the base number as well as in forecasting the market size.
- Developing Base Number:
Aggregation of sales statistics (2020-2022) and macro-economic factor, and other secondary and primary research insights are utilized to arrive at base number and related market shares for 2022. The data gaps are identified in this step and relevant market data is analyzed, collected from paid primary interviews or databases. On finalizing the base year market size, forecasts are developed on the basis of macro-economic, industry and market growth factors and company level analysis.
- Data Triangulation and Final Review:
The market findings and base year market size calculations are validated from supply as well as demand side. Demand side validations are based on macro-economic factor analysis and benchmarks for respective regions and countries. In case of supply side validations, revenues of major companies are estimated (in case not available) based on industry benchmark, approximate number of employees, product portfolio, and primary interviews revenues are gathered. Further revenue from target product/service segment is assessed to avoid overshooting of market statistics. In case of heavy deviations between supply and demand side values, all thes steps are repeated to achieve synchronization.
We follow an iterative model, wherein we share our research findings with Subject Matter Experts (SME’s) and Key Opinion Leaders (KOLs) until consensus view of the market is not formulated – this model negates any drastic deviation in the opinions of experts. Only validated and universally acceptable research findings are quoted in our reports.
We have important check points that we use to validate our research findings – which we call – data triangulation, where we validate the information, we generate from secondary sources with primary interviews and then we re-validate with our internal data bases and Subject matter experts. This comprehensive model enables us to deliver high quality, reliable data in shortest possible time.
 احصل على عينة مجانية لهذا التقرير