تحليل سوق أجهزة استشعار جودة الهواء والتنبؤ بها حسب الحجم والمشاركة والنمو والاتجاهات 2031

  • Report Code : TIPRE00014591
  • Category : Electronics and Semiconductor
  • No. of Pages : 150
Buy Now

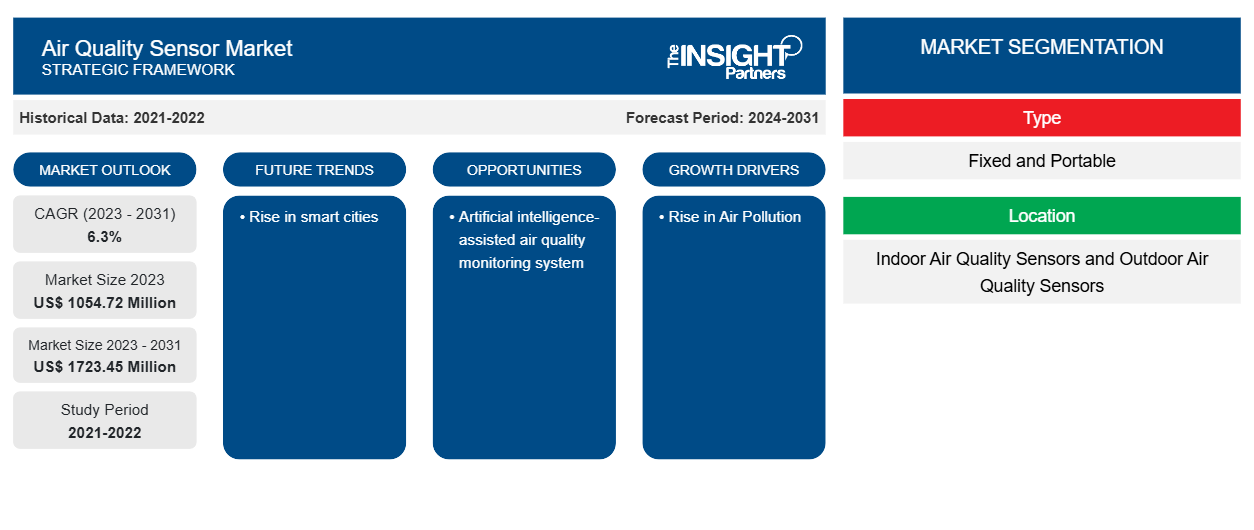
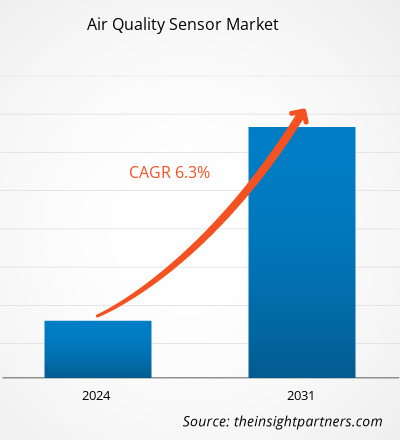
من المتوقع أن يصل حجم سوق أجهزة استشعار جودة الهواء إلى 1723.45 مليون دولار أمريكي بحلول عام 2031 من 1054.72 مليون دولار أمريكي في عام 2023. ومن المتوقع أن يسجل السوق معدل نمو سنوي مركب بنسبة 6.3٪ في الفترة 2023-2031. ومن المرجح أن يظل تلوث الهواء المتزايد وتركيز الحكومة على الاستدامة من الاتجاهات الرئيسية لسوق أجهزة استشعار جودة الهواء.


تحليل سوق أجهزة استشعار جودة الهواء

إن المخاوف البيئية المتزايدة واللوائح الصارمة التي تفرضها الحكومة لمراقبة جودة الهواء تؤدي إلى اعتماد سوق أجهزة استشعار جودة الهواء. إن الوعي المتزايد بأهمية الهواء النظيف وعيوب الأمراض المحمولة جواً يغذي اعتمادها في مختلف الصناعات. إن المبادرات الحكومية نحو تطوير الصناعات الصديقة للبيئة تعزز نمو سوقها.


نظرة عامة على سوق أجهزة استشعار جودة الهواء

مستشعر جودة الهواء هو جهاز يقيس تركيز الملوثات في الهواء. وهو مكون أساسي في جهاز تنقية الهواء ونظام الهواء النقي. يمكن لمستشعرات جودة الهواء عادةً قياس الجسيمات (مثل pm1 وpm2.5 وpm10) والغازات (مثل الأوزون وأول أكسيد الكربون وثاني أكسيد الكربون والميثان والفورمالديهايد وغيرها) وبعض المؤشرات البيئية (مثل درجة الحرارة والرطوبة والأشعة فوق البنفسجية والإضاءة وما إلى ذلك). يكتشف مستشعر جودة الهواء مؤشرات الغاز والجسيمات في الهواء باستخدام طرق بصرية وكهربائية وحرارية وغيرها.


قم بتخصيص هذا التقرير ليناسب متطلباتك

ستحصل على تخصيص لأي تقرير - مجانًا - بما في ذلك أجزاء من هذا التقرير، أو تحليل على مستوى الدولة، وحزمة بيانات Excel، بالإضافة إلى الاستفادة من العروض والخصومات الرائعة للشركات الناشئة والجامعات

سوق أجهزة استشعار جودة الهواء:

Air Quality Sensor Market
  • احصل على أهم اتجاهات السوق الرئيسية لهذا التقرير.
    ستتضمن هذه العينة المجانية تحليلاً للبيانات، بدءًا من اتجاهات السوق وحتى التقديرات والتوقعات.


محركات وفرص سوق أجهزة استشعار جودة الهواء


ارتفاع تلوث الهواء يصب في صالح السوق

لقد زاد تلوث الهواء مع إضافة السموم مثل الجسيمات الدقيقة بسبب التصنيع المتنامي. وقد طبقت الحكومات في العديد من البلدان لوائح صارمة في مناطقها المعنية ووضعت تدابير متنوعة للتخفيف من تلوث الهواء الناجم عن المواقع الصناعية. بالإضافة إلى ذلك، قامت الحكومات في عدد من البلدان، بما في ذلك الولايات المتحدة والهند وكندا، بتثبيت أجهزة استشعار جودة الهواء في محطات الطاقة والنفط والغاز والسيارات من أجل إدارة وتتبع مستويات التلوث. من خلال استخدام مراقبة جودة الهواء الخارجي، يمكن للمصانع التحكم في معدلات انبعاثاتها من خلال مراقبة مؤشر جودة الهواء حول وحداتها الصناعية.


فوائد أجهزة استشعار جودة الهواء

مع تزايد المخاوف البيئية في جميع أنحاء العالم، هناك حاجة لمراقبة جودة الهواء بشكل مستمر لاتخاذ إجراءات معينة لتقليل آثارها على البيئة. لذلك، يكتسب الطلب على تقنيات استشعار جودة الهواء زخمًا بسبب العديد من الفوائد التي تقدمها. فهو يساعد في خلق بيئة صحية من خلال مراقبة ظروف الهواء الداخلي / الخارجي في الوقت الفعلي. أجهزة استشعار جودة الهواء سهلة التركيب ويمكن توصيلها بسهولة بالهاتف المحمول والكمبيوتر حيث تعرض نتائج جودة الهواء. يمكنها اكتشاف مجموعة واسعة من المعلمات مثل درجة الحرارة وضغط الهواء والرطوبة والمزيد. مع التقدم التكنولوجي المستمر، تتحسن دقة هذه المستشعرات، مما يؤدي إلى الطلب عليها من قبل العديد من اللاعبين في الصناعات الواسعة مثل الوكالات الحكومية والمعاهد الأكاديمية والمستخدمين التجاريين والسكنيين وصناعة البتروكيماويات ومحطات توليد الطاقة وصناعة الأدوية وسلطات المدينة الذكية وغيرها. وبالتالي، لتلبية هذا الطلب، يطلق اللاعبون في السوق حلولاً تدفع سوق أجهزة استشعار جودة الهواء. على سبيل المثال، في يونيو 2021، أطلقت شركة Vaisala مستشعر جودة الهواء من الطراز العالمي يكمل حل المراقبة الخاص بها لتعزيز جودة الحياة والسلامة والكفاءة والاستدامة في المجتمعات.Vaisala launched a world-class air quality sensor complementing its monitoring solution to enhance quality of life, safety, efficiency, and sustainability in communities.


تقرير تحليل تجزئة سوق أجهزة استشعار جودة الهواء

إن القطاعات الرئيسية التي ساهمت في اشتقاق تحليل سوق مستشعر جودة الهواء هي النوع والموقع والمستخدم النهائي.

  • بناءً على النوع، يتم تقسيم السوق إلى ثابت ومحمول. احتل قطاع المطارات الثابتة حصة سوقية أكبر في عام 2023.
  • بحسب الموقع، يتم تقسيم السوق إلى أجهزة استشعار جودة الهواء الداخلي وأجهزة استشعار جودة الهواء الخارجي. وقد استحوذ قطاع أجهزة استشعار جودة الهواء الخارجي على أكبر حصة من السوق في عام 2023.
  • من حيث المستخدم النهائي، يتم تقسيم السوق إلى وكالات حكومية ومعاهد أكاديمية، ومستخدمين تجاريين وسكنيين، وصناعة البتروكيماويات، ومحطات توليد الطاقة، وصناعة الأدوية، وسلطات المدن الذكية، وغيرها. احتلت شريحة الوكالات الحكومية والمعاهد الأكاديمية الحصة الأكبر من السوق في عام 2023.


تحليل حصة سوق أجهزة استشعار جودة الهواء حسب المنطقة الجغرافية

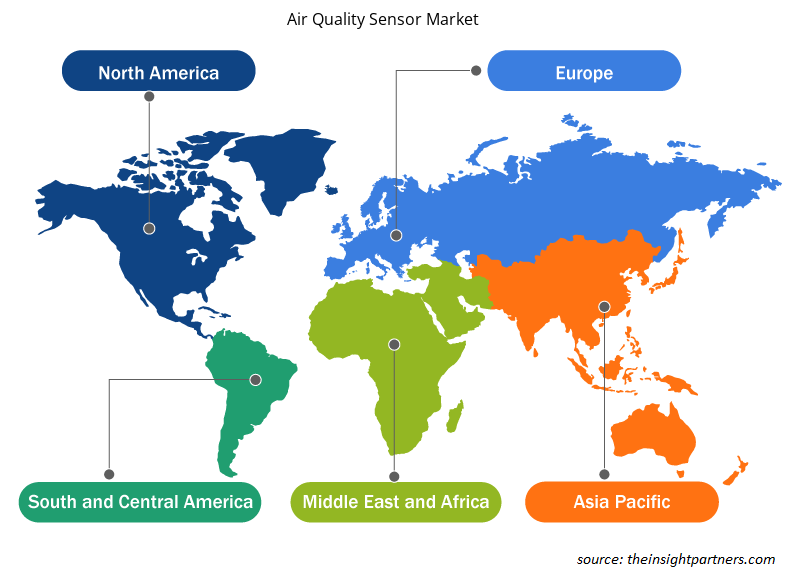
ينقسم النطاق الجغرافي لتقرير سوق مستشعر جودة الهواء بشكل أساسي إلى خمس مناطق: أمريكا الشمالية، ومنطقة آسيا والمحيط الهادئ، وأوروبا، والشرق الأوسط وأفريقيا، وأمريكا الجنوبية/أمريكا الجنوبية والوسطى.

من حيث الإيرادات، استحوذت منطقة آسيا والمحيط الهادئ على أكبر حصة في سوق أجهزة استشعار جودة الهواء في عام 2023. تتكون المنطقة من اقتصادات متقدمة ونامية مثل الهند واليابان والصين وغيرها، مما يدفع الطلب على هذه المستشعرات لتغذية بيئة نظيفة وآمنة. إن زيادة الوعي بشأن فوائد استخدام هذه المستشعرات تغذي نمو سوقها. بالإضافة إلى ذلك، تركز الهيئات الحكومية في المنطقة على تطوير هذه المستشعرات، مما يعزز نمو سوقها بشكل أكبر. على سبيل المثال، في يناير 2023، أطلقت MeitY تقنية نظام مراقبة جودة الهواء (AI-AQMS v1.0) التي تم تطويرها في إطار مشاريع تدعمها MeitY. قام مركز تطوير الحوسبة المتقدمة (C-DAC) في كولكاتا، بالتعاون مع TeXMIN وISM وDhanbad، في إطار "البرنامج الوطني للتطبيقات الإلكترونية وتكنولوجيا المعلومات والاتصالات في الزراعة والبيئة (AgriEnIcs)" بتطوير محطة مراقبة جودة الهواء الخارجي لمراقبة الملوثات البيئية التي تتضمن معلمات مثل PM 1.0 وPM 2.5 وPM 10.0 وSO2 وNO2 وCO وO2 ودرجة الحرارة المحيطة والرطوبة النسبية وما إلى ذلك، لتحليل جودة الهواء المستمر للبيئة.


رؤى إقليمية حول سوق أجهزة استشعار جودة الهواء

لقد قام المحللون في Insight Partners بشرح الاتجاهات والعوامل الإقليمية المؤثرة على سوق أجهزة استشعار جودة الهواء طوال فترة التوقعات بشكل شامل. يناقش هذا القسم أيضًا قطاعات سوق أجهزة استشعار جودة الهواء والجغرافيا في جميع أنحاء أمريكا الشمالية وأوروبا ومنطقة آسيا والمحيط الهادئ والشرق الأوسط وأفريقيا وأمريكا الجنوبية والوسطى.
Air Quality Sensor Market
  • احصل على البيانات الإقليمية المحددة لسوق أجهزة استشعار جودة الهواء

نطاق تقرير سوق أجهزة استشعار جودة الهواء

سمة التقريرتفاصيل
حجم السوق في عام 20231054.72 مليون دولار أمريكي
حجم السوق بحلول عام 20311723.45 مليون دولار أمريكي
معدل النمو السنوي المركب العالمي (2023 - 2031)6.3%
البيانات التاريخية2021-2022
فترة التنبؤ2024-2031
القطاعات المغطاةحسب النوع
  • ثابتة ومحمولة
حسب الموقع
  • أجهزة استشعار جودة الهواء الداخلي وأجهزة استشعار جودة الهواء الخارجي
حسب المستخدم النهائي
  • الهيئات الحكومية والمؤسسات الأكاديمية
  • المستخدمون التجاريون والسكنيون
  • صناعة البتروكيماويات
  • محطات توليد الطاقة
  • صناعة الادوية
  • سلطات المدينة الذكية
المناطق والدول المغطاةأمريكا الشمالية
  • نحن
  • كندا
  • المكسيك
أوروبا
  • المملكة المتحدة
  • ألمانيا
  • فرنسا
  • روسيا
  • إيطاليا
  • بقية أوروبا
آسيا والمحيط الهادئ
  • الصين
  • الهند
  • اليابان
  • أستراليا
  • بقية منطقة آسيا والمحيط الهادئ
أمريكا الجنوبية والوسطى
  • البرازيل
  • الأرجنتين
  • بقية أمريكا الجنوبية والوسطى
الشرق الأوسط وأفريقيا
  • جنوب أفريقيا
  • المملكة العربية السعودية
  • الامارات العربية المتحدة
  • بقية الشرق الأوسط وأفريقيا
قادة السوق وملفات تعريف الشركات الرئيسية
  • مراقب الطاقة
  • شركة ميت ون انسترومنتس
  • السويس
  • شركة رينيساس للإلكترونيات
  • وينسن
  • هـ+هـ
  • إنفينيون تكنولوجيز
  • ايركوال
  • شركة سيمنز ايه جي
  • شركة هونيويل الدولية


كثافة اللاعبين في سوق أجهزة استشعار جودة الهواء: فهم تأثيرها على ديناميكيات الأعمال

يشهد سوق أجهزة استشعار جودة الهواء نموًا سريعًا، مدفوعًا بالطلب المتزايد من المستخدم النهائي بسبب عوامل مثل تفضيلات المستهلك المتطورة والتقدم التكنولوجي والوعي المتزايد بفوائد المنتج. ومع ارتفاع الطلب، تعمل الشركات على توسيع عروضها والابتكار لتلبية احتياجات المستهلكين والاستفادة من الاتجاهات الناشئة، مما يؤدي إلى زيادة نمو السوق.

تشير كثافة اللاعبين في السوق إلى توزيع الشركات أو المؤسسات العاملة في سوق أو صناعة معينة. وهي تشير إلى عدد المنافسين (اللاعبين في السوق) الموجودين في مساحة سوق معينة نسبة إلى حجمها أو قيمتها السوقية الإجمالية.

الشركات الرئيسية العاملة في سوق أجهزة استشعار جودة الهواء هي:

  1. مراقب الطاقة
  2. شركة ميت ون انسترومنتس
  3. السويس
  4. شركة رينيساس للإلكترونيات
  5. وينسن
  6. هـ+هـ

إخلاء المسؤولية : الشركات المذكورة أعلاه ليست مرتبة بأي ترتيب معين.

Air Quality Sensor Market


  • احصل على نظرة عامة على أهم اللاعبين الرئيسيين في سوق أجهزة استشعار جودة الهواء


أخبار سوق أجهزة استشعار جودة الهواء والتطورات الأخيرة

يتم تقييم سوق أجهزة استشعار جودة الهواء من خلال جمع البيانات النوعية والكمية بعد البحث الأولي والثانوي، والتي تتضمن منشورات الشركات المهمة وبيانات الجمعيات وقواعد البيانات. فيما يلي قائمة بالتطورات في السوق:

  • في مارس 2024، أعلنت شركة Vaisala، الرائدة عالميًا في مجال أدوات القياس والاستخبارات للعمل المناخي، عن إطلاق جهاز Air Quality Transmitter 560 (AQT560)، وهو جهاز استشعار جودة الهواء المدمج القياسي الذهبي مع نطاق اكتشاف واسع - PM1 وPM2.5 وPM10 - ونظام معايرة فريد وخوارزميات تمكن من دقة وكفاءة اكتشاف لا مثيل لها. (المصدر: Vaisala, Inc، بيان صحفي، 2024)
  • في يناير 2024، قدمت شركة Attune، الرائدة في مجال حلول البيانات في الوقت الفعلي، أحدث ابتكاراتها مع مجموعة جودة الهواء الخارجي (OAQ)، وهي عبارة عن منصة تعتمد على المستشعرات ومصممة لمراقبة جودة الهواء حول أي موقع معين. من خلال الاستفادة من أجهزة استشعار مراقبة جودة الهواء الداخلي المعتمدة من UL-2905 والمعاد استخدامها للاستخدام في الهواء الطلق، تقدم مجموعة OAQ بيانات شاملة حول التهديدات المختلفة للهواء الخارجي. تكتشف تقنية التوصيل والتشغيل متعددة المستشعرات الملوثات مثل درجة الحرارة والرطوبة النسبية والمركبات العضوية المتطايرة (VOCs) والجسيمات (PM)، مما يوفر للمشغلين رؤى بالغة الأهمية لاتخاذ القرارات الاستباقية. (المصدر: Attune، بيان صحفي، 2024)


تقرير سوق أجهزة استشعار جودة الهواء والتغطية والنتائج المتوقعة

يوفر تقرير "حجم سوق مستشعر جودة الهواء والتوقعات (2021-2031)" تحليلاً مفصلاً للسوق يغطي المجالات التالية:

  • حجم السوق والتوقعات على المستويات العالمية والإقليمية والوطنية لجميع قطاعات السوق الرئيسية التي يغطيها النطاق
  • ديناميكيات السوق مثل المحركات والقيود والفرص الرئيسية
  • الاتجاهات المستقبلية الرئيسية
  • تحليل مفصل لقوى PEST/Porter الخمس وSWOT
  • تحليل السوق العالمي والإقليمي الذي يغطي اتجاهات السوق الرئيسية واللاعبين الرئيسيين واللوائح والتطورات الأخيرة في السوق
  • تحليل المشهد الصناعي والمنافسة الذي يغطي تركيز السوق، وتحليل خريطة الحرارة، واللاعبين البارزين، والتطورات الأخيرة
  • ملفات تعريف الشركة التفصيلية
  • Historical Analysis (2 Years), Base Year, Forecast (7 Years) with CAGR
  • PEST and SWOT Analysis
  • Market Size Value / Volume - Global, Regional, Country
  • Industry and Competitive Landscape
  • Excel Dataset
Report Coverage
Report Coverage

Revenue forecast, Company Analysis, Industry landscape, Growth factors, and Trends

Segment Covered
Segment Covered

This text is related
to segments covered.

Regional Scope
Regional Scope

North America, Europe, Asia Pacific, Middle East & Africa, South & Central America

Country Scope
Country Scope

This text is related
to country scope.

Frequently Asked Questions


What is the estimated market size for the global air quality sensor market in 2023?

The global air quality sensor market was estimated to be US$ 1054.72 million in 2023 and is expected to grow at a CAGR of 6.3% during the forecast period 2023 – 2031.

What are the driving factors impacting the global air quality sensor market?

Growing air pollution and government focus on sustainability are the major factors that propel the global air quality sensor market.

What are the future trends of the global air quality sensor market?

Artificial intelligence-assisted air quality monitoring system is anticipated to play a significant role in the global air quality sensor market in the coming years.

Which are the key players holding the major market share of the global air quality sensor market?

The key players holding majority shares in the global air quality sensor market are Energomonitor, E+E, Infineon Technologies, Siemens AG, and Honeywell International Inc.

What will be the market size of the global air quality sensor market by 2031?

The global air quality sensor market is expected to reach US$ 1723.45 million by 2031.

What is the incremental growth of the global air quality sensor market during the forecast period?

The incremental growth expected to be recorded for the global air quality sensor market during the forecast period is US$ 668.73 million.

Trends and growth analysis reports related to Electronics and Semiconductor : READ MORE..   
Your data will never be shared with third parties, however, we may send you information from time to time about our products that may be of interest to you. By submitting your details, you agree to be contacted by us. You may contact us at any time to opt-out.


Buy Now  

The Insight Partners performs research in 4 major stages: Data Collection & Secondary Research, Primary Research, Data Analysis and Data Triangulation & Final Review.

  1. Data Collection and Secondary Research:

As a market research and consulting firm operating from a decade, we have published and advised several client across the globe. First step for any study will start with an assessment of currently available data and insights from existing reports. Further, historical and current market information is collected from Investor Presentations, Annual Reports, SEC Filings, etc., and other information related to company’s performance and market positioning are gathered from Paid Databases (Factiva, Hoovers, and Reuters) and various other publications available in public domain.

Several associations trade associates, technical forums, institutes, societies and organization are accessed to gain technical as well as market related insights through their publications such as research papers, blogs and press releases related to the studies are referred to get cues about the market. Further, white papers, journals, magazines, and other news articles published in last 3 years are scrutinized and analyzed to understand the current market trends.

  1. Primary Research:

The primarily interview analysis comprise of data obtained from industry participants interview and answers to survey questions gathered by in-house primary team.

For primary research, interviews are conducted with industry experts/CEOs/Marketing Managers/VPs/Subject Matter Experts from both demand and supply side to get a 360-degree view of the market. The primary team conducts several interviews based on the complexity of the markets to understand the various market trends and dynamics which makes research more credible and precise.

A typical research interview fulfils the following functions:

  • Provides first-hand information on the market size, market trends, growth trends, competitive landscape, and outlook
  • Validates and strengthens in-house secondary research findings
  • Develops the analysis team’s expertise and market understanding

Primary research involves email interactions and telephone interviews for each market, category, segment, and sub-segment across geographies. The participants who typically take part in such a process include, but are not limited to:

  • Industry participants: VPs, business development managers, market intelligence managers and national sales managers
  • Outside experts: Valuation experts, research analysts and key opinion leaders specializing in the electronics and semiconductor industry.

Below is the breakup of our primary respondents by company, designation, and region:

Research Methodology

Once we receive the confirmation from primary research sources or primary respondents, we finalize the base year market estimation and forecast the data as per the macroeconomic and microeconomic factors assessed during data collection.

  1. Data Analysis:

Once data is validated through both secondary as well as primary respondents, we finalize the market estimations by hypothesis formulation and factor analysis at regional and country level.

  • Macro-Economic Factor Analysis:

We analyse macroeconomic indicators such the gross domestic product (GDP), increase in the demand for goods and services across industries, technological advancement, regional economic growth, governmental policies, the influence of COVID-19, PEST analysis, and other aspects. This analysis aids in setting benchmarks for various nations/regions and approximating market splits. Additionally, the general trend of the aforementioned components aid in determining the market's development possibilities.

  • Country Level Data:

Various factors that are especially aligned to the country are taken into account to determine the market size for a certain area and country, including the presence of vendors, such as headquarters and offices, the country's GDP, demand patterns, and industry growth. To comprehend the market dynamics for the nation, a number of growth variables, inhibitors, application areas, and current market trends are researched. The aforementioned elements aid in determining the country's overall market's growth potential.

  • Company Profile:

The “Table of Contents” is formulated by listing and analyzing more than 25 - 30 companies operating in the market ecosystem across geographies. However, we profile only 10 companies as a standard practice in our syndicate reports. These 10 companies comprise leading, emerging, and regional players. Nonetheless, our analysis is not restricted to the 10 listed companies, we also analyze other companies present in the market to develop a holistic view and understand the prevailing trends. The “Company Profiles” section in the report covers key facts, business description, products & services, financial information, SWOT analysis, and key developments. The financial information presented is extracted from the annual reports and official documents of the publicly listed companies. Upon collecting the information for the sections of respective companies, we verify them via various primary sources and then compile the data in respective company profiles. The company level information helps us in deriving the base number as well as in forecasting the market size.

  • Developing Base Number:

Aggregation of sales statistics (2020-2022) and macro-economic factor, and other secondary and primary research insights are utilized to arrive at base number and related market shares for 2022. The data gaps are identified in this step and relevant market data is analyzed, collected from paid primary interviews or databases. On finalizing the base year market size, forecasts are developed on the basis of macro-economic, industry and market growth factors and company level analysis.

  1. Data Triangulation and Final Review:

The market findings and base year market size calculations are validated from supply as well as demand side. Demand side validations are based on macro-economic factor analysis and benchmarks for respective regions and countries. In case of supply side validations, revenues of major companies are estimated (in case not available) based on industry benchmark, approximate number of employees, product portfolio, and primary interviews revenues are gathered. Further revenue from target product/service segment is assessed to avoid overshooting of market statistics. In case of heavy deviations between supply and demand side values, all thes steps are repeated to achieve synchronization.

We follow an iterative model, wherein we share our research findings with Subject Matter Experts (SME’s) and Key Opinion Leaders (KOLs) until consensus view of the market is not formulated – this model negates any drastic deviation in the opinions of experts. Only validated and universally acceptable research findings are quoted in our reports.

We have important check points that we use to validate our research findings – which we call – data triangulation, where we validate the information, we generate from secondary sources with primary interviews and then we re-validate with our internal data bases and Subject matter experts. This comprehensive model enables us to deliver high quality, reliable data in shortest possible time.