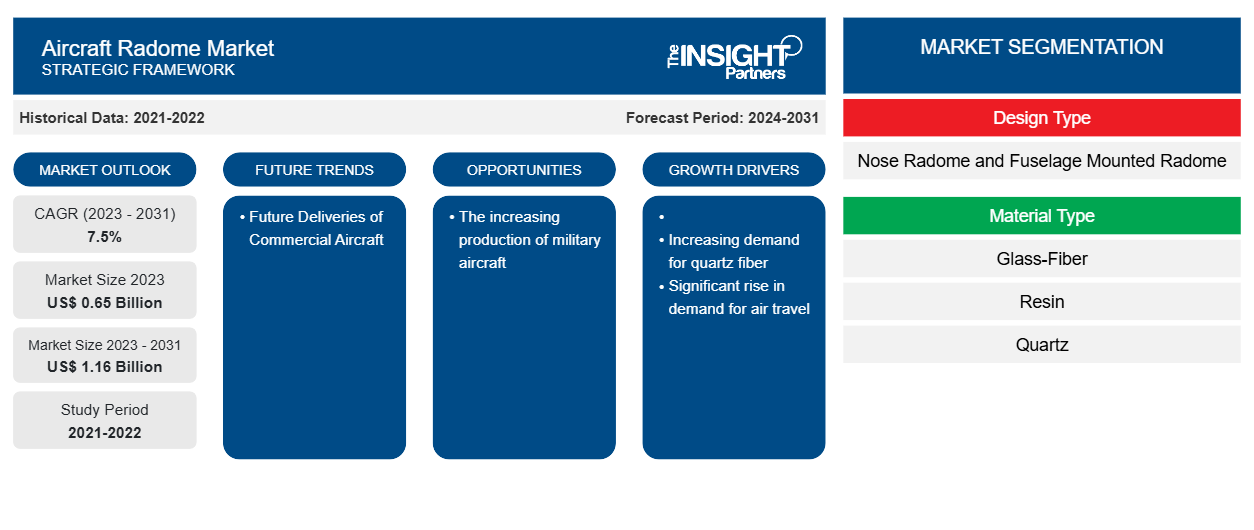
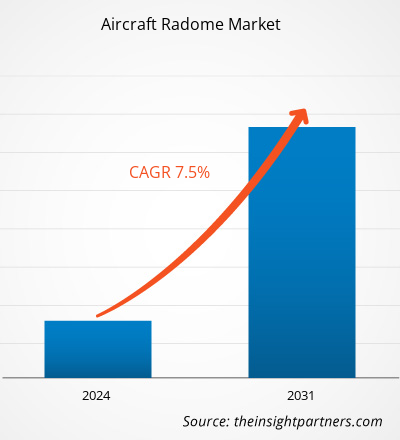
من المتوقع أن يصل حجم سوق قبة رادار الطائرات إلى 1.16 مليار دولار أمريكي بحلول عام 2031 من 0.65 مليار دولار أمريكي في عام 2023. ومن المتوقع أن يسجل السوق معدل نمو سنوي مركب بنسبة 7.5٪ في الفترة 2023-2031. إن نشر الطائرات العسكرية بأعداد كبيرة يولد طلبًا جديدًا على أنظمة قبة رادار الطائرات . تتكون صناعة تصنيع قبة رادار الطائرات من أعداد كبيرة من الشركات الراسخة والمعروفة جيدًا مثل شركة جنرال ديناميكس، وجينوبتيك ، وإيرباص، وأوربيتال إيه تي كيه ، وباركر هانيفين كورب وغيرها. يستحوذ مصنعو قبة الرادار الحاليون على معظم العقود من كبرى شركات تصنيع الطائرات، مما يحد من دخول الشركات الجديدة إلى الصناعة. تتكبد الاستثمارات الرأسمالية المشاركة في إنشاء شركة جديدة لتصنيع مكونات الطائرات تكاليف باهظة، وهو ما يشكل مصدر قلق كبير للوافدين الجدد إلى الصناعة.
تحليل سوق قبة رادار الطائرات
تتكون صناعة تصنيع قبة رادار الطائرات من أعداد كبيرة من الشركات الراسخة والمعترف بها جيدًا مثل شركة جنرال ديناميكس، وجينوبتيك ، وإيرباص، وأوربيتال إيه تي كيه ، وميجيت بي إل سي وغيرها. تستحوذ شركات تصنيع قبة الرادار الحالية على معظم العقود من شركات تصنيع الطائرات الكبرى، مما يحد من دخول الشركات الجديدة إلى الصناعة. وبسبب ذلك، فإن التهديدات التي تواجه الشركات الجديدة في سوق قبة رادار الطائرات منخفضة للغاية. تتكبد الاستثمارات الرأسمالية المشاركة في إنشاء شركة جديدة لتصنيع مكونات الطائرات تكاليف ضخمة، وهو ما يشكل مصدر قلق كبير للشركات الجديدة في الصناعة.
نظرة عامة على سوق قبة الطائرات
يُعد غطاء الرادار مكونًا هيكليًا مغطى للطائرة، يحمي الهوائي من المعلمات البيئية المختلفة، فضلاً عن العوامل الخارجية مثل اصطدام الطيور والصواعق. في الوقت نفسه، يزيد غطاء الرادار من ميزة التخفي للطائرة. يتم تحقيق ذلك من خلال تصنيع غطاء الرادار بمواد مركبة عالية الجودة وتكنولوجيا متقدمة. تتطلب صيانة المركبات عالية الجودة والتكنولوجيا المتقدمة من أجل زيادة الكفاءة التشغيلية لغطاء الرادار عمالة هندسية عالية المهارة. إن نقص العمالة الهندسية الماهرة في أجزاء مختلفة من العالم يحد من قدرة مصنعي الطائرات على تبني غطاء الرادار المتقدم تقنيًا ، وبالتالي تثبيط نمو سوق غطاء الرادار للطائرات خلال الفترة.
قم بتخصيص هذا التقرير ليناسب متطلباتك
ستحصل على تخصيص لأي تقرير - مجانًا - بما في ذلك أجزاء من هذا التقرير، أو تحليل على مستوى الدولة، وحزمة بيانات Excel، بالإضافة إلى الاستفادة من العروض والخصومات الرائعة للشركات الناشئة والجامعات
- احصل على أهم اتجاهات السوق الرئيسية لهذا التقرير.ستتضمن هذه العينة المجانية تحليلاً للبيانات، بدءًا من اتجاهات السوق وحتى التقديرات والتوقعات.
محركات وفرص سوق قبة الطائرات
تزايد عدد الطائرات في جميع أنحاء العالم
إن زيادة أسطول الطائرات عبر المناطق المختلفة هو أحد العوامل الرئيسية التي تدعم نمو سوق قبب الطائرات على مستوى العالم. الطلب على الطائرات التجارية الجديدة آخذ في الارتفاع؛ كما تلقت غالبية شركات تصنيع الطائرات الأصلية، مثل إيرباص وبوينج، عددًا كبيرًا من الطلبات على طرازات مختلفة من الطائرات مثل سلسلة A320 وسلسلة B787 وسلسلة A330 وسلسلة B737. تعد هذه الطائرات من أكثر طرازات الطائرات التجارية استخدامًا والتي تستحوذ على حصة الأغلبية في أسطول الطائرات في جميع أنحاء العالم. وهذا يدفع أيضًا إنتاج مثل هذه النماذج من الطائرات وبالتالي توليد طلب جديد على تركيب قبب الطائرات عبر مناطق مختلفة.
من المرجح أن تولد عمليات التسليم القادمة للطائرات فرصًا مستقبلية لمصنعي قبة الرادار
من المرجح أن تولد عمليات التسليم المتوقعة للطائرات التجارية والطائرات العسكرية وطائرات الطيران العام فرصًا جديدة لبائعي السوق خلال فترة التوقعات. ومن المرجح أن تولد عمليات التسليم القادمة لأكثر من 40 ألف طائرة تجارية في السنوات العشرين القادمة فرصًا هائلة لبائعي سوق قبة الطائرات في السنوات القادمة.
علاوة على ذلك، فإن ارتفاع عقود شراء الطائرات العسكرية يشكل عاملاً رئيسياً آخر من المرجح أن يولد فرصاً جديدة للبائعين في السوق في السنوات القادمة. ويدعم هذا أيضاً الإنفاق العسكري المتزايد في مختلف البلدان حول العالم.
تقرير تحليلي لتجزئة سوق قبة رادار الطائرات
إن القطاعات الرئيسية التي ساهمت في اشتقاق تحليل سوق قبة الطائرات هي نوع التصميم ونوع المادة ونوع الطائرة والجغرافيا.
- بناءً على نوع التصميم، تم تقسيم سوق قبة الرادار للطائرات إلى قبة رادار أنف وقبة رادار مثبتة على جسم الطائرة. احتلت شريحة قبة الرادار أنف حصة سوقية أكبر في عام 2023.
- بحسب نوع المادة، تم تقسيم السوق إلى ألياف زجاجية وراتينج وكوارتز. احتل قطاع الألياف الزجاجية الحصة الأكبر من السوق في عام 2023.
- من حيث نوع الطائرات، تم تقسيم السوق إلى مدنية وعسكرية. يهيمن القطاع المدني على السوق في عام 2023.
تحليل حصة سوق قبة رادار الطائرات حسب المنطقة الجغرافية
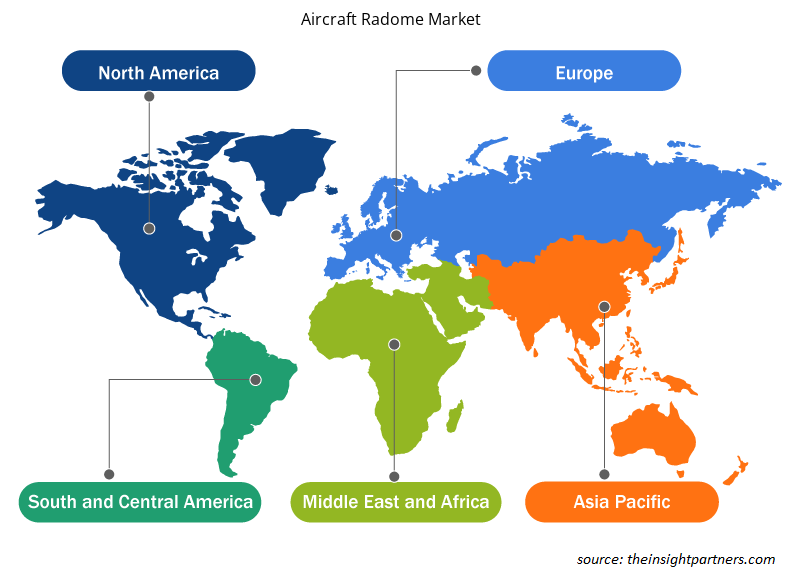
ينقسم النطاق الجغرافي لتقرير سوق رادار الطائرات بشكل أساسي إلى خمس مناطق: أمريكا الشمالية وأوروبا وآسيا والمحيط الهادئ والشرق الأوسط وأفريقيا وأمريكا الجنوبية.
سيطرت منطقة آسيا والمحيط الهادئ على سوق قبة الطائرات في عام 2023، ومن المرجح أن تشهد أعلى معدل نمو سنوي مركب خلال فترة التوقعات أيضًا. نشأت سوق قبة الطائرات في منطقة آسيا والمحيط الهادئ بشكل أساسي بسبب زيادة شراء الطائرات المدنية والعسكرية عبر مختلف البلدان. على سبيل المثال، وفقًا لتوقعات إيرباص، من المتوقع تسليم ما يقرب من 9500 طائرة بحلول نهاية عام 2042 في منطقة آسيا والمحيط الهادئ، ومن المتوقع أيضًا أن تولد الطلب على قبب الطائرات في جميع أنحاء منطقة آسيا والمحيط الهادئ في السنوات القادمة. علاوة على ذلك، فإن ارتفاع حركة الركاب الجويين، وارتفاع الدخل المتاح، وإدخال شركات الطيران منخفضة التكلفة هي بعض العوامل الأخرى التي تدعم شراء طائرات جديدة وبالتالي دفع سوق قبب الطائرات والمكونات الأخرى أيضًا في منطقة آسيا والمحيط الهادئ.
رؤى إقليمية حول سوق قبة رادار الطائرات
لقد قام المحللون في Insight Partners بشرح الاتجاهات والعوامل الإقليمية المؤثرة على سوق قبة الطائرات طوال فترة التوقعات بشكل شامل. يناقش هذا القسم أيضًا قطاعات سوق قبة الطائرات والجغرافيا في جميع أنحاء أمريكا الشمالية وأوروبا ومنطقة آسيا والمحيط الهادئ والشرق الأوسط وأفريقيا وأمريكا الجنوبية والوسطى.

- احصل على البيانات الإقليمية المحددة لسوق قبة الطائرات
نطاق تقرير سوق قبة الطائرات
| سمة التقرير | تفاصيل |
|---|---|
| حجم السوق في عام 2023 | 0.65 مليار دولار أمريكي |
| حجم السوق بحلول عام 2031 | 1.16 مليار دولار أمريكي |
| معدل النمو السنوي المركب العالمي (2023 - 2031) | 7.5% |
| البيانات التاريخية | 2021-2022 |
| فترة التنبؤ | 2024-2031 |
| القطاعات المغطاة | حسب نوع التصميم
|
| المناطق والدول المغطاة | أمريكا الشمالية
|
| قادة السوق وملفات تعريف الشركات الرئيسية |
|
كثافة اللاعبين في سوق قبة الطائرات: فهم تأثيرها على ديناميكيات الأعمال
يشهد سوق قبة الطائرات نموًا سريعًا، مدفوعًا بالطلب المتزايد من المستخدم النهائي بسبب عوامل مثل تفضيلات المستهلك المتطورة والتقدم التكنولوجي والوعي المتزايد بفوائد المنتج. ومع ارتفاع الطلب، تعمل الشركات على توسيع عروضها والابتكار لتلبية احتياجات المستهلكين والاستفادة من الاتجاهات الناشئة، مما يؤدي إلى زيادة نمو السوق.
تشير كثافة اللاعبين في السوق إلى توزيع الشركات أو المؤسسات العاملة في سوق أو صناعة معينة. وهي تشير إلى عدد المنافسين (اللاعبين في السوق) الموجودين في مساحة سوق معينة نسبة إلى حجمها أو قيمتها السوقية الإجمالية.
الشركات الرئيسية العاملة في سوق قبة الطائرات هي:
- إيرباص ساس
- شركة جنرال داينامكس
- شركة جينوبتيك ايه جي
- مركبات كيتساب
- شركة ميجيت المحدودة
إخلاء المسؤولية : الشركات المذكورة أعلاه ليست مرتبة بأي ترتيب معين.

- احصل على نظرة عامة على أهم اللاعبين الرئيسيين في سوق قبة الطائرات
أخبار سوق قبة الطائرات والتطورات الأخيرة
يتم تقييم سوق قبة رادار الطائرات من خلال جمع البيانات النوعية والكمية بعد البحث الأولي والثانوي، والذي يتضمن منشورات الشركات المهمة وبيانات الجمعيات وقواعد البيانات. فيما يلي قائمة بالتطورات في سوق قبة رادار الطائرات والاستراتيجيات:
- في أغسطس 2023، أجرت شركة QinetiQ Airborne Technology Demonstrator (ATD) بالشراكة مع BAE Systems، بدعم من اتفاقية الشراكة طويلة الأجل مع وزارة الدفاع، اختبار طيران بنظام أنف الطائرة المقاتلة (رادار الطائرة النفاثة السريعة) المثبت على RJ100، مما يمهد الطريق لقدرة التكامل بين الرادار والمستشعر في المستقبل. (المصدر: QinetiQ، بيان صحفي/موقع الشركة/النشرة الإخبارية)
- في مايو 2021، سلمت شركة جنرال ديناميكس ميشن سيستمز رادار الأنف رقم 500 عريض النطاق إلى شركة لوكهيد مارتن للتثبيت على متن طائرات القوات الجوية الأمريكية والبحرية الأمريكية ومشاة البحرية الأمريكية والطائرات العسكرية الدولية إف-35. (المصدر: جنرال ديناميكس ميشن سيستمز، بيان صحفي/موقع الشركة على الإنترنت/النشرة الإخبارية)
تقرير سوق قبة رادار الطائرات والتغطية والنتائج المتوقعة
يوفر تقرير "حجم سوق قبة الطائرات والتوقعات (2021-2031)" تحليلاً مفصلاً للسوق يغطي المجالات التالية:
- حجم السوق والتوقعات على المستويات العالمية والإقليمية والوطنية لجميع قطاعات السوق الرئيسية التي يغطيها النطاق
- ديناميكيات السوق مثل المحركات والقيود والفرص الرئيسية
- الاتجاهات المستقبلية الرئيسية
- تحليل مفصل لقوى بورتر الخمس
- تحليل السوق العالمي والإقليمي الذي يغطي اتجاهات السوق الرئيسية واللاعبين الرئيسيين واللوائح والتطورات الأخيرة في السوق
- تحليل المشهد الصناعي والمنافسة الذي يغطي تركيز السوق، وتحليل خريطة الحرارة، واللاعبين البارزين، والتطورات الأخيرة
- ملفات تعريف تفصيلية للشركة مع تحليل SWOT
- التحليل التاريخي (سنتان)، السنة الأساسية، التوقعات (7 سنوات) مع معدل النمو السنوي المركب
- تحليل PEST و SWOT
- حجم السوق والقيمة / الحجم - عالميًا وإقليميًا وقطريًا
- الصناعة والمنافسة
- مجموعة بيانات Excel


- Integrated Platform Management System Market
- Water Pipeline Leak Detection System Market
- Authentication and Brand Protection Market
- Bio-Based Ethylene Market
- Third Party Logistics Market
- Dropshipping Market
- Influenza Vaccines Market
- Vision Guided Robotics Software Market
- Queue Management System Market
- Cell Line Development Market

Report Coverage
Revenue forecast, Company Analysis, Industry landscape, Growth factors, and Trends

Segment Covered
This text is related
to segments covered.

Regional Scope
North America, Europe, Asia Pacific, Middle East & Africa, South & Central America

Country Scope
This text is related
to country scope.
الأسئلة الشائعة
Asia Pacific region dominated the aircraft radome market in 2023.
Increasing demand for quartz fiber and significant rise in demand for air travel are some of the factors driving the growth for aircraft radome market.
The increasing production of military aircraft is one of the major trends of the market.
Airbus SAS, General Dynamics Corporation, Jenoptik AG, Orbitall ATK, Saint Gobain, Starwin Industries, Vermont Composites Inc, Parker Hannifin Corpoation, Nordam Group, and Kitsap Composites are some of the key players profiled under the report.
The estimated value of the aircraft radome market by 2031 would be around US$ 1.16 billion.
The aircraft radome market is likely to register of 7.5% during 2023-2031.
The Insight Partners performs research in 4 major stages: Data Collection & Secondary Research, Primary Research, Data Analysis and Data Triangulation & Final Review.
- Data Collection and Secondary Research:
As a market research and consulting firm operating from a decade, we have published and advised several client across the globe. First step for any study will start with an assessment of currently available data and insights from existing reports. Further, historical and current market information is collected from Investor Presentations, Annual Reports, SEC Filings, etc., and other information related to company’s performance and market positioning are gathered from Paid Databases (Factiva, Hoovers, and Reuters) and various other publications available in public domain.
Several associations trade associates, technical forums, institutes, societies and organization are accessed to gain technical as well as market related insights through their publications such as research papers, blogs and press releases related to the studies are referred to get cues about the market. Further, white papers, journals, magazines, and other news articles published in last 3 years are scrutinized and analyzed to understand the current market trends.
- Primary Research:
The primarily interview analysis comprise of data obtained from industry participants interview and answers to survey questions gathered by in-house primary team.
For primary research, interviews are conducted with industry experts/CEOs/Marketing Managers/VPs/Subject Matter Experts from both demand and supply side to get a 360-degree view of the market. The primary team conducts several interviews based on the complexity of the markets to understand the various market trends and dynamics which makes research more credible and precise.
A typical research interview fulfils the following functions:
- Provides first-hand information on the market size, market trends, growth trends, competitive landscape, and outlook
- Validates and strengthens in-house secondary research findings
- Develops the analysis team’s expertise and market understanding
Primary research involves email interactions and telephone interviews for each market, category, segment, and sub-segment across geographies. The participants who typically take part in such a process include, but are not limited to:
- Industry participants: VPs, business development managers, market intelligence managers and national sales managers
- Outside experts: Valuation experts, research analysts and key opinion leaders specializing in the electronics and semiconductor industry.
Below is the breakup of our primary respondents by company, designation, and region:

Once we receive the confirmation from primary research sources or primary respondents, we finalize the base year market estimation and forecast the data as per the macroeconomic and microeconomic factors assessed during data collection.
- Data Analysis:
Once data is validated through both secondary as well as primary respondents, we finalize the market estimations by hypothesis formulation and factor analysis at regional and country level.
- Macro-Economic Factor Analysis:
We analyse macroeconomic indicators such the gross domestic product (GDP), increase in the demand for goods and services across industries, technological advancement, regional economic growth, governmental policies, the influence of COVID-19, PEST analysis, and other aspects. This analysis aids in setting benchmarks for various nations/regions and approximating market splits. Additionally, the general trend of the aforementioned components aid in determining the market's development possibilities.
- Country Level Data:
Various factors that are especially aligned to the country are taken into account to determine the market size for a certain area and country, including the presence of vendors, such as headquarters and offices, the country's GDP, demand patterns, and industry growth. To comprehend the market dynamics for the nation, a number of growth variables, inhibitors, application areas, and current market trends are researched. The aforementioned elements aid in determining the country's overall market's growth potential.
- Company Profile:
The “Table of Contents” is formulated by listing and analyzing more than 25 - 30 companies operating in the market ecosystem across geographies. However, we profile only 10 companies as a standard practice in our syndicate reports. These 10 companies comprise leading, emerging, and regional players. Nonetheless, our analysis is not restricted to the 10 listed companies, we also analyze other companies present in the market to develop a holistic view and understand the prevailing trends. The “Company Profiles” section in the report covers key facts, business description, products & services, financial information, SWOT analysis, and key developments. The financial information presented is extracted from the annual reports and official documents of the publicly listed companies. Upon collecting the information for the sections of respective companies, we verify them via various primary sources and then compile the data in respective company profiles. The company level information helps us in deriving the base number as well as in forecasting the market size.
- Developing Base Number:
Aggregation of sales statistics (2020-2022) and macro-economic factor, and other secondary and primary research insights are utilized to arrive at base number and related market shares for 2022. The data gaps are identified in this step and relevant market data is analyzed, collected from paid primary interviews or databases. On finalizing the base year market size, forecasts are developed on the basis of macro-economic, industry and market growth factors and company level analysis.
- Data Triangulation and Final Review:
The market findings and base year market size calculations are validated from supply as well as demand side. Demand side validations are based on macro-economic factor analysis and benchmarks for respective regions and countries. In case of supply side validations, revenues of major companies are estimated (in case not available) based on industry benchmark, approximate number of employees, product portfolio, and primary interviews revenues are gathered. Further revenue from target product/service segment is assessed to avoid overshooting of market statistics. In case of heavy deviations between supply and demand side values, all thes steps are repeated to achieve synchronization.
We follow an iterative model, wherein we share our research findings with Subject Matter Experts (SME’s) and Key Opinion Leaders (KOLs) until consensus view of the market is not formulated – this model negates any drastic deviation in the opinions of experts. Only validated and universally acceptable research findings are quoted in our reports.
We have important check points that we use to validate our research findings – which we call – data triangulation, where we validate the information, we generate from secondary sources with primary interviews and then we re-validate with our internal data bases and Subject matter experts. This comprehensive model enables us to deliver high quality, reliable data in shortest possible time.


 احصل على عينة مجانية لهذا التقرير