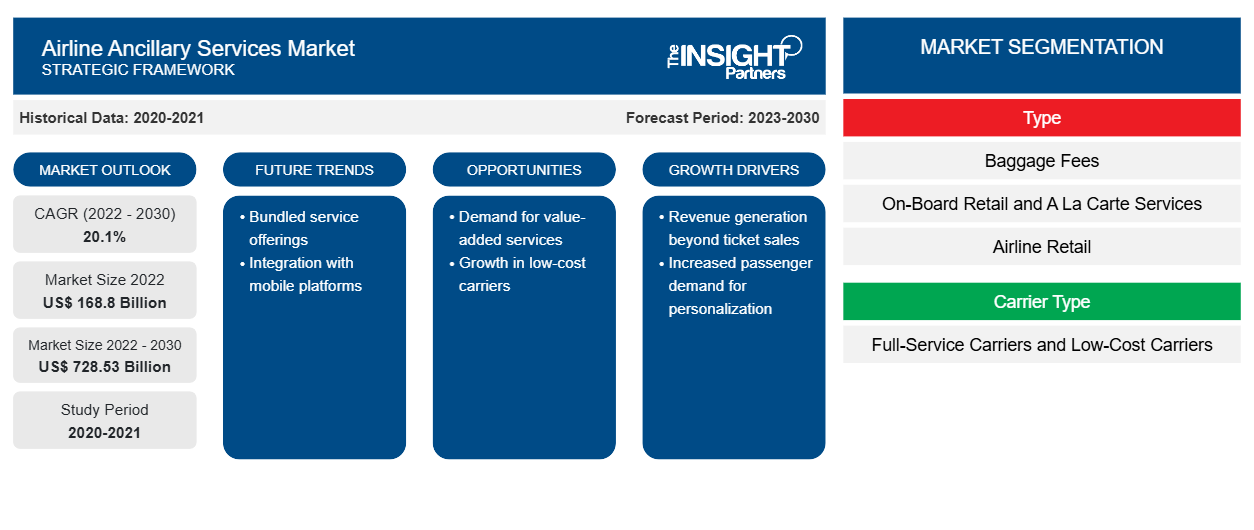
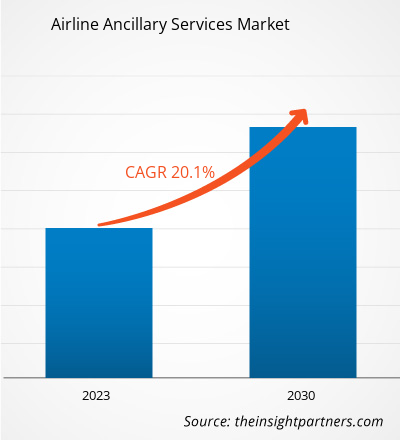
[تقرير بحثي] من المتوقع أن يصل حجم سوق الخدمات المساندة لشركات الطيران إلى 728.53 مليار دولار أمريكي بحلول عام 2030 من 168.80 مليار دولار أمريكي في عام 2022؛ ومن المتوقع أن يسجل السوق معدل نمو سنوي مركب بنسبة 20.1٪ من عام 2022 إلى عام 2030.
وجهة نظر المحلل:
يشهد اللاعبون الرئيسيون العاملون في سوق الخدمات المساندة لشركات الطيران زيادة في الطلب على خدمات مثل الترفيه وخدمة الواي فاي والتموين. إن العدد المتزايد من ركاب الطيران في جميع أنحاء العالم يدفع سوق الخدمات المساندة لشركات الطيران بشكل كبير. تعد الإيرادات المساندة أمرًا بالغ الأهمية لنموذج أعمال شركات الطيران؛ على سبيل المثال، في الأسواق المتقدمة مثل أمريكا الشمالية وأوروبا، أدركت شركات الطيران بما في ذلك رايان إير وسبيريت وأليجيانس أن الإيرادات المساندة تساهم بشكل كبير في إجمالي إيراداتها. سرعان ما تبنت الاقتصادات سريعة النمو في منطقة آسيا والمحيط الهادئ هذا الاتجاه، حيث شهدت شركات الطيران مثل إير آسيا أن خمس إيراداتها تأتي من الخدمات المساندة. وبالتالي، من المتوقع أن يؤثر هذا الاتجاه بشكل كبير على إيرادات شركات الطيران، وخاصة في الاقتصادات النامية، مما سيساهم بشكل أكبر في نمو سوق الخدمات المساندة لشركات الطيران.
نظرة عامة على سوق الخدمات المساعدة لشركات الطيران:
يستفيد سوق الخدمات الإضافية لشركات الطيران من رغبة الركاب في الدفع مقابل الخدمات التي تضيف قيمة إلى تجربتهم. تعد ترقيات المقاعد والحجز المسبق للمقاعد والأمتعة من بين الخدمات الإضافية الشائعة المطلوبة. تدخل العديد من الشركات الناشئة السوق لتلبية هذه الاحتياجات المتطورة. علاوة على ذلك، تكتسب شركات الطيران منخفضة التكلفة أهمية هائلة في صناعة الطيران العالمية. تسهل نماذج الأعمال القوية لحجز التذاكر وخدمات المطار والخدمات على متن الطائرة وغيرها من شركات الطيران منخفضة التكلفة جذب الركاب من جميع فئات المجتمع. من المتوقع أن يوفر الطلب المتزايد من الركاب على خدمات إضافية مثل خدمة الطعام والمشروبات على متن الطائرة وخدمة الواي فاي والتجزئة العديد من الفرص للشركات الناشئة. بصرف النظر عن الخدمات الإضافية المذكورة أعلاه، من المتوقع أن تؤثر خدمة الترفيه على متن الطائرة (IFE) على صناعة الخدمات الإضافية لشركات الطيران بشكل كبير. حيث يتوقع العملاء المثقفون رقميًا، وخاصة رجال الأعمال، أن تسهل شركات الطيران خيارات الاتصال على متن الطائرة. كما وجد أن معظم الركاب على الرحلات القصيرة يطلبون الوصول إلى الويب أثناء الصعود إلى الطائرة للوصول إلى أجهزتهم الرقمية. وبالتالي، من المتوقع أن يعزز الطلب المتزايد على الترفيه على متن الطائرة الإيرادات الإضافية، مما يؤثر بشكل إيجابي على نمو سوق الخدمات الإضافية لشركات الطيران.
قم بتخصيص هذا التقرير ليناسب متطلباتك
ستحصل على تخصيص لأي تقرير - مجانًا - بما في ذلك أجزاء من هذا التقرير، أو تحليل على مستوى الدولة، وحزمة بيانات Excel، بالإضافة إلى الاستفادة من العروض والخصومات الرائعة للشركات الناشئة والجامعات
- احصل على أهم اتجاهات السوق الرئيسية لهذا التقرير.ستتضمن هذه العينة المجانية تحليلاً للبيانات، بدءًا من اتجاهات السوق وحتى التقديرات والتوقعات.
محرك سوق الخدمات المساعدة لشركات الطيران:
ارتفاع تفضيل المسافرين من ذوي الدخل المتوسط للسفر الجوي
وفقًا لاتحاد النقل الجوي الدولي (IATA)، من المتوقع أن يصل عدد الركاب المسافرين جواً إلى حوالي 7.8 مليار بحلول عام 2036. يمكن ربط شريحة الطبقة المتوسطة الناشئة بسرعة بارتفاع عدد ركاب الطائرات في الاقتصادات النامية. في أكتوبر 2021، دخلت منظمات عالمية مثل منظمة السياحة العالمية التابعة للأمم المتحدة (UNWTO) ومنظمة الطيران المدني الدولي في شراكة لدعم انتعاش السفر والسياحة. في أكتوبر 2020، وقعت منظمة السياحة العالمية واتحاد النقل الجوي الدولي مذكرة تفاهم للعمل معًا لدعم استئناف السياحة العالمية. كان التركيز الرئيسي لهذه الاتفاقية على تعزيز ثقة عامة الناس في السفر الجوي، مما ساعد بشكل أكبر على زيادة الحركة الجوية. وفقًا للأمم المتحدة، فإن العدد المتزايد من المسافرين من الطبقة المتوسطة، وخاصة في الصين والهند، هو العامل الأساسي الذي يساهم في نمو السفر الجوي والخدمات المساعدة المختلفة. مع تعافي العالم من الانكماش الاقتصادي، يزداد الطلب على السفر الجوي. أدى الطلب المتزايد على السفر الجوي إلى زيادة إنتاج الطائرات، مما ساهم بشكل كبير في زيادة الطلب على الخدمات الإضافية مثل خدمة الواي فاي على متن الطائرة، والأمتعة الزائدة، والطعام والمشروبات، والتسوق أثناء الرحلة. إن التركيز المتزايد على تقديم خدمات محسنة لركاب الرحلات الجوية والعدد المتزايد من ركاب الطيران في جميع أنحاء العالم يدفعان نمو سوق الخدمات الإضافية لشركات الطيران.
التحليل القطاعي لسوق الخدمات المساعدة لشركات الطيران:
تنقسم سوق الخدمات الإضافية لشركات الطيران، حسب النوع، إلى رسوم الأمتعة، وتجارة التجزئة على متن الطائرة وقائمة الطعام، وتجارة التجزئة لشركات الطيران، وبيع أميال برنامج المسافر الدائم، وغيرها. احتلت شريحة رسوم الأمتعة أكبر حصة سوقية في عام 2022. رسوم الأمتعة هي رسوم إضافية تفرضها شركات الطيران لتسجيل الأمتعة أو حمل أمتعة إضافية على متن الرحلة. هذه الرسوم منفصلة عن سعر التذكرة الأساسي وتختلف بناءً على عوامل مثل شركة الطيران والوجهة ووزن الأمتعة أو حجمها. أصبحت رسوم الأمتعة ممارسة شائعة في صناعة الطيران، مما يسمح لشركات الطيران بتوليد إيرادات إضافية وتقديم خيارات أجرة أكثر مرونة للركاب. يمكن للمسافرين اختيار الدفع مقابل الأمتعة المسجلة أو اختيار أسعار أساسية أقل إذا سافروا بأمتعة يدوية فقط. كان تنفيذ رسوم الأمتعة جانبًا مهمًا من سوق الخدمات الإضافية لشركات الطيران، حيث يوفر لشركات الطيران وسيلة لزيادة الربحية ويقدم للركاب خيارات في تجربة سفرهم.
تحليل إقليمي لسوق الخدمات المساندة لشركات الطيران:
بلغ حجم خدمات الطيران المساعدة في أمريكا الشمالية 64.70 مليون دولار أمريكي في عام 2022؛ ومن المتوقع أن يسجل السوق معدل نمو سنوي مركب بنسبة 20.6٪ خلال الفترة 2023-2030، ليصل إلى قيمة 289.34 مليون دولار أمريكي بحلول عام 2030. ينقسم سوق خدمات الطيران المساعدة في أمريكا الشمالية إلى الولايات المتحدة وكندا والمكسيك. احتلت الولايات المتحدة أكبر حصة في سوق خدمات الطيران المساعدة في أمريكا الشمالية في عام 2022. ووفقًا لبيانات مكتب التحليل الاقتصادي، ارتفع الناتج المحلي الإجمالي للولايات المتحدة في الربع الرابع من السنة المالية 2022 بنسبة ~2.6٪؛ وكان هذا النمو في الناتج المحلي الإجمالي مدفوعًا في المقام الأول بالاستثمار التجاري القوي والإنفاق الاستهلاكي. تساهم صناعة الطيران بشكل كبير في النمو الاقتصادي الأمريكي الإجمالي. ومن المتوقع أن يشجع الإنفاق الاستهلاكي المتزايد والاستثمار التجاري في قطاع الطيران المدني نمو سوق خدمات الطيران المساعدة.
تحليل اللاعبين الرئيسيين في سوق الخدمات المساعدة لشركات الطيران:
تعد شركة United Airlines Holdings Inc، وAmerican Airlines Group Inc، وDelta Air Lines Inc، وEasyJet Plc، وDeutsche Lufthansa AG، وQantas Airways Ltd، وRyanair Holdings Plc، وSouthwest Airlines Co، وThe Emirates، وAir France KLM SA من بين اللاعبين الرئيسيين في سوق الخدمات المساعدة لشركات الطيران.
رؤى إقليمية حول سوق الخدمات المساندة لشركات الطيران
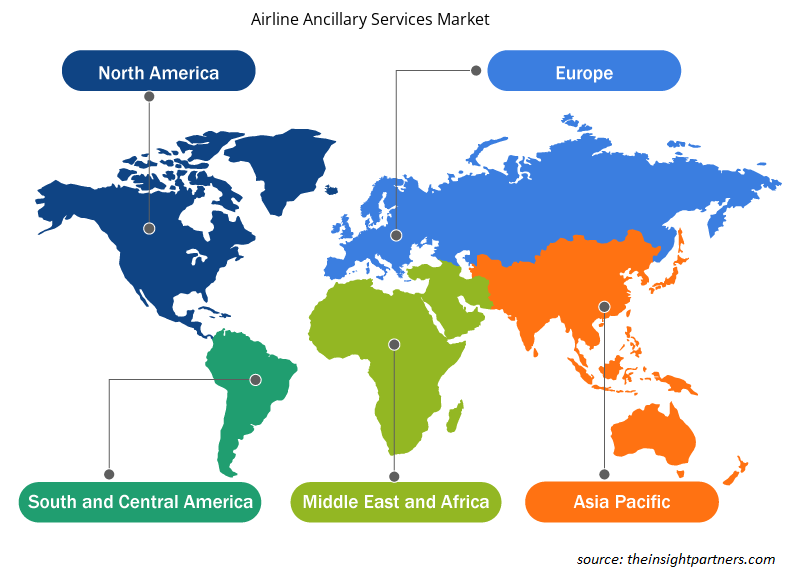
لقد قام المحللون في Insight Partners بشرح الاتجاهات والعوامل الإقليمية المؤثرة على سوق خدمات الطيران المساعدة طوال فترة التوقعات بشكل شامل. يناقش هذا القسم أيضًا قطاعات سوق خدمات الطيران المساعدة والجغرافيا في جميع أنحاء أمريكا الشمالية وأوروبا ومنطقة آسيا والمحيط الهادئ والشرق الأوسط وأفريقيا وأمريكا الجنوبية والوسطى.

- احصل على البيانات الإقليمية المحددة لسوق الخدمات المساعدة لشركات الطيران
نطاق تقرير سوق الخدمات المساعدة لشركات الطيران
| سمة التقرير | تفاصيل |
|---|---|
| حجم السوق في عام 2022 | 168.8 مليار دولار أمريكي |
| حجم السوق بحلول عام 2030 | 728.53 مليار دولار أمريكي |
| معدل النمو السنوي المركب العالمي (2022 - 2030) | 20.1% |
| البيانات التاريخية | 2020-2021 |
| فترة التنبؤ | 2023-2030 |
| القطاعات المغطاة | حسب النوع
|
| المناطق والدول المغطاة | أمريكا الشمالية
|
| قادة السوق وملفات تعريف الشركات الرئيسية |
|
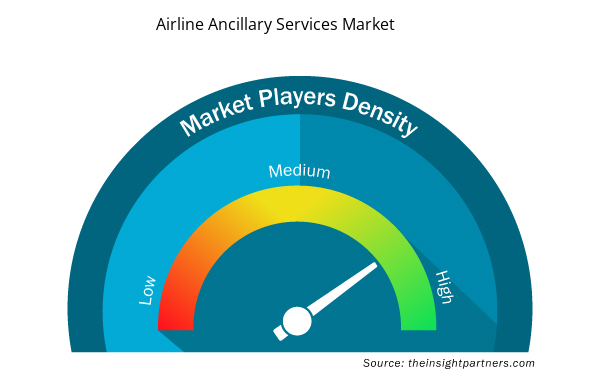
كثافة اللاعبين في سوق الخدمات المساندة لشركات الطيران: فهم تأثيرها على ديناميكيات الأعمال
يشهد سوق خدمات الدعم المساندة لشركات الطيران نموًا سريعًا، مدفوعًا بالطلب المتزايد من جانب المستخدم النهائي بسبب عوامل مثل تفضيلات المستهلكين المتطورة والتقدم التكنولوجي والوعي المتزايد بفوائد المنتج. ومع ارتفاع الطلب، تعمل الشركات على توسيع عروضها والابتكار لتلبية احتياجات المستهلكين والاستفادة من الاتجاهات الناشئة، مما يؤدي إلى زيادة نمو السوق.
تشير كثافة اللاعبين في السوق إلى توزيع الشركات أو المؤسسات العاملة في سوق أو صناعة معينة. وهي تشير إلى عدد المنافسين (اللاعبين في السوق) الموجودين في مساحة سوق معينة نسبة إلى حجمها أو قيمتها السوقية الإجمالية.
الشركات الرئيسية العاملة في سوق الخدمات المساعدة لشركات الطيران هي:
- شركة يونايتد ايرلاينز القابضة
- مجموعة الخطوط الجوية الأمريكية
- شركة دلتا للطيران
- شركة ايزي جيت المحدودة
- شركة لوفتهانزا الألمانية
إخلاء المسؤولية : الشركات المذكورة أعلاه ليست مرتبة بأي ترتيب معين.

- احصل على نظرة عامة على أهم اللاعبين الرئيسيين في سوق خدمات المساعدة في شركات الطيران
التطورات الأخيرة:
تتبنى الشركات العاملة في سوق الخدمات المساندة لشركات الطيران بشكل كبير الاستراتيجيات غير العضوية والعضوية مثل عمليات الدمج والاستحواذ. وفيما يلي بعض التطورات الرئيسية الأخيرة في سوق الخدمات المساندة لشركات الطيران:
- في فبراير 2023، أعلنت شركة يونايتد إيرلاينز مؤخرًا عن قرارها بالسماح للعائلات التي لديها أطفال صغار باختيار المقاعد المجاورة دون أي تكلفة إضافية. وتؤكد هذه الخطوة الصديقة للعملاء على أهمية توفير تجربة سفر سلسة ومريحة للعائلات، مما يسلط الضوء على التزام يونايتد بتعزيز عروضها الإضافية.
- في يناير 2023، أعلنت شركة دلتا إيرلاينز عن توفير خدمة واي فاي مجانية للركاب في الولايات المتحدة، وذلك من خلال شراكة مع شركة تي موبايل. وبدءًا من الأول من فبراير، سيستمتع أعضاء برنامج المسافر الدائم سكاي مايلز بخدمة واي فاي مجانية. وتوضح هذه الخطوة، التي تم اتخاذها كخطوة مهمة نحو تعزيز عروض الخدمات الإضافية، التزام دلتا بتحسين تجربة الطيران وإضافة قيمة لعملائها المخلصين.
- في يوليو 2022، اتخذت شركة إيزي جيت خطوات لتحسين تجربة العملاء من خلال سلسلة من المبادرات لموسم السفر الصيفي. وتشمل هذه المبادرات خطًا ساخنًا مخصصًا للعملاء للعائلات، وساعات خدمة عملاء ممتدة، و"أيدي المساعدة" في المطارات الرئيسية، وإعادة تقديم خدمة تسليم الأمتعة عند الغسق. تهدف شركة الطيران إلى تقديم دعم إضافي وراحة للركاب، وإظهار التزامها بتعزيز الخدمات الإضافية.
- التحليل التاريخي (سنتان)، السنة الأساسية، التوقعات (7 سنوات) مع معدل النمو السنوي المركب
- تحليل PEST و SWOT
- حجم السوق والقيمة / الحجم - عالميًا وإقليميًا وقطريًا
- الصناعة والمنافسة
- مجموعة بيانات Excel


Report Coverage
Revenue forecast, Company Analysis, Industry landscape, Growth factors, and Trends

Segment Covered
This text is related
to segments covered.

Regional Scope
North America, Europe, Asia Pacific, Middle East & Africa, South & Central America

Country Scope
This text is related
to country scope.
الأسئلة الشائعة
The incremental growth expected to be recorded for the Global Airline Ancillary Services Market during the forecast period is US$ 559.73 billion.
The key players holding majority shares in the Global Airline Ancillary Services Market are United Airlines Holdings Inc, American Airlines Group Inc, Delta Air Lines Inc, EasyJet Plc, and Deutsche Lufthansa AG.
Increasing deployment of in-flight wi-fi are impacting the Global Airline Ancillary Services, which is anticipated to play a significant role in the Global Airline Ancillary Services Market in the coming years.
The rising preference for air travel by middle-income passengers, benefits of frequent flyer programs, and in-flight retail partnerships are the major factors that propel the Global Airline Ancillary Services Market.
The Global Airline Ancillary Services Market was estimated to be US$ 168.80 billion in 2022 and is expected to grow at a CAGR of 20.1% during the forecast period 2023 - 2030.
The Global Airline Ancillary Services Market is expected to reach US$ 728.53 billion by 2030.
The List of Companies - Airline Ancillary Services Market
- United Airlines Holdings Inc
- American Airlines Group Inc
- Delta Air Lines Inc
- EasyJet Plc
- Deutsche Lufthansa AG
- Qantas Airways Ltd
- Ryanair Holdings Plc
- Southwest Airlines Co
- The Emirates
- Air France KLM SA
The Insight Partners performs research in 4 major stages: Data Collection & Secondary Research, Primary Research, Data Analysis and Data Triangulation & Final Review.
- Data Collection and Secondary Research:
As a market research and consulting firm operating from a decade, we have published and advised several client across the globe. First step for any study will start with an assessment of currently available data and insights from existing reports. Further, historical and current market information is collected from Investor Presentations, Annual Reports, SEC Filings, etc., and other information related to company’s performance and market positioning are gathered from Paid Databases (Factiva, Hoovers, and Reuters) and various other publications available in public domain.
Several associations trade associates, technical forums, institutes, societies and organization are accessed to gain technical as well as market related insights through their publications such as research papers, blogs and press releases related to the studies are referred to get cues about the market. Further, white papers, journals, magazines, and other news articles published in last 3 years are scrutinized and analyzed to understand the current market trends.
- Primary Research:
The primarily interview analysis comprise of data obtained from industry participants interview and answers to survey questions gathered by in-house primary team.
For primary research, interviews are conducted with industry experts/CEOs/Marketing Managers/VPs/Subject Matter Experts from both demand and supply side to get a 360-degree view of the market. The primary team conducts several interviews based on the complexity of the markets to understand the various market trends and dynamics which makes research more credible and precise.
A typical research interview fulfils the following functions:
- Provides first-hand information on the market size, market trends, growth trends, competitive landscape, and outlook
- Validates and strengthens in-house secondary research findings
- Develops the analysis team’s expertise and market understanding
Primary research involves email interactions and telephone interviews for each market, category, segment, and sub-segment across geographies. The participants who typically take part in such a process include, but are not limited to:
- Industry participants: VPs, business development managers, market intelligence managers and national sales managers
- Outside experts: Valuation experts, research analysts and key opinion leaders specializing in the electronics and semiconductor industry.
Below is the breakup of our primary respondents by company, designation, and region:

Once we receive the confirmation from primary research sources or primary respondents, we finalize the base year market estimation and forecast the data as per the macroeconomic and microeconomic factors assessed during data collection.
- Data Analysis:
Once data is validated through both secondary as well as primary respondents, we finalize the market estimations by hypothesis formulation and factor analysis at regional and country level.
- Macro-Economic Factor Analysis:
We analyse macroeconomic indicators such the gross domestic product (GDP), increase in the demand for goods and services across industries, technological advancement, regional economic growth, governmental policies, the influence of COVID-19, PEST analysis, and other aspects. This analysis aids in setting benchmarks for various nations/regions and approximating market splits. Additionally, the general trend of the aforementioned components aid in determining the market's development possibilities.
- Country Level Data:
Various factors that are especially aligned to the country are taken into account to determine the market size for a certain area and country, including the presence of vendors, such as headquarters and offices, the country's GDP, demand patterns, and industry growth. To comprehend the market dynamics for the nation, a number of growth variables, inhibitors, application areas, and current market trends are researched. The aforementioned elements aid in determining the country's overall market's growth potential.
- Company Profile:
The “Table of Contents” is formulated by listing and analyzing more than 25 - 30 companies operating in the market ecosystem across geographies. However, we profile only 10 companies as a standard practice in our syndicate reports. These 10 companies comprise leading, emerging, and regional players. Nonetheless, our analysis is not restricted to the 10 listed companies, we also analyze other companies present in the market to develop a holistic view and understand the prevailing trends. The “Company Profiles” section in the report covers key facts, business description, products & services, financial information, SWOT analysis, and key developments. The financial information presented is extracted from the annual reports and official documents of the publicly listed companies. Upon collecting the information for the sections of respective companies, we verify them via various primary sources and then compile the data in respective company profiles. The company level information helps us in deriving the base number as well as in forecasting the market size.
- Developing Base Number:
Aggregation of sales statistics (2020-2022) and macro-economic factor, and other secondary and primary research insights are utilized to arrive at base number and related market shares for 2022. The data gaps are identified in this step and relevant market data is analyzed, collected from paid primary interviews or databases. On finalizing the base year market size, forecasts are developed on the basis of macro-economic, industry and market growth factors and company level analysis.
- Data Triangulation and Final Review:
The market findings and base year market size calculations are validated from supply as well as demand side. Demand side validations are based on macro-economic factor analysis and benchmarks for respective regions and countries. In case of supply side validations, revenues of major companies are estimated (in case not available) based on industry benchmark, approximate number of employees, product portfolio, and primary interviews revenues are gathered. Further revenue from target product/service segment is assessed to avoid overshooting of market statistics. In case of heavy deviations between supply and demand side values, all thes steps are repeated to achieve synchronization.
We follow an iterative model, wherein we share our research findings with Subject Matter Experts (SME’s) and Key Opinion Leaders (KOLs) until consensus view of the market is not formulated – this model negates any drastic deviation in the opinions of experts. Only validated and universally acceptable research findings are quoted in our reports.
We have important check points that we use to validate our research findings – which we call – data triangulation, where we validate the information, we generate from secondary sources with primary interviews and then we re-validate with our internal data bases and Subject matter experts. This comprehensive model enables us to deliver high quality, reliable data in shortest possible time.


 احصل على عينة مجانية لهذا التقرير