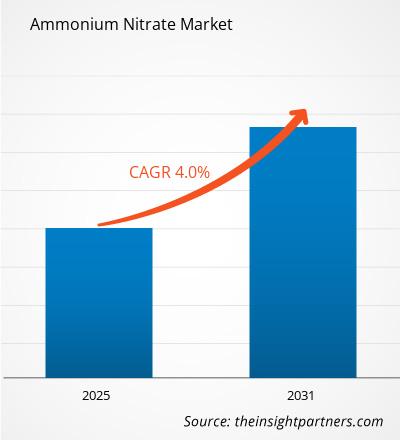
من المتوقع أن يسجل سوق نترات الأمونيوم معدل نمو سنوي مركب بنسبة 4٪ من عام 2024 إلى عام 2031، مع توسع حجم السوق من XX مليون دولار أمريكي في عام 2024 إلى XX مليون دولار أمريكي بحلول عام 2031.
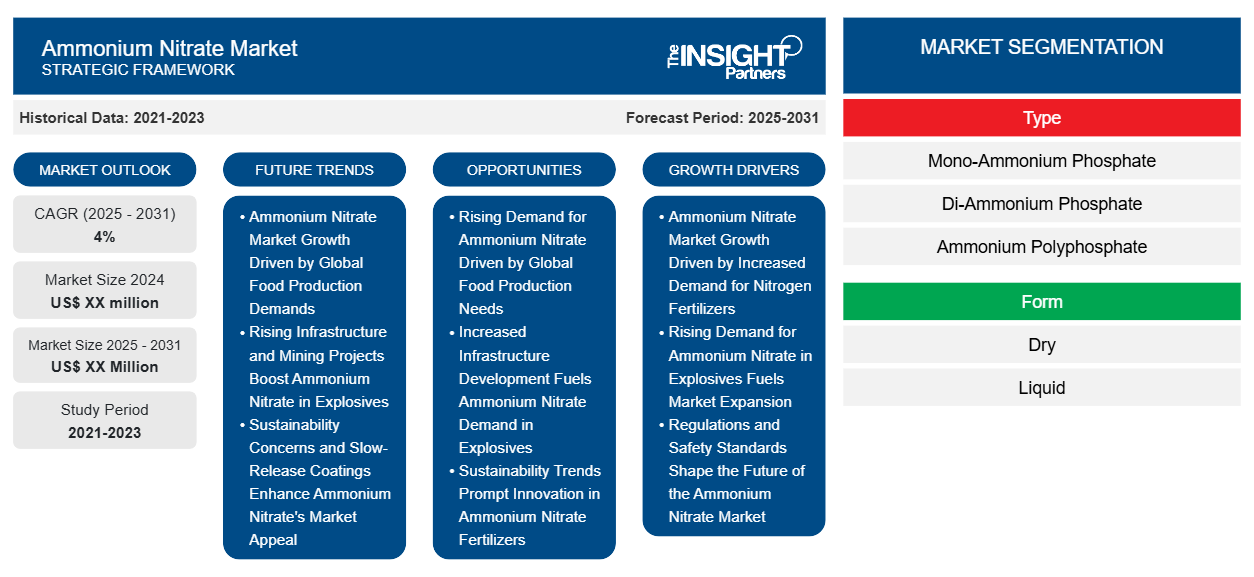
تم تقسيم التقرير حسب النوع (فوسفات أحادي الأمونيوم (MAP)، فوسفات ثنائي الأمونيوم ( DAP )، بولي فوسفات الأمونيوم ). يقدم التقرير أيضًا تحليلًا يعتمد على الشكل (جاف وسائل). يتم تقسيم التحليل العالمي بشكل أكبر على المستوى الإقليمي والدول الرئيسية. يتم تغطية حجم السوق والتوقعات على المستويات العالمية والإقليمية والقطرية لجميع قطاعات السوق الرئيسية ضمن النطاق. يقدم التقرير القيمة بالدولار الأمريكي للتحليل والقطاعات المذكورة أعلاه. يقدم التقرير إحصائيات رئيسية عن حالة السوق للاعبين الرئيسيين في السوق ويعرض اتجاهات السوق والفرص.
غرض التقرير
يهدف تقرير سوق نترات الأمونيوم الصادر عن The Insight Partners إلى وصف المشهد الحالي والنمو المستقبلي وأهم العوامل الدافعة والتحديات والفرص. سيوفر هذا رؤى لمختلف أصحاب المصلحة في الأعمال التجارية، مثل:
- مزودي/مصنعي التكنولوجيا: لفهم ديناميكيات السوق المتطورة ومعرفة فرص النمو المحتملة، وتمكينهم من اتخاذ قرارات استراتيجية مستنيرة.
- المستثمرون: إجراء تحليل شامل للاتجاهات فيما يتعلق بمعدل نمو السوق، وتوقعات السوق المالية، والفرص المتاحة عبر سلسلة القيمة.
- الهيئات التنظيمية: لتنظيم السياسات ومراقبة الأنشطة في السوق بهدف تقليل الانتهاكات والحفاظ على ثقة المستثمرين والحفاظ على سلامة السوق واستقرارها.
تجزئة سوق نترات الأمونيوم
يكتب
- فوسفات أحادي الأمونيوم
- فوسفات ثنائي الأمونيوم
- بولي فوسفات الأمونيومPolyphosphate
استمارة
- جاف
- سائل
قم بتخصيص هذا التقرير ليناسب متطلباتك
ستحصل على تخصيص لأي تقرير - مجانًا - بما في ذلك أجزاء من هذا التقرير، أو تحليل على مستوى الدولة، وحزمة بيانات Excel، بالإضافة إلى الاستفادة من العروض والخصومات الرائعة للشركات الناشئة والجامعات
- احصل على أهم اتجاهات السوق الرئيسية لهذا التقرير.ستتضمن هذه العينة المجانية تحليلاً للبيانات، بدءًا من اتجاهات السوق وحتى التقديرات والتوقعات.
عوامل نمو سوق نترات الأمونيوم
- نمو سوق نترات الأمونيوم مدفوعًا بالطلب المتزايد على الأسمدة النيتروجينية: إن سوق نترات الأمونيوم مدفوع في المقام الأول باستخدامها على نطاق واسع كسماد نيتروجين. ومع نمو عدد السكان العالمي والحاجة إلى زيادة إنتاج الغذاء، يعتمد المزارعون بشكل متزايد على نترات الأمونيوم لتعزيز غلة المحاصيل. إن فعاليتها كمصدر سريع للنيتروجين تجعلها الخيار المفضل، مما يؤدي إلى نمو قوي في السوق.
- الطلب المتزايد على نترات الأمونيوم في المتفجرات يغذي توسع السوق: نترات الأمونيوم هي عنصر أساسي في إنتاج المتفجرات للتعدين والبناء والهدم. مع توسع مشاريع البنية التحتية وأنشطة التعدين على مستوى العالم، يتزايد الطلب على نترات الأمونيوم في المتفجرات. هذا الدور المزدوج كسماد ومادة أولية للمتفجرات يدفع نموًا كبيرًا في سوق نترات الأمونيوم.
- تؤثر اللوائح ومعايير السلامة على مستقبل سوق نترات الأمونيوم: تؤثر اللوائح المتزايدة المتعلقة بمناولة وتخزين نترات الأمونيوم، وخاصة في صناعة المتفجرات، على ديناميكيات السوق. يستثمر المصنعون في أساليب إنتاج وتوزيع أكثر أمانًا للامتثال لهذه اللوائح. ومع تبني الشركات لممارسات أكثر أمانًا، قد تشهد السوق تغييرات في أنماط الطلب وابتكارات المنتجات.
الاتجاهات المستقبلية لسوق نترات الأمونيوم
- نمو سوق نترات الأمونيوم مدفوعًا بمتطلبات الإنتاج الغذائي العالمي: سيشهد سوق نترات الأمونيوم نموًا كبيرًا، مدفوعًا بشكل خاص بالرغبة المستمرة في زيادة إنتاج الغذاء في جميع أنحاء العالم. إن التحديات التي تأتي مع النمو السكاني والتي بلغت ذروتها بسبب التحضر تفرض حاجة كبيرة للأسمدة الفعالة القادرة على زيادة غلة المحاصيل بين المزارعين. وذلك لأن نترات الأمونيوم تحتوي على النيتروجين في شكل متاح بسهولة للاستخدام من قبل المحاصيل وبالتالي ستظل المنتج المفضل للعديد من المنتجين الزراعيين وبالتالي تغذية نمو هذا السوق.
- مشاريع البنية التحتية والتعدين المتزايدة تعزز استخدام نترات الأمونيوم في المتفجرات: مع ارتفاع عدد مشاريع البنية التحتية وتطوير المواد الخام في جميع أنحاء العالم، من المتوقع أن يزداد استخدام نترات الأمونيوم في تصنيع المتفجرات المستخدمة في البناء والتعدين. وبهذه الطريقة، كسماد وعامل تعبئة للمستخدم، فإن الملحق A14 المحسن للمنتج المتطاير للغاية سيجعله جذابًا بشكل استثنائي للمستثمرين في إنتاج وبيع نترات الأمونيوم.
- إن المخاوف المتعلقة بالاستدامة والطلاءات البطيئة الإطلاق تعزز جاذبية سوق نترات الأمونيوم: مع تزايد الأحكام البيئية، يتحول الاهتمام الآن إلى استخدام الأسمدة الفعالة والآمنة. على سبيل المثال، فإن إدخال طلاء نترات الأمونيوم البطيء الإطلاق إلى البيئة من شأنه أن يحمي البيئة ويحسن استخدام النيتروجين في الأسمدة. وهذا الاهتمام بالاستدامة هو الذي سيجذب المزيد من المستخدمين إلى نترات الأمونيوم وبالتالي تسهيل استيعاب هذا السوق.
فرص سوق نترات الأمونيوم
- الطلب المتزايد على نترات الأمونيوم مدفوعًا باحتياجات الإنتاج الغذائي العالمي: سوق نترات الأمونيوم نظرًا لوجود طلب متزايد على الإنتاج الغذائي مع زيادة عدد السكان. يبحث المزارعون عن أسمدة أفضل وأكثر كفاءة لزيادة غلة محاصيلهم، وبالتالي، فإن نترات الأمونيوم كمصدر للنيتروجين ستكون الأكثر طلبًا، مما يجعلها طلبًا ثابتًا للمصنعين.
- إن زيادة تطوير البنية التحتية من شأنها أن تزيد الطلب على نترات الأمونيوم في المتفجرات: من المتوقع أن يؤدي ارتفاع الأنشطة المتعلقة بالبنية التحتية في جميع أنحاء العالم وخاصة في دول العالم الثالث إلى خلق طلب مرتفع على نترات الأمونيوم في سوق المتفجرات. كما أن النمو في صناعة البناء والتعدين من شأنه أن يزيد الطلب على المتفجرات الفعالة وبالتالي تقديم سوق ضخمة لموردي نترات الأمونيوم.
- إن اتجاهات الاستدامة تحفز الابتكار في أسمدة نترات الأمونيوم: لقد خلق اتجاه الالتزام بالاستدامة البيئية في الزراعة فرصة لصياغة بدائل أفضل لنترات الأمونيوم. على سبيل المثال، تعد الأسمدة البطيئة الإطلاق أو المغلفة من الابتكارات التي يمكنها تحسين كفاءة استخدام المغذيات والحد من التلوث مما سيجذب المستهلكين من المزارعين والشركات الزراعية.
رؤى إقليمية حول سوق نترات الأمونيوم
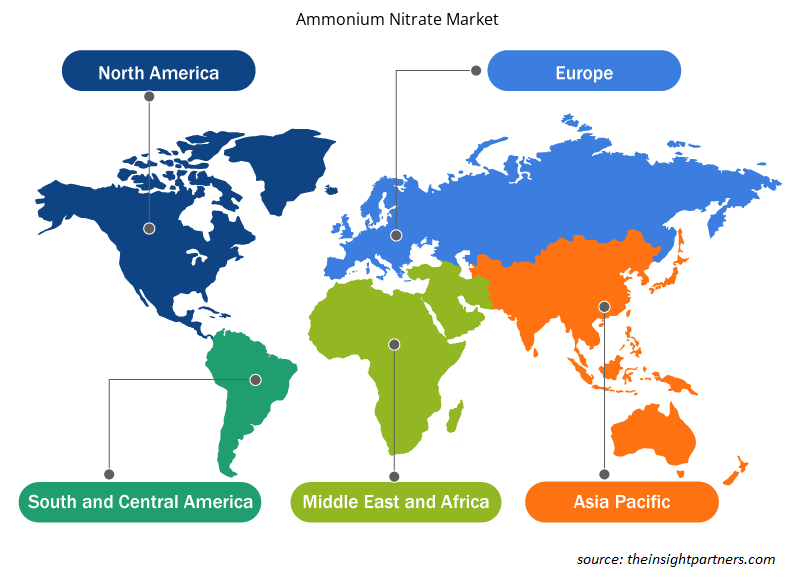
لقد قام المحللون في Insight Partners بشرح الاتجاهات والعوامل الإقليمية المؤثرة على سوق نترات الأمونيوم طوال فترة التوقعات بشكل شامل. يناقش هذا القسم أيضًا قطاعات سوق نترات الأمونيوم والجغرافيا في جميع أنحاء أمريكا الشمالية وأوروبا ومنطقة آسيا والمحيط الهادئ والشرق الأوسط وأفريقيا وأمريكا الجنوبية والوسطى.

- احصل على البيانات الإقليمية المحددة لسوق نترات الأمونيوم
نطاق تقرير سوق نترات الأمونيوم
| سمة التقرير | تفاصيل |
|---|---|
| حجم السوق في عام 2024 | XX مليون دولار أمريكي |
| حجم السوق بحلول عام 2031 | XX مليون دولار أمريكي |
| معدل النمو السنوي المركب العالمي (2024 - 2031) | 4% |
| البيانات التاريخية | 2021-2023 |
| فترة التنبؤ | 2025-2031 |
| القطاعات المغطاة | حسب النوع
|
| المناطق والدول المغطاة | أمريكا الشمالية
|
| قادة السوق وملفات تعريف الشركات الرئيسية |
|
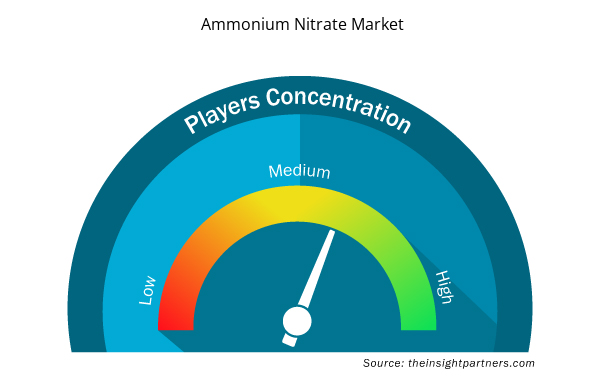
كثافة اللاعبين في سوق نترات الأمونيوم: فهم تأثيرها على ديناميكيات الأعمال
يشهد سوق نترات الأمونيوم نموًا سريعًا، مدفوعًا بالطلب المتزايد من المستخدم النهائي بسبب عوامل مثل تفضيلات المستهلكين المتطورة والتقدم التكنولوجي والوعي المتزايد بفوائد المنتج. ومع ارتفاع الطلب، تعمل الشركات على توسيع عروضها والابتكار لتلبية احتياجات المستهلكين والاستفادة من الاتجاهات الناشئة، مما يؤدي إلى زيادة نمو السوق.
تشير كثافة اللاعبين في السوق إلى توزيع الشركات أو المؤسسات العاملة في سوق أو صناعة معينة. وهي تشير إلى عدد المنافسين (اللاعبين في السوق) الموجودين في مساحة سوق معينة نسبة إلى حجمها أو قيمتها السوقية الإجمالية.
الشركات الرئيسية العاملة في سوق نترات الأمونيوم هي:
- شركة سي إس بي بي المحدودة
- العلامة التجارية النيتروجين
- شركة سي اف اندستريز القابضة
- شركة اوريكا المحدودة
- شركة يارا الدولية
- أورالخيم
إخلاء المسؤولية : الشركات المذكورة أعلاه ليست مرتبة بأي ترتيب معين.

- احصل على نظرة عامة على أهم اللاعبين الرئيسيين في سوق نترات الأمونيوم
نقاط البيع الرئيسية
- التغطية الشاملة: يغطي التقرير بشكل شامل تحليل المنتجات والخدمات والأنواع والمستخدمين النهائيين لسوق نترات الأمونيوم، مما يوفر صورة شاملة.
- تحليل الخبراء: تم تجميع التقرير على أساس الفهم العميق لخبراء الصناعة والمحللين.
- معلومات محدثة: يضمن التقرير أهمية الأعمال التجارية بسبب تغطيته للمعلومات الحديثة واتجاهات البيانات.
- خيارات التخصيص: يمكن تخصيص هذا التقرير لتلبية متطلبات العملاء المحددة وبما يتناسب مع استراتيجيات العمل بشكل مناسب.
وبالتالي، يمكن أن يساعد تقرير البحث حول سوق نترات الأمونيوم في تمهيد الطريق لفك شفرة وفهم سيناريو الصناعة وآفاق النمو. ورغم وجود بعض المخاوف المشروعة، فإن الفوائد الإجمالية لهذا التقرير تميل إلى التفوق على العيوب.
- التحليل التاريخي (سنتان)، السنة الأساسية، التوقعات (7 سنوات) مع معدل النمو السنوي المركب
- تحليل PEST و SWOT
- حجم السوق والقيمة / الحجم - عالميًا وإقليميًا وقطريًا
- الصناعة والمنافسة
- مجموعة بيانات Excel


Report Coverage
Revenue forecast, Company Analysis, Industry landscape, Growth factors, and Trends

Segment Covered
This text is related
to segments covered.

Regional Scope
North America, Europe, Asia Pacific, Middle East & Africa, South & Central America

Country Scope
This text is related
to country scope.
الأسئلة الشائعة
Increasing agricultural productivity needs is expected to be the key market trends
Based on type, the mono-ammonium phosphate (MAP) segment is expected to witness the fastest growth during the forecast period
Based on geography, Asia Pacific held the largest share of the ammonium nitrate market due to the well-established agriculture industry across the region, coupled with continuous growth and development
Surge in fertilizer demand is driving the market growth
Yara International ASA; CF Industries Holdings, Inc.; Nutrien Ltd.; Orica Limited; Uralchem JSC; Terra Nitrogen Company, L.P.; BASF SE; K+S Aktiengesellschaft; Koch Industries, Inc.; Tessenderlo Group; Fertiberia S.A.; Shanxi Jincheng Anthracite Mining Group; Brevard Chemical Co.; Agrium Inc.; Indian Farmers Fertiliser Cooperative Limited (IFFCO)
The Ammonium Nitrate Market is estimated to witness a CAGR of 4% from 2023 to 2031
Trends and growth analysis reports related to Chemicals and Materials : READ MORE..
- CSBP Limited
- TradeMark Nitrogen
- CF Industries Holdings Inc
- Orica Limited
- Yara International ASA
- Uralchem
- Acron Group
- Enaex SA
- Maxam Corp Holding SL
- Sasol Limited
The Insight Partners performs research in 4 major stages: Data Collection & Secondary Research, Primary Research, Data Analysis and Data Triangulation & Final Review.
- Data Collection and Secondary Research:
As a market research and consulting firm operating from a decade, we have published and advised several client across the globe. First step for any study will start with an assessment of currently available data and insights from existing reports. Further, historical and current market information is collected from Investor Presentations, Annual Reports, SEC Filings, etc., and other information related to company’s performance and market positioning are gathered from Paid Databases (Factiva, Hoovers, and Reuters) and various other publications available in public domain.
Several associations trade associates, technical forums, institutes, societies and organization are accessed to gain technical as well as market related insights through their publications such as research papers, blogs and press releases related to the studies are referred to get cues about the market. Further, white papers, journals, magazines, and other news articles published in last 3 years are scrutinized and analyzed to understand the current market trends.
- Primary Research:
The primarily interview analysis comprise of data obtained from industry participants interview and answers to survey questions gathered by in-house primary team.
For primary research, interviews are conducted with industry experts/CEOs/Marketing Managers/VPs/Subject Matter Experts from both demand and supply side to get a 360-degree view of the market. The primary team conducts several interviews based on the complexity of the markets to understand the various market trends and dynamics which makes research more credible and precise.
A typical research interview fulfils the following functions:
- Provides first-hand information on the market size, market trends, growth trends, competitive landscape, and outlook
- Validates and strengthens in-house secondary research findings
- Develops the analysis team’s expertise and market understanding
Primary research involves email interactions and telephone interviews for each market, category, segment, and sub-segment across geographies. The participants who typically take part in such a process include, but are not limited to:
- Industry participants: VPs, business development managers, market intelligence managers and national sales managers
- Outside experts: Valuation experts, research analysts and key opinion leaders specializing in the electronics and semiconductor industry.
Below is the breakup of our primary respondents by company, designation, and region:

Once we receive the confirmation from primary research sources or primary respondents, we finalize the base year market estimation and forecast the data as per the macroeconomic and microeconomic factors assessed during data collection.
- Data Analysis:
Once data is validated through both secondary as well as primary respondents, we finalize the market estimations by hypothesis formulation and factor analysis at regional and country level.
- Macro-Economic Factor Analysis:
We analyse macroeconomic indicators such the gross domestic product (GDP), increase in the demand for goods and services across industries, technological advancement, regional economic growth, governmental policies, the influence of COVID-19, PEST analysis, and other aspects. This analysis aids in setting benchmarks for various nations/regions and approximating market splits. Additionally, the general trend of the aforementioned components aid in determining the market's development possibilities.
- Country Level Data:
Various factors that are especially aligned to the country are taken into account to determine the market size for a certain area and country, including the presence of vendors, such as headquarters and offices, the country's GDP, demand patterns, and industry growth. To comprehend the market dynamics for the nation, a number of growth variables, inhibitors, application areas, and current market trends are researched. The aforementioned elements aid in determining the country's overall market's growth potential.
- Company Profile:
The “Table of Contents” is formulated by listing and analyzing more than 25 - 30 companies operating in the market ecosystem across geographies. However, we profile only 10 companies as a standard practice in our syndicate reports. These 10 companies comprise leading, emerging, and regional players. Nonetheless, our analysis is not restricted to the 10 listed companies, we also analyze other companies present in the market to develop a holistic view and understand the prevailing trends. The “Company Profiles” section in the report covers key facts, business description, products & services, financial information, SWOT analysis, and key developments. The financial information presented is extracted from the annual reports and official documents of the publicly listed companies. Upon collecting the information for the sections of respective companies, we verify them via various primary sources and then compile the data in respective company profiles. The company level information helps us in deriving the base number as well as in forecasting the market size.
- Developing Base Number:
Aggregation of sales statistics (2020-2022) and macro-economic factor, and other secondary and primary research insights are utilized to arrive at base number and related market shares for 2022. The data gaps are identified in this step and relevant market data is analyzed, collected from paid primary interviews or databases. On finalizing the base year market size, forecasts are developed on the basis of macro-economic, industry and market growth factors and company level analysis.
- Data Triangulation and Final Review:
The market findings and base year market size calculations are validated from supply as well as demand side. Demand side validations are based on macro-economic factor analysis and benchmarks for respective regions and countries. In case of supply side validations, revenues of major companies are estimated (in case not available) based on industry benchmark, approximate number of employees, product portfolio, and primary interviews revenues are gathered. Further revenue from target product/service segment is assessed to avoid overshooting of market statistics. In case of heavy deviations between supply and demand side values, all thes steps are repeated to achieve synchronization.
We follow an iterative model, wherein we share our research findings with Subject Matter Experts (SME’s) and Key Opinion Leaders (KOLs) until consensus view of the market is not formulated – this model negates any drastic deviation in the opinions of experts. Only validated and universally acceptable research findings are quoted in our reports.
We have important check points that we use to validate our research findings – which we call – data triangulation, where we validate the information, we generate from secondary sources with primary interviews and then we re-validate with our internal data bases and Subject matter experts. This comprehensive model enables us to deliver high quality, reliable data in shortest possible time.


 احصل على عينة مجانية لهذا التقرير