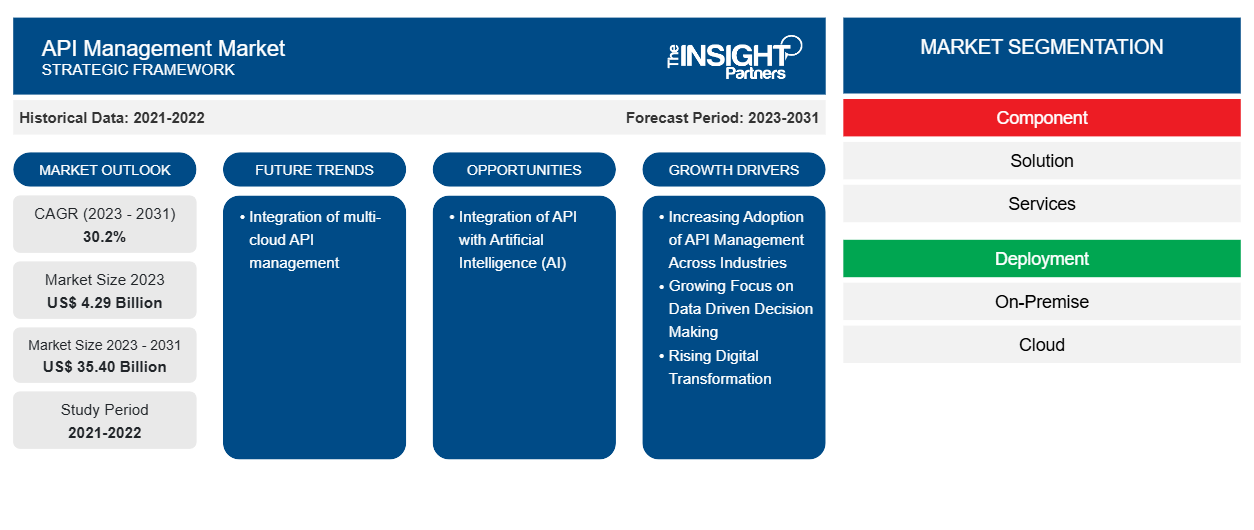
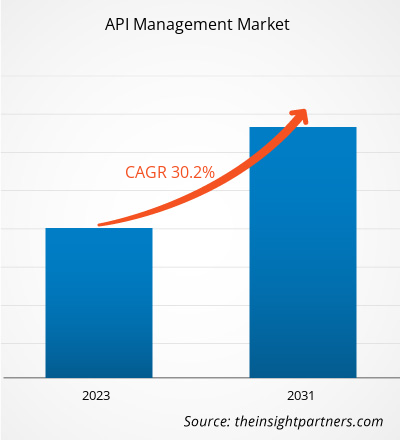
من المتوقع أن يصل حجم سوق إدارة واجهة برمجة التطبيقات إلى 35.40 مليار دولار أمريكي بحلول عام 2031 من 4.29 مليار دولار أمريكي في عام 2023. ومن المتوقع أن يسجل السوق معدل نمو سنوي مركب بنسبة 30.2٪ خلال الفترة 2023-2031. سيظل دمج إدارة واجهة برمجة التطبيقات متعددة السحابة اتجاهًا رئيسيًا في السوق.
تحليل سوق إدارة واجهة برمجة التطبيقات
يشهد سوق إدارة واجهة برمجة التطبيقات العالمية نموًا كبيرًا من حيث الإيرادات المتعلقة بالتركيز المتزايد على اتخاذ القرارات القائمة على البيانات. يخلق التحول الرقمي المستمر عبر الصناعات حاجة للشركات لدمج تطبيقاتها وأنظمتها وخدماتها بسلاسة.
نظرة عامة على سوق إدارة واجهة برمجة التطبيقات (API)
واجهات برمجة التطبيقات (API) هي مجموعة من البرامج والعمليات التي تسهل الاتصال بين برنامجين. تنشئ واجهات برمجة التطبيقات اتصالات بين التطبيقات والخوادم، وكذلك بين الخوادم والمستخدمين. تنقل واجهات برمجة التطبيقات معلومات الشركة الحيوية وتوفر موارد تكميلية للمجتمع العالمي من خلال التطبيقات عبر الإنترنت والجوال. تتضمن منصة إدارة واجهة برمجة التطبيقات كاملة الميزات بوابات المطورين والتصميم والتطوير والاختبار وبوابات واجهة برمجة التطبيقات والتحليلات والمراقبة وإدارة السياسات والأمان والحوكمة. توفر منصة إدارة واجهة برمجة التطبيقات للمستخدمين فوائد مختلفة مثل الأمان والخصوصية متعدد الطبقات والكشف السهل عن شذوذ واجهة برمجة التطبيقات وزيادة الأداء والموثوقية وسهولة الاتصال بالتقنيات القديمة وإنشاء قنوات عمل جديدة. أصبح تصميم وتطوير واختبار ونشر وإدارة وأمان ومراقبة وتحقيق الدخل من واجهات برمجة التطبيقات جزءًا مهمًا من دورة حياة تطوير البرمجيات (SDLC) والنظام البيئي للتكنولوجيا.
قم بتخصيص هذا التقرير ليناسب متطلباتك
ستحصل على تخصيص لأي تقرير - مجانًا - بما في ذلك أجزاء من هذا التقرير، أو تحليل على مستوى الدولة، وحزمة بيانات Excel، بالإضافة إلى الاستفادة من العروض والخصومات الرائعة للشركات الناشئة والجامعات
- احصل على أهم اتجاهات السوق الرئيسية لهذا التقرير.ستتضمن هذه العينة المجانية تحليلاً للبيانات، بدءًا من اتجاهات السوق وحتى التقديرات والتوقعات.
محركات وفرص سوق إدارة واجهة برمجة التطبيقات (API)
زيادة اعتماد إدارة واجهة برمجة التطبيقات (API) عبر الصناعات لصالح السوق
تُعَد إدارة واجهات برمجة التطبيقات (API) عنصرًا أساسيًا في التحول الرقمي للشركات. فهي تسمح للشركات بتحديد لوائح الأمان والوصول، وتتبع جدوى تقديم خدمات جديدة، وإدارة دورة حياة واجهات برمجة التطبيقات الخاصة بها. ومن خلال تنفيذ إدارة واجهات برمجة التطبيقات، يمكن للشركات ضمان اتصال أفضل، حيث يمكن للمستخدمين التفاعل مع بعضهم البعض وتقديم ملاحظات حول الخدمات. وبفضل هذه القدرة على التكيف، تُستخدم واجهات برمجة التطبيقات من قبل جميع أنواع الشركات، حيث تشهد القطاعات التقليدية مثل تجارة التجزئة والسفر والشركات التكنولوجية أعلى نمو في الاستخدام. يستخدم قطاعا التجزئة والسفر إدارة واجهة برمجة التطبيقات لتطبيق قواعد التشغيل البيني، بينما تستخدمها المؤسسات المالية لإطلاق برامج الخدمات المصرفية المفتوحة. ووفقًا لتقرير حالة واجهات برمجة التطبيقات لعام 2020 من Google Cloud، فإن تقسيم استخدام واجهة برمجة التطبيقات حسب الصناعة يشمل تجارة التجزئة والسفر (34٪)، وشركات التكنولوجيا (34٪)، والاتصالات (10٪)، والإعلام والترفيه (9٪)، والتصنيع (7٪)، والمالية (5٪)، وغيرها (1٪). وبالتالي، تُظهر مثل هذه الحالات الأهمية القصوى لإدارة واجهة برمجة التطبيقات في مختلف القطاعات.
دمج واجهة برمجة التطبيقات (API) مع الذكاء الاصطناعي (AI)
يمكن للذكاء الاصطناعي أن يغير صناعة واجهات برمجة التطبيقات. يمكن أن تصبح أنظمة واجهات برمجة التطبيقات سلسة وذكية مع دمج الذكاء الاصطناعي، مما يوفر للعملاء معلومات أكثر تخصصًا وأهمية. يمكن للذكاء الاصطناعي تقليل العمل البشري المطلوب لإدارة واجهات برمجة التطبيقات مع توفير درجات أعلى من الدقة من خلال رفع مستوى الأمان والكفاءة إلى مستويات لم يكن من الممكن تحقيقها سابقًا. وبالمثل، تعمل حلول أمان الذكاء الاصطناعي على تحسين قدرة أمان واجهات برمجة التطبيقات على اكتشاف وتخفيف الهجمات الإلكترونية واسعة النطاق. بفضل قدرته على إجراء فحوصات ديناميكية على البيانات المتغيرة بسرعة، يمكن للذكاء الاصطناعي اكتشاف الوصول غير القانوني إلى المعلومات ومنع المتسلل من الوصول إلى جزء كبير منها. تمنع هذه الحلول مكالمات واجهات برمجة التطبيقات التي تعرض المعلومات للخطر، وبالتالي حماية النظام.
تقرير تحليل تجزئة سوق إدارة واجهة برمجة التطبيقات
إن القطاعات الرئيسية التي ساهمت في استخلاص تحليل سوق إدارة واجهة برمجة التطبيقات هي المكون، والنشر، وحجم المنظمة، والمستخدم النهائي.
- بناءً على المكون، ينقسم سوق إدارة واجهة برمجة التطبيقات إلى حلول وخدمات. احتل قطاع الحلول حصة سوقية كبيرة في عام 2023.
- بناءً على النشر، يتم تقسيم السوق إلى محلي وسحابي. احتل قطاع السحابة حصة سوقية أكبر في عام 2023.
- بناءً على حجم المنظمة، ينقسم سوق إدارة واجهة برمجة التطبيقات إلى الشركات الكبيرة والشركات الصغيرة والمتوسطة. احتلت شريحة الشركات الكبيرة حصة سوقية أكبر في عام 2023.
- بناءً على المستخدمين النهائيين، يتم تقسيم السوق إلى تكنولوجيا المعلومات والاتصالات، والخدمات المصرفية والمالية والتأمين، والرعاية الصحية، والحكومة، والتصنيع، وغيرها. احتل قطاع تكنولوجيا المعلومات والاتصالات أكبر حصة في السوق في عام 2023.
تحليل حصة سوق إدارة واجهة برمجة التطبيقات حسب المنطقة الجغرافية
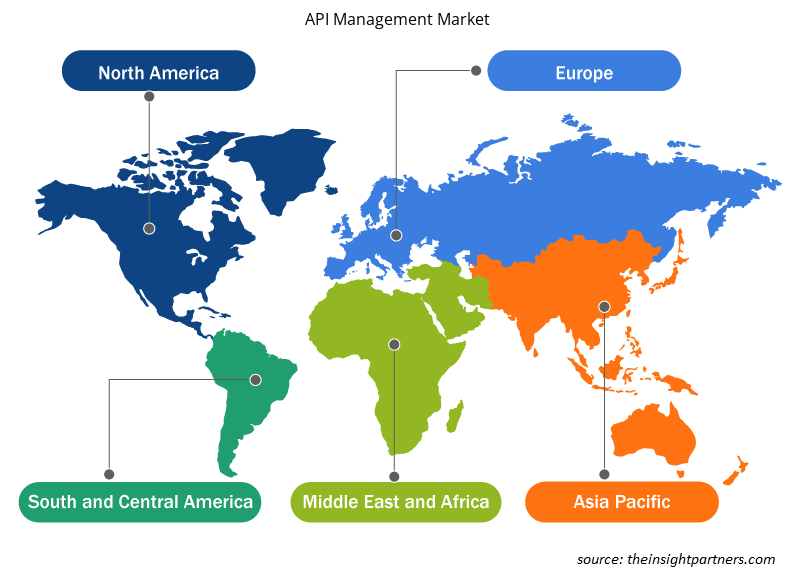
ينقسم النطاق الجغرافي لتقرير سوق إدارة واجهة برمجة التطبيقات بشكل أساسي إلى خمس مناطق: أمريكا الشمالية، ومنطقة آسيا والمحيط الهادئ، وأوروبا، والشرق الأوسط وأفريقيا، وأمريكا الجنوبية والوسطى.
سيطرت أمريكا الشمالية على سوق إدارة واجهة برمجة التطبيقات في عام 2023. تعد أمريكا الشمالية واحدة من أسرع المناطق نموًا من حيث الابتكارات التكنولوجية وتبني التقنيات المتقدمة. تتمتع المنطقة أيضًا ببنية تحتية راسخة لتكنولوجيا المعلومات والسحابة. في السنوات الثلاث الماضية، شهدت منطقة أمريكا الشمالية اعتمادًا كبيرًا على التقنيات الناشئة مثل الذكاء الاصطناعي والتعلم الآلي والبلوك تشين في جميع القطاعات الصناعية الرئيسية. مع زيادة انتشار الرقمنة في مختلف الصناعات، أصبحت إدارة واجهة برمجة التطبيقات مكونًا حيويًا لأنظمة المعاملات التجارية، وخاصة في المؤسسات المالية وصناعة تكنولوجيا المعلومات. يتزايد الطلب على حلول إدارة واجهة برمجة التطبيقات في الشركات بسرعة. يرجع نمو سوق إدارة واجهة برمجة التطبيقات في أمريكا الشمالية في المقام الأول إلى الطلب المتزايد من القطاعات الصناعية مثل BFSI والحكومة والرعاية الصحية. تعد إدارة واجهة برمجة التطبيقات متطلبًا تجاريًا حاسمًا للعمليات الناجحة.
رؤى إقليمية حول سوق إدارة واجهة برمجة التطبيقات (API)
لقد قام المحللون في Insight Partners بشرح الاتجاهات والعوامل الإقليمية المؤثرة على سوق إدارة واجهة برمجة التطبيقات طوال فترة التوقعات بشكل شامل. يناقش هذا القسم أيضًا قطاعات سوق إدارة واجهة برمجة التطبيقات والجغرافيا في جميع أنحاء أمريكا الشمالية وأوروبا ومنطقة آسيا والمحيط الهادئ والشرق الأوسط وأفريقيا وأمريكا الجنوبية والوسطى.

- احصل على البيانات الإقليمية المحددة لسوق إدارة واجهة برمجة التطبيقات (API)
نطاق تقرير سوق إدارة واجهة برمجة التطبيقات
| سمة التقرير | تفاصيل |
|---|---|
| حجم السوق في عام 2023 | 4.29 مليار دولار أمريكي |
| حجم السوق بحلول عام 2031 | 35.40 مليار دولار أمريكي |
| معدل النمو السنوي المركب العالمي (2023 - 2031) | 30.2% |
| البيانات التاريخية | 2021-2022 |
| فترة التنبؤ | 2023-2031 |
| القطاعات المغطاة | حسب المكون
|
| المناطق والدول المغطاة | أمريكا الشمالية
|
| قادة السوق وملفات تعريف الشركات الرئيسية |
|
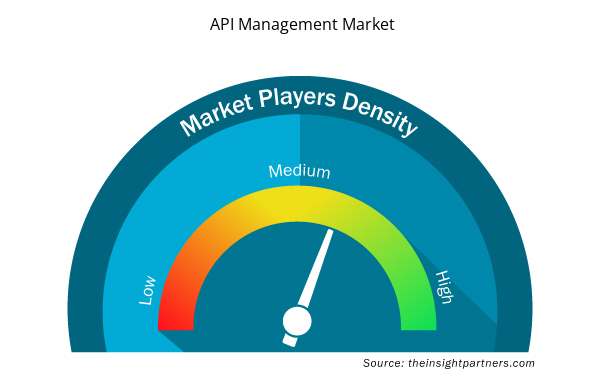
كثافة اللاعبين في السوق: فهم تأثيرها على ديناميكيات الأعمال
يشهد سوق إدارة واجهة برمجة التطبيقات نموًا سريعًا، مدفوعًا بالطلب المتزايد من المستخدم النهائي بسبب عوامل مثل تفضيلات المستهلك المتطورة والتقدم التكنولوجي والوعي المتزايد بفوائد المنتج. ومع ارتفاع الطلب، تعمل الشركات على توسيع عروضها والابتكار لتلبية احتياجات المستهلكين والاستفادة من الاتجاهات الناشئة، مما يؤدي إلى زيادة نمو السوق.
تشير كثافة اللاعبين في السوق إلى توزيع الشركات أو المؤسسات العاملة في سوق أو صناعة معينة. وهي تشير إلى عدد المنافسين (اللاعبين في السوق) الموجودين في مساحة سوق معينة نسبة إلى حجمها أو قيمتها السوقية الإجمالية.
الشركات الرئيسية العاملة في سوق إدارة API هي:
- شركة برودكوم
- شركة مايكروسوفت
- شركة أوراكل
- شركة البرمجيات ايه جي
- شركة آي بي إم
- بوستمان، المحدودة
إخلاء المسؤولية : الشركات المذكورة أعلاه ليست مرتبة بأي ترتيب معين.

- احصل على نظرة عامة على أهم اللاعبين الرئيسيين في سوق إدارة واجهة برمجة التطبيقات (API)
أخبار سوق إدارة واجهة برمجة التطبيقات والتطورات الأخيرة
يتم تقييم سوق إدارة واجهة برمجة التطبيقات من خلال جمع البيانات النوعية والكمية بعد البحث الأولي والثانوي، والذي يتضمن منشورات الشركات المهمة وبيانات الجمعيات وقواعد البيانات. فيما يلي بعض التطورات في سوق إدارة واجهة برمجة التطبيقات:
- أعلنت شركة Postman، الشركة الرائدة عالميًا في مجال التعاون عبر واجهات برمجة التطبيقات، عن استحواذها على Orbit، منصة نمو المجتمع لشركات التطوير. وعلى مدار السنوات الأربع الماضية، ساعدت Orbit شركات التطوير الرائدة في تنمية مجتمعاتها. وستقوم الآن بدمج تقنيتها ونشر خبرتها لدعم رؤية Postman لتمكين 100 مليون مطور من خلال التعاون عبر واجهات برمجة التطبيقات. (المصدر: Postman، بيان صحفي، أبريل 2024)
- أعلنت شركة WSO2 عن شراكة مع شركة TD SYNNEX. وتجلب هذه الشراكة برامج WSO2 الرائدة في الصناعة لدمج وإدارة واجهات برمجة التطبيقات وإدارة هوية العملاء والوصول إليها (CIAM) إلى النظام البيئي الموسع لتكنولوجيا المعلومات الخاص بشركة TD SYNNEX في جميع أنحاء العالم. ومن خلال شراكتهما، ستساعد WSO2 وTD SYNNEX العملاء المشتركين بشكل كبير على خفض الحواجز أمام تقديم خدمات رقمية جديدة وعروض برمجيات كخدمة (SaaS) تخلق تجارب سلسة. (المصدر: WSO2، بيان صحفي، أبريل 2023)
تقرير سوق إدارة واجهة برمجة التطبيقات (API) والتغطية والنتائج النهائية
يوفر تقرير "حجم سوق إدارة واجهة برمجة التطبيقات والتوقعات (2021-2031)" تحليلاً مفصلاً للسوق يغطي المجالات التالية:
- حجم سوق إدارة واجهة برمجة التطبيقات والتوقعات على المستويات العالمية والإقليمية والوطنية لجميع قطاعات السوق الرئيسية التي يغطيها النطاق
- اتجاهات سوق إدارة واجهة برمجة التطبيقات (API) بالإضافة إلى ديناميكيات السوق مثل المحركات والقيود والفرص الرئيسية
- تحليل مفصل لقوى PEST/Porter الخمس وSWOT
- تحليل سوق إدارة واجهة برمجة التطبيقات (API) الذي يغطي اتجاهات السوق الرئيسية والإطار العالمي والإقليمي والجهات الفاعلة الرئيسية واللوائح والتطورات الأخيرة في السوق
- تحليل المشهد الصناعي والمنافسة الذي يغطي تركيز السوق، وتحليل خريطة الحرارة، واللاعبين البارزين، والتطورات الأخيرة لسوق إدارة واجهة برمجة التطبيقات
- ملفات تعريف الشركة التفصيلية
- التحليل التاريخي (سنتان)، السنة الأساسية، التوقعات (7 سنوات) مع معدل النمو السنوي المركب
- تحليل PEST و SWOT
- حجم السوق والقيمة / الحجم - عالميًا وإقليميًا وقطريًا
- الصناعة والمنافسة
- مجموعة بيانات Excel


Report Coverage
Revenue forecast, Company Analysis, Industry landscape, Growth factors, and Trends

Segment Covered
This text is related
to segments covered.

Regional Scope
North America, Europe, Asia Pacific, Middle East & Africa, South & Central America

Country Scope
This text is related
to country scope.
الأسئلة الشائعة
The key players holding majority shares in the API management market include Microsoft Corporation, IBM Corporation, Oracle Corporation, Broadcom, and Postman, Inc,
Multi-cloud API management are expected to set the future trend for the API management market in the coming years.
Increasing adoption of API management across industries, growing focus on data-driven decision making, and rising digital transformation are driving factors of API management market.
The API management market is expected to reach US$ 35,401.94 million by 2031.
Solution segment led the API management market with a significant share in 2023 and is expected to grow with the highest CAGR.
The API management market was estimated to be valued at US$ 4,298.86 million in 2023 and is projected to reach US$ 35,401.94 million by 2031; it is expected to grow at a CAGR of 30.2% during the forecast period.
Trends and growth analysis reports related to Technology, Media and Telecommunications : READ MORE..
The List of Companies - API Management Market
- International Business Machines Corp
- Microsoft Corp
- Oracle Corp
- Google LLC
- Broadcom Inc
- Software AG
- Akamai Technologies Inc
- SAP SE
- Amazon Web Services Inc
- Postman, Inc
The Insight Partners performs research in 4 major stages: Data Collection & Secondary Research, Primary Research, Data Analysis and Data Triangulation & Final Review.
- Data Collection and Secondary Research:
As a market research and consulting firm operating from a decade, we have published and advised several client across the globe. First step for any study will start with an assessment of currently available data and insights from existing reports. Further, historical and current market information is collected from Investor Presentations, Annual Reports, SEC Filings, etc., and other information related to company’s performance and market positioning are gathered from Paid Databases (Factiva, Hoovers, and Reuters) and various other publications available in public domain.
Several associations trade associates, technical forums, institutes, societies and organization are accessed to gain technical as well as market related insights through their publications such as research papers, blogs and press releases related to the studies are referred to get cues about the market. Further, white papers, journals, magazines, and other news articles published in last 3 years are scrutinized and analyzed to understand the current market trends.
- Primary Research:
The primarily interview analysis comprise of data obtained from industry participants interview and answers to survey questions gathered by in-house primary team.
For primary research, interviews are conducted with industry experts/CEOs/Marketing Managers/VPs/Subject Matter Experts from both demand and supply side to get a 360-degree view of the market. The primary team conducts several interviews based on the complexity of the markets to understand the various market trends and dynamics which makes research more credible and precise.
A typical research interview fulfils the following functions:
- Provides first-hand information on the market size, market trends, growth trends, competitive landscape, and outlook
- Validates and strengthens in-house secondary research findings
- Develops the analysis team’s expertise and market understanding
Primary research involves email interactions and telephone interviews for each market, category, segment, and sub-segment across geographies. The participants who typically take part in such a process include, but are not limited to:
- Industry participants: VPs, business development managers, market intelligence managers and national sales managers
- Outside experts: Valuation experts, research analysts and key opinion leaders specializing in the electronics and semiconductor industry.
Below is the breakup of our primary respondents by company, designation, and region:

Once we receive the confirmation from primary research sources or primary respondents, we finalize the base year market estimation and forecast the data as per the macroeconomic and microeconomic factors assessed during data collection.
- Data Analysis:
Once data is validated through both secondary as well as primary respondents, we finalize the market estimations by hypothesis formulation and factor analysis at regional and country level.
- Macro-Economic Factor Analysis:
We analyse macroeconomic indicators such the gross domestic product (GDP), increase in the demand for goods and services across industries, technological advancement, regional economic growth, governmental policies, the influence of COVID-19, PEST analysis, and other aspects. This analysis aids in setting benchmarks for various nations/regions and approximating market splits. Additionally, the general trend of the aforementioned components aid in determining the market's development possibilities.
- Country Level Data:
Various factors that are especially aligned to the country are taken into account to determine the market size for a certain area and country, including the presence of vendors, such as headquarters and offices, the country's GDP, demand patterns, and industry growth. To comprehend the market dynamics for the nation, a number of growth variables, inhibitors, application areas, and current market trends are researched. The aforementioned elements aid in determining the country's overall market's growth potential.
- Company Profile:
The “Table of Contents” is formulated by listing and analyzing more than 25 - 30 companies operating in the market ecosystem across geographies. However, we profile only 10 companies as a standard practice in our syndicate reports. These 10 companies comprise leading, emerging, and regional players. Nonetheless, our analysis is not restricted to the 10 listed companies, we also analyze other companies present in the market to develop a holistic view and understand the prevailing trends. The “Company Profiles” section in the report covers key facts, business description, products & services, financial information, SWOT analysis, and key developments. The financial information presented is extracted from the annual reports and official documents of the publicly listed companies. Upon collecting the information for the sections of respective companies, we verify them via various primary sources and then compile the data in respective company profiles. The company level information helps us in deriving the base number as well as in forecasting the market size.
- Developing Base Number:
Aggregation of sales statistics (2020-2022) and macro-economic factor, and other secondary and primary research insights are utilized to arrive at base number and related market shares for 2022. The data gaps are identified in this step and relevant market data is analyzed, collected from paid primary interviews or databases. On finalizing the base year market size, forecasts are developed on the basis of macro-economic, industry and market growth factors and company level analysis.
- Data Triangulation and Final Review:
The market findings and base year market size calculations are validated from supply as well as demand side. Demand side validations are based on macro-economic factor analysis and benchmarks for respective regions and countries. In case of supply side validations, revenues of major companies are estimated (in case not available) based on industry benchmark, approximate number of employees, product portfolio, and primary interviews revenues are gathered. Further revenue from target product/service segment is assessed to avoid overshooting of market statistics. In case of heavy deviations between supply and demand side values, all thes steps are repeated to achieve synchronization.
We follow an iterative model, wherein we share our research findings with Subject Matter Experts (SME’s) and Key Opinion Leaders (KOLs) until consensus view of the market is not formulated – this model negates any drastic deviation in the opinions of experts. Only validated and universally acceptable research findings are quoted in our reports.
We have important check points that we use to validate our research findings – which we call – data triangulation, where we validate the information, we generate from secondary sources with primary interviews and then we re-validate with our internal data bases and Subject matter experts. This comprehensive model enables us to deliver high quality, reliable data in shortest possible time.


 احصل على عينة مجانية لهذا التقرير