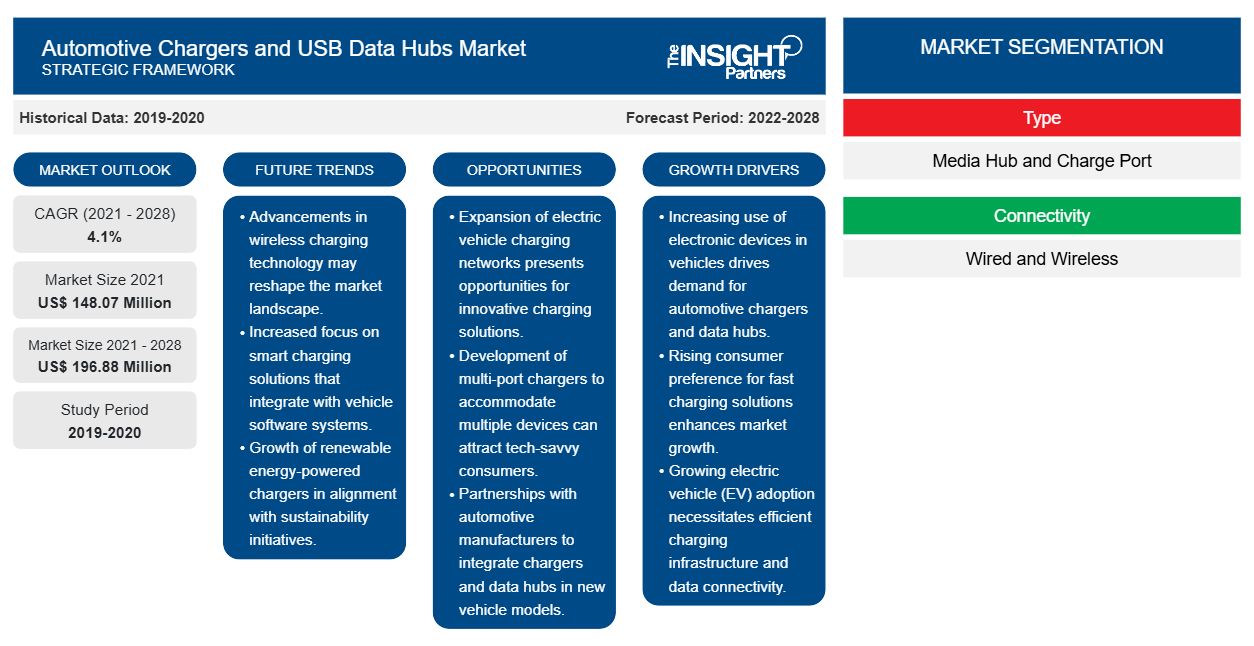
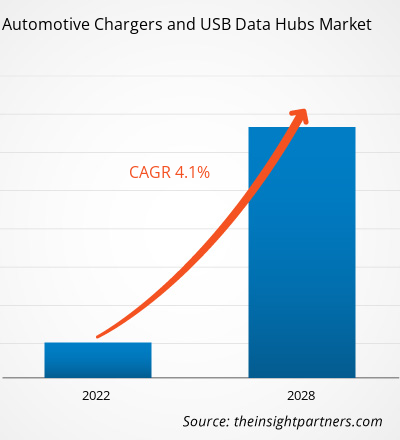
من المتوقع أن ينمو سوق شواحن السيارات ومراكز البيانات USB من 148.07 مليون دولار أمريكي في عام 2021 إلى 196.88 مليون دولار أمريكي بحلول عام 2028؛ ومن المتوقع أن ينمو بمعدل نمو سنوي مركب قدره 4.1٪ خلال الفترة 2021-2028.
إن الشعبية المتزايدة لأنظمة مساعدة السائق (DAS) تجذب انتباه شركات السيارات نحو أتمتة المركبات. يقوم المصنعون بإنشاء مركبات متكاملة مع أنظمة ترفيه متفوقة استجابة للتفضيل المتزايد للمركبات الآمنة والفاخرة والذكية. استجابت شركات تصنيع ملحقات السيارات من خلال تطوير أنظمة USB متطورة للحصول على تجربة أفضل داخل السيارة. تقدم Jumplux Technology Co., Ltd. SPD102 – USB2.0 MEDIA HUB SOC. SPD102 هو محور USB 2.0 عالي السرعة مع منفذين للأسفل وقارئ بطاقات. على عكس محور USB العادي، يدعم محور USB SPD102 CarPlay، والذي يسمح لأجهزة iOS بالتواصل مع شاشة مدمجة لوحدات رأس السيارة، عند الاتصال عبر USB. في المنافذ السفلية، يتم أيضًا دعم مواصفات شحن البطارية USB-IF الإصدار 1.2 (BC 1.2). علاوة على ذلك، يتم تنفيذ مساعدة ركن السيارة، والملاحة التنبؤية، والتخطيط قبل الرحلة، والمزامنة التي تدعمها السحابة، وغيرها من الميزات المهمة من قبل شركات الترفيه المعلوماتي المتطورة تقنيًا. بالإضافة إلى ذلك، يمكن للعملاء عرض قائمة جهات الاتصال الخاصة بهم وسجلات المكالمات وقراءة الرسائل باستخدام موزع USB. ومع التكامل المتزايد للهواتف الذكية مع أنظمة المعلومات والترفيه في السيارات، يتزايد عدد الأشخاص الذين يشترون مركبة عالية الجودة مزودة بأنظمة ترفيه لاسلكية وحديثة. وبالتالي، فإن الزيادة السريعة في تصنيع أنظمة المعلومات والترفيه عالية الدقة من أجل تجربة مستخدم أفضل، استجابة للتفضيل المتزايد لأنظمة المعلومات والترفيه ونظام DAS، تساهم في نمو سوق شواحن السيارات ومراكز البيانات USB .
قم بتخصيص هذا التقرير ليناسب متطلباتك
ستحصل على تخصيص لأي تقرير - مجانًا - بما في ذلك أجزاء من هذا التقرير، أو تحليل على مستوى الدولة، وحزمة بيانات Excel، بالإضافة إلى الاستفادة من العروض والخصومات الرائعة للشركات الناشئة والجامعات
- احصل على أهم اتجاهات السوق الرئيسية لهذا التقرير.ستتضمن هذه العينة المجانية تحليلاً للبيانات، بدءًا من اتجاهات السوق وحتى التقديرات والتوقعات.
تأثير جائحة كوفيد-19 على سوق شواحن السيارات ومراكز البيانات USB
وفقًا لأحدث تقرير حالة من منظمة الصحة العالمية (WHO)، فإن الولايات المتحدة وإسبانيا وإيطاليا وفرنسا وألمانيا والمملكة المتحدة وروسيا وتركيا والبرازيل وإيران والصين هي بعض من أكثر البلدان تضررًا بسبب تفشي COVID-19. تؤثر أزمة COVID-19 على الصناعات في جميع أنحاء العالم ومن المتوقع أن يتضرر الاقتصاد العالمي بشكل أسوأ في عام 2020 وربما في عام 2021. تسبب تفشي المرض في حدوث اضطرابات كبيرة في الصناعات الأولية مثل الأغذية والمشروبات والطاقة والكهرباء والإلكترونيات وأشباه الموصلات والمواد الكيميائية وكذلك السيارات. أثر الانخفاض الحاد في أنشطة إنتاج السيارات سلبًا على نمو سوق شواحن السيارات العالمية ومراكز بيانات USB. أثرت
عمليات إغلاق المصانع وحظر السفر وحظر التجارة وإغلاق الحدود لمكافحة واحتواء تفشي المرض على تصنيع وتوريد ومبيعات المكونات الإلكترونية المختلفة المطلوبة لتصنيع شواحن السيارات ومنافذ USB. يتم وصف التأثير المقدر لتفشي COVID-19 على نمو سوق شواحن السيارات العالمية ومراكز بيانات USB في مختلف البلدان / المناطق أدناه.
رؤى السوق حول شواحن السيارات ومراكز البيانات USB
ارتفاع إنتاج السيارات يغذي نمو سوق شواحن السيارات ومراكز البيانات USB
وصلت مبيعات السيارات إلى مستويات جديدة بسبب الشعبية المتزايدة للشاحنات وسيارات الدفع الرباعي بالإضافة إلى الطلب المتزايد على سيارات السيدان المدمجة. بالنسبة لعدد قليل من شركات صناعة السيارات، ارتفعت المبيعات بنسبة مزدوجة الرقم، حيث تضاعف إجمالي تسليمات تسلا أكثر من ثلاثة أضعاف عن الربع الأول من العام الماضي. أبلغت تويوتا وهيونداي ونيسان وسوبارو وكيا عن زيادات في المبيعات بنسبة مزدوجة الرقم. في عام 2020، سيتم إنتاج 78 مليون مركبة على مستوى العالم. يعكس هذا الرقم انخفاضًا بنسبة 15 في المائة عن العام السابق. في عام 2020، كانت الصين واليابان وألمانيا أكبر مصنعي السيارات والمركبات التجارية. مع مثل هذه الأحجام الضخمة لتصنيع المركبات، فإن الحاجة إلى ملحقات السيارات آخذة في الارتفاع أيضًا. إن التركيز الاستهلاكي الكبير على أنظمة المعلومات والترفيه في المركبات والشعبية المتزايدة للأجهزة الشخصية يعززان نمو سوق شواحن السيارات ومحاور البيانات USB.
حددت العديد من الدول في العالم أهدافًا تؤكد على تقليل انبعاثات السيارات. وكجزء من هذا، فقد بدأوا في الترويج لإنتاج وتسويق المركبات الكهربائية بالإضافة إلى البنية التحتية للشحن ذات الصلة. في عام 2017، أنفقت حكومة الولايات المتحدة 5 مليارات دولار أمريكي لتحسين البنية التحتية للسيارات الكهربائية، بما في ذلك محطات الشحن. وتقدم العديد من الحكومات حوافز، بما في ذلك تكاليف التسجيل الرخيصة أو المعدومة، فضلاً عن الإعفاءات من ضريبة الاستيراد وضريبة المبيعات وضريبة الطرق. وعلاوة على ذلك، تستثمر النرويج وألمانيا بشكل كبير في الترويج لمبيعات السيارات الكهربائية. وبالتالي، فإن الزيادة في إنتاج السيارات، مع التركيز المتزايد على المركبات الكهربائية، تعزز نمو سوق شواحن السيارات ومحاور البيانات USB.
رؤى السوق القائمة على النوع
بناءً على النوع، ينقسم سوق شواحن السيارات ومراكز بيانات USB إلى مركز وسائط ومنافذ شحن. في عام 2020، استحوذ قطاع منافذ الشحن على حصة سوقية أكبر.
رؤى السوق القائمة على الاتصال
بناءً على الاتصال، يتم تقسيم سوق شواحن السيارات ومراكز البيانات USB إلى سلكية ولاسلكية. في عام 2020، استحوذت الشريحة السلكية على حصة سوقية أكبر.
يتبنى اللاعبون العاملون في سوق شواحن السيارات ومراكز البيانات USB استراتيجيات مثل عمليات الدمج والاستحواذ ومبادرات السوق للحفاظ على مواقعهم في السوق. فيما يلي قائمة ببعض التطورات التي قام بها اللاعبون الرئيسيون:
- في فبراير 2020، يسعدنا في Aircharge عرض طاولات الشحن اللاسلكي كجزء من جناح موردي الفنادق في مؤتمر الفنادق والمطاعم والتموين (HRC)، الذي يُعقد في ExCel، لندن في الفترة من 3 إلى 5 مارس 2020.
- في أغسطس 2019، أعلنت شركة Microchip عن حلين جديدين لتبسيط تصميمات USB Type-C PD لإزالة التعقيد التقليدي والتكاليف العالية المرتبطة بتنفيذ USB Type-C في مجموعة من التطبيقات.
رؤى إقليمية حول سوق شواحن السيارات ومراكز البيانات USB
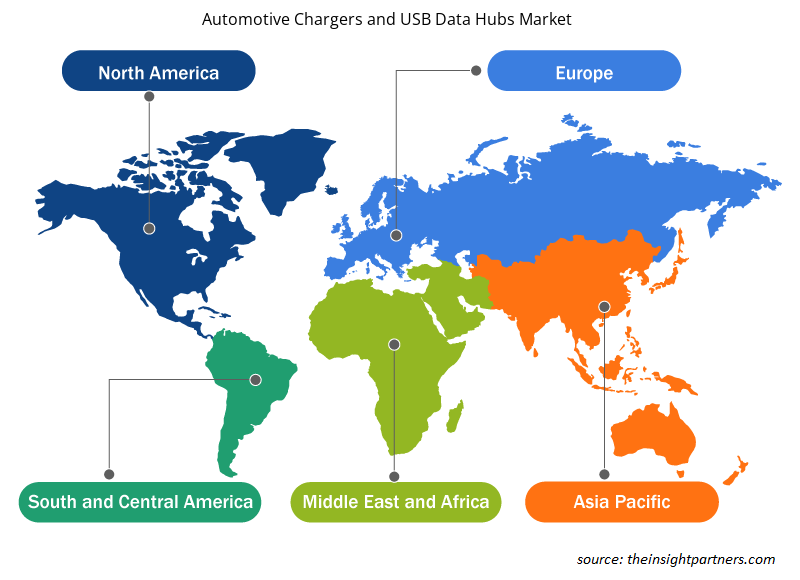
لقد قام المحللون في Insight Partners بشرح الاتجاهات والعوامل الإقليمية المؤثرة على سوق شواحن السيارات ومراكز البيانات USB طوال فترة التوقعات بشكل شامل. يناقش هذا القسم أيضًا قطاعات سوق شواحن السيارات ومراكز البيانات USB والجغرافيا في جميع أنحاء أمريكا الشمالية وأوروبا ومنطقة آسيا والمحيط الهادئ والشرق الأوسط وأفريقيا وأمريكا الجنوبية والوسطى.

- احصل على البيانات الإقليمية المحددة لسوق شواحن السيارات ومراكز البيانات USB
نطاق تقرير سوق شواحن السيارات ومراكز البيانات USB
| سمة التقرير | تفاصيل |
|---|---|
| حجم السوق في عام 2021 | 148.07 مليون دولار أمريكي |
| حجم السوق بحلول عام 2028 | 196.88 مليون دولار أمريكي |
| معدل النمو السنوي المركب العالمي (2021 - 2028) | 4.1% |
| البيانات التاريخية | 2019-2020 |
| فترة التنبؤ | 2022-2028 |
| القطاعات المغطاة | حسب النوع
|
| المناطق والدول المغطاة | أمريكا الشمالية
|
| قادة السوق وملفات تعريف الشركات الرئيسية |
|
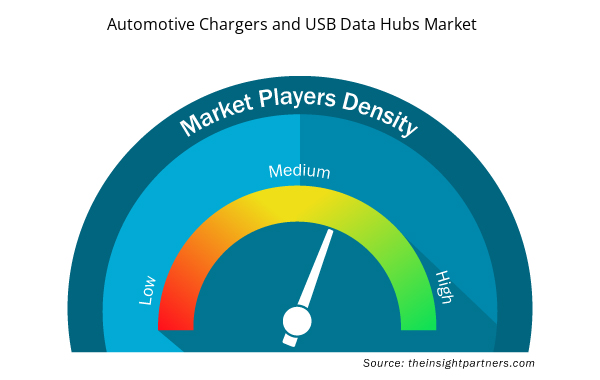
كثافة اللاعبين في سوق شواحن السيارات ومراكز البيانات USB: فهم تأثيرها على ديناميكيات الأعمال
يشهد سوق شواحن السيارات ومراكز البيانات USB نموًا سريعًا، مدفوعًا بالطلب المتزايد من المستخدم النهائي بسبب عوامل مثل تفضيلات المستهلكين المتطورة والتقدم التكنولوجي والوعي الأكبر بفوائد المنتج. ومع ارتفاع الطلب، تعمل الشركات على توسيع عروضها والابتكار لتلبية احتياجات المستهلكين والاستفادة من الاتجاهات الناشئة، مما يؤدي إلى زيادة نمو السوق.
تشير كثافة اللاعبين في السوق إلى توزيع الشركات أو المؤسسات العاملة في سوق أو صناعة معينة. وهي تشير إلى عدد المنافسين (اللاعبين في السوق) الموجودين في مساحة سوق معينة نسبة إلى حجمها أو قيمتها السوقية الإجمالية.
الشركات الرئيسية العاملة في سوق شواحن السيارات ومراكز البيانات USB هي:
- شركة يوني ماكس للإلكترونيات
- شركة جامبلوكس للتكنولوجيا المحدودة
- شركة إنفينيون للتكنولوجيا
- هارمان الدولية
- موليكس، ذ.م.م
إخلاء المسؤولية : الشركات المذكورة أعلاه ليست مرتبة بأي ترتيب معين.

- احصل على نظرة عامة على أهم اللاعبين الرئيسيين في سوق شواحن السيارات ومراكز البيانات USB
تم تقسيم سوق شواحن السيارات العالمية ومراكز البيانات USB على النحو المذكور أدناه:
حسب النوع
- مركز الاعلام
- منفذ الشحن
حسب الاتصال
- سلكي
- لاسلكي
حسب الجغرافيا
- أمريكا الشمالية
- نحن
- كندا
- المكسيك
- أوروبا
- فرنسا
- ألمانيا
- إيطاليا
- المملكة المتحدة
- روسيا
- بقية أوروبا
- آسيا والمحيط الهادئ (APAC)
- الصين
- الهند
- كوريا الجنوبية
- اليابان
- أستراليا
- بقية منطقة آسيا والمحيط الهادئ
- الشرق الأوسط وأفريقيا
- جنوب أفريقيا
- المملكة العربية السعودية
- الامارات العربية المتحدة
- باقي منطقة الشرق الأوسط وأفريقيا
- أمريكا الجنوبية (SAM)
- البرازيل
- الأرجنتين
- بقية سام
نبذة عن الشركة
- شركة يوني ماكس للإلكترونيات
- شركة جامبلوكس للتكنولوجيا المحدودة
- شركة إنفينيون للتكنولوجيا
- هارمان الدولية
- موليكس، ذ.م.م.
- شركة مونوليثيك باور سيستمز المحدودة
- شركة اليابان لصناعة إلكترونيات الطيران المحدودة
- أمفينول تيكفوكس
- الشحن الجوي
- شركة مايكرو شيب للتكنولوجيا
- التحليل التاريخي (سنتان)، السنة الأساسية، التوقعات (7 سنوات) مع معدل النمو السنوي المركب
- تحليل PEST و SWOT
- حجم السوق والقيمة / الحجم - عالميًا وإقليميًا وقطريًا
- الصناعة والمنافسة
- مجموعة بيانات Excel


- Resistance Bands Market
- Malaria Treatment Market
- Artificial Intelligence in Healthcare Diagnosis Market
- Sandwich Panel Market
- Environmental Consulting Service Market
- Glycomics Market
- Single-Use Negative Pressure Wound Therapy Devices Market
- Bathroom Vanities Market
- Nitrogenous Fertilizer Market
- Constipation Treatment Market

Report Coverage
Revenue forecast, Company Analysis, Industry landscape, Growth factors, and Trends

Segment Covered
This text is related
to segments covered.

Regional Scope
North America, Europe, Asia Pacific, Middle East & Africa, South & Central America

Country Scope
This text is related
to country scope.
الأسئلة الشائعة
Fast charging is a must-have feature in the modern devices, which helps keep the batteries charged throughout the day. Quick charging allows users to resume the activity withing a few minutes. Many modern gadgets include some form of quick-charging feature, usually with a changeable current demand. However, different companies have varying standards, and charging speed is frequently determined by connections and chargers. Consumers tend to carry their PDs such as cellphones, tablets, and media players with them everywhere they go.
Growing popularity of driver assistance systems (DAS) is drawing the attention of the automotive firms toward vehicle automation. The manufacturers are creating vehicles integrated with superior entertainment systems in response to the growing preference for safe, luxurious, and smart vehicles. Automobile accessory makers have responded by developing sophisticated USB systems for a better in-vehicle experience.
Two decades ago, USB got a makeover with a 2.0 update. The update supported a much faster speed than the older version. It is also notable for adding USB OTG (On-The-Go) support, which permits two USB devices to communicate directly. USB 2.0 is used in cheaper flash drives with different devices. In addition, players such as AllGo Embedded Systems offer CarPlay that is compatible with an iOS operating system. With built-in display units of automobile Head Units when devices are connected via USB port. The CarPlay adapter or media hub supports USB 2.0.
Trends and growth analysis reports related to Automotive and Transportation : READ MORE..
The List of Companies Automotive Chargers and USB data hubs Market
- UniMax Electronics Inc.
- Jumplux Technology Co., Ltd.
- INFINEON TECHNOLOGIES AG
- Harman International
- Molex, LLC
- Monolithic Power Systems, Inc.
- Japan Aviation Electronics Industry, Ltd.
- Amphenol Tecvox
- Aircharge
- Microchip Technologies, Inc.
The Insight Partners performs research in 4 major stages: Data Collection & Secondary Research, Primary Research, Data Analysis and Data Triangulation & Final Review.
- Data Collection and Secondary Research:
As a market research and consulting firm operating from a decade, we have published and advised several client across the globe. First step for any study will start with an assessment of currently available data and insights from existing reports. Further, historical and current market information is collected from Investor Presentations, Annual Reports, SEC Filings, etc., and other information related to company’s performance and market positioning are gathered from Paid Databases (Factiva, Hoovers, and Reuters) and various other publications available in public domain.
Several associations trade associates, technical forums, institutes, societies and organization are accessed to gain technical as well as market related insights through their publications such as research papers, blogs and press releases related to the studies are referred to get cues about the market. Further, white papers, journals, magazines, and other news articles published in last 3 years are scrutinized and analyzed to understand the current market trends.
- Primary Research:
The primarily interview analysis comprise of data obtained from industry participants interview and answers to survey questions gathered by in-house primary team.
For primary research, interviews are conducted with industry experts/CEOs/Marketing Managers/VPs/Subject Matter Experts from both demand and supply side to get a 360-degree view of the market. The primary team conducts several interviews based on the complexity of the markets to understand the various market trends and dynamics which makes research more credible and precise.
A typical research interview fulfils the following functions:
- Provides first-hand information on the market size, market trends, growth trends, competitive landscape, and outlook
- Validates and strengthens in-house secondary research findings
- Develops the analysis team’s expertise and market understanding
Primary research involves email interactions and telephone interviews for each market, category, segment, and sub-segment across geographies. The participants who typically take part in such a process include, but are not limited to:
- Industry participants: VPs, business development managers, market intelligence managers and national sales managers
- Outside experts: Valuation experts, research analysts and key opinion leaders specializing in the electronics and semiconductor industry.
Below is the breakup of our primary respondents by company, designation, and region:

Once we receive the confirmation from primary research sources or primary respondents, we finalize the base year market estimation and forecast the data as per the macroeconomic and microeconomic factors assessed during data collection.
- Data Analysis:
Once data is validated through both secondary as well as primary respondents, we finalize the market estimations by hypothesis formulation and factor analysis at regional and country level.
- Macro-Economic Factor Analysis:
We analyse macroeconomic indicators such the gross domestic product (GDP), increase in the demand for goods and services across industries, technological advancement, regional economic growth, governmental policies, the influence of COVID-19, PEST analysis, and other aspects. This analysis aids in setting benchmarks for various nations/regions and approximating market splits. Additionally, the general trend of the aforementioned components aid in determining the market's development possibilities.
- Country Level Data:
Various factors that are especially aligned to the country are taken into account to determine the market size for a certain area and country, including the presence of vendors, such as headquarters and offices, the country's GDP, demand patterns, and industry growth. To comprehend the market dynamics for the nation, a number of growth variables, inhibitors, application areas, and current market trends are researched. The aforementioned elements aid in determining the country's overall market's growth potential.
- Company Profile:
The “Table of Contents” is formulated by listing and analyzing more than 25 - 30 companies operating in the market ecosystem across geographies. However, we profile only 10 companies as a standard practice in our syndicate reports. These 10 companies comprise leading, emerging, and regional players. Nonetheless, our analysis is not restricted to the 10 listed companies, we also analyze other companies present in the market to develop a holistic view and understand the prevailing trends. The “Company Profiles” section in the report covers key facts, business description, products & services, financial information, SWOT analysis, and key developments. The financial information presented is extracted from the annual reports and official documents of the publicly listed companies. Upon collecting the information for the sections of respective companies, we verify them via various primary sources and then compile the data in respective company profiles. The company level information helps us in deriving the base number as well as in forecasting the market size.
- Developing Base Number:
Aggregation of sales statistics (2020-2022) and macro-economic factor, and other secondary and primary research insights are utilized to arrive at base number and related market shares for 2022. The data gaps are identified in this step and relevant market data is analyzed, collected from paid primary interviews or databases. On finalizing the base year market size, forecasts are developed on the basis of macro-economic, industry and market growth factors and company level analysis.
- Data Triangulation and Final Review:
The market findings and base year market size calculations are validated from supply as well as demand side. Demand side validations are based on macro-economic factor analysis and benchmarks for respective regions and countries. In case of supply side validations, revenues of major companies are estimated (in case not available) based on industry benchmark, approximate number of employees, product portfolio, and primary interviews revenues are gathered. Further revenue from target product/service segment is assessed to avoid overshooting of market statistics. In case of heavy deviations between supply and demand side values, all thes steps are repeated to achieve synchronization.
We follow an iterative model, wherein we share our research findings with Subject Matter Experts (SME’s) and Key Opinion Leaders (KOLs) until consensus view of the market is not formulated – this model negates any drastic deviation in the opinions of experts. Only validated and universally acceptable research findings are quoted in our reports.
We have important check points that we use to validate our research findings – which we call – data triangulation, where we validate the information, we generate from secondary sources with primary interviews and then we re-validate with our internal data bases and Subject matter experts. This comprehensive model enables us to deliver high quality, reliable data in shortest possible time.


 احصل على عينة مجانية لهذا التقرير