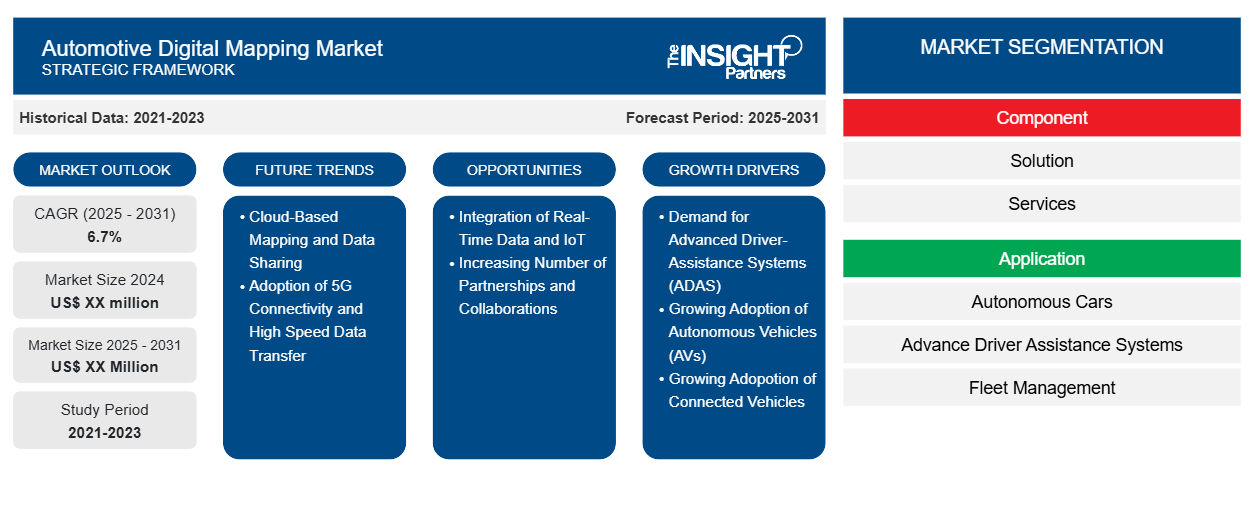
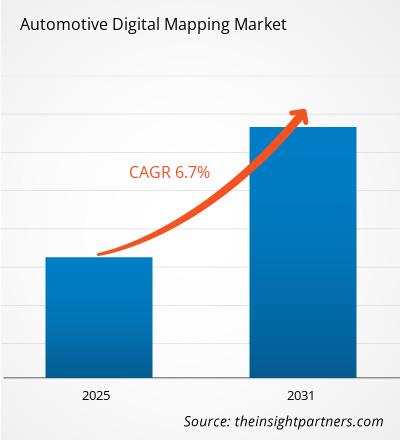
من المتوقع أن يسجل سوق رسم الخرائط الرقمية للسيارات معدل نمو سنوي مركب بنسبة 6.7٪ من عام 2023 إلى عام 2031، مع توسع حجم السوق من XX مليون دولار أمريكي في عام 2023 إلى XX مليون دولار أمريكي بحلول عام 2031.
تم تقسيم التقرير حسب المكون (الحل والخدمات)؛ التطبيق (السيارات ذاتية القيادة، أنظمة مساعدة السائق المتقدمة (ADAS)، إدارة الأسطول)، كما تم تقسيم التحليل العالمي بشكل أكبر على المستوى الإقليمي والدول الرئيسية. يقدم التقرير القيمة بالدولار الأمريكي للتحليل والقطاعات المذكورة أعلاه.
غرض التقرير
يهدف تقرير سوق رسم الخرائط الرقمية للسيارات الصادر عن The Insight Partners إلى وصف المشهد الحالي والنمو المستقبلي وأهم العوامل الدافعة والتحديات والفرص. وسيوفر هذا رؤى لمختلف أصحاب المصلحة في الأعمال التجارية، مثل:
- مزودي/مصنعي التكنولوجيا: لفهم ديناميكيات السوق المتطورة ومعرفة فرص النمو المحتملة، وتمكينهم من اتخاذ قرارات استراتيجية مستنيرة.
- المستثمرون: إجراء تحليل شامل للاتجاهات فيما يتعلق بمعدل نمو السوق، وتوقعات السوق المالية، والفرص المتاحة عبر سلسلة القيمة.
- الهيئات التنظيمية: لتنظيم السياسات ومراقبة الأنشطة في السوق بهدف تقليل الانتهاكات والحفاظ على ثقة المستثمرين والحفاظ على سلامة السوق واستقرارها.
تجزئة سوق رسم الخرائط الرقمية للسيارات
عنصر
- حل
- خدمات
طلب
- السيارات ذاتية القيادة
- أنظمة مساعدة السائق المتقدمة
- إدارة الأسطول
قم بتخصيص هذا التقرير ليناسب متطلباتك
ستحصل على تخصيص لأي تقرير - مجانًا - بما في ذلك أجزاء من هذا التقرير، أو تحليل على مستوى الدولة، وحزمة بيانات Excel، بالإضافة إلى الاستفادة من العروض والخصومات الرائعة للشركات الناشئة والجامعات
سوق رسم الخرائط الرقمية للسيارات: رؤى استراتيجية
- احصل على أهم اتجاهات السوق الرئيسية لهذا التقرير.ستتضمن هذه العينة المجانية تحليلاً للبيانات، بدءًا من اتجاهات السوق وحتى التقديرات والتوقعات.
عوامل نمو سوق رسم الخرائط الرقمية للسيارات
- الطلب على أنظمة مساعدة السائق المتقدمة (ADAS): إن الاستخدام المتزايد لأنظمة مساعدة السائق المتقدمة في المركبات المباعة حديثًا يتطلب تحديث خرائط دقيقة للغاية باستمرار لتعكس الظروف الواقعية بشكل أفضل.
- التبني المتزايد للمركبات ذاتية القيادة: يجب أن تحتوي خرائط المركبات ذاتية القيادة على تضاريس طرق أكبر وإشارات مرور ومشاة وسيارات أخرى، مما يستدعي من صناعة السيارات استخدام خرائط أعلى في رسم الخرائط. تعد بيانات الخرائط عالية الدقة في الوقت الفعلي ضرورية للملاحة الآمنة في البيئات الديناميكية. علاوة على ذلك، تعد الخرائط الرقمية أحد المكونات الأساسية لأنظمة ADAS حيث يتم دفع نمو السوق بشكل أكبر من خلال التبني المتزايد لتقنيات مثل مساعدة الحفاظ على المسار وأنظمة الكبح في حالات الطوارئ وأدوات التحكم في السرعة والاستشعار بعيد المدى. علاوة على ذلك، مع زيادة تبني أنظمة ADAS، فإن اعتماد رسم الخرائط الرقمية في الوقت الفعلي ينمو أيضًا مما يدفع نمو سوق رسم الخرائط الرقمية للسيارات في جميع أنحاء العالم.
- التبني المتزايد للمركبات المتصلة: يعد التبني المتزايد للمركبات المتصلة عاملاً رئيسيًا آخر يدفع نمو سوق رسم الخرائط الرقمية للسيارات. ويرجع هذا بشكل أساسي إلى الطلب على رسم الخرائط الرقمية في أنظمة القيادة الذاتية التي تستخدم الميزة لمعايرة عمليات القيادة أثناء التشغيل. تعتمد المركبات المتصلة ذاتية القيادة على الخرائط الرقمية لإنشاء مخطط لخرائط الطرق والعمل وفقًا لذلك. وهذا يدفع أيضًا إلى نمو سوق رسم الخرائط الرقمية للسيارات عبر مناطق مختلفة.
- تزايد استخدام المركبات الكهربائية: يتطلب نمو المركبات الكهربائية بنية تحتية ذكية لمحطات الشحن، وطرق موفرة للطاقة، واستخدام مثالي للطاقة. تحتاج الخرائط الرقمية إلى دمج المعلومات حول محطات الشحن، وأنماط المرور، والطرق التي تقلل من استهلاك الطاقة. ستكون الخرائط الرقمية التي تسلط الضوء على البنية التحتية لشحن المركبات الكهربائية، والطرق ذات استهلاك الطاقة الأقل، وتوقعات عمر البطارية مهمة بشكل متزايد لمستخدمي المركبات الكهربائية.
الاتجاهات المستقبلية لسوق رسم الخرائط الرقمية للسيارات
- الخرائط المستندة إلى السحابة ومشاركة البيانات: تزداد شعبية خدمات الخرائط المستندة إلى السحابة بشكل متزايد بسبب قابليتها للتوسع، وخرائطها في الوقت الفعلي والمحدثة والمحدثة باستمرار. يتطلب تطور الخرائط الرقمية تكامل البيانات في الوقت الفعلي. بمساعدة الحوسبة السحابية، يمكن تحديث حل رسم الخرائط للسيارات دائمًا باستخدام بيانات في الوقت الفعلي من أجهزة الاستشعار ونظام تحديد المواقع العالمي والمركبات المتصلة والمزيد. يضمن هذا الاتجاه إنتاج خرائط أكثر دقة وحتى السماح بالتكيف مع التغييرات مثل البناء أو الحوادث أو إغلاق الطرق. على نحو متزايد، سيكون من المهم تعزيز كفاءة الملاحة والتخطيط والعمليات في المركبات.
- اعتماد اتصال 5G ونقل البيانات بسرعة عالية: ستتحسن سرعات نقل البيانات بشكل كبير مع طرح شبكات 5G، مما يؤدي إلى تحديثات أسرع ومشاركة الخرائط الرقمية. سيسمح الاتصال المحسن بتحديثات شبه فورية للسيارات ذاتية القيادة والمركبات المتصلة. مع 5G، يمكن تحديث الخرائط الرقمية باستمرار؛ وبالتالي، يمكن للمركبات تغيير المسارات أو ظروف المرور أو العوامل البيئية بأقل قدر من زمن الوصول، وهو أمر مهم لبيانات الخرائط في الوقت الفعلي للسيارات ذاتية القيادة وأنظمة مساعدة السائق المتقدمة.
فرص سوق رسم الخرائط الرقمية للسيارات
- دمج البيانات في الوقت الفعلي وإنترنت الأشياء: يمكن للسيارات المجهزة بأجهزة استشعار إنتاج بيانات في الوقت الفعلي حول حالة الطرق، وحركة المرور، والحوادث، أو حتى أنماط الطقس. ومن ثم يمكن جمع هذه البيانات وتفسيرها واستخدامها من خلال إنشاء خرائط رقمية مع تحسينات مستمرة لتعزيز دقة الملاحة.
- العدد المتزايد من الشراكات والتعاون: إن العدد المتزايد من الشراكات والتعاون بين مطوري أنظمة رسم الخرائط ومصنعي السيارات هو عامل رئيسي آخر من المرجح أن يولد فرصًا جديدة لبائعي سوق رسم الخرائط الرقمية للسيارات في السنوات القادمة. مع التركيز المتزايد على وضع الخرائط الرقمية في العديد من تقنيات السيارات، فإن فرص النمو والابتكار متاحة على نطاق واسع في الشراكات والاستحواذات بين صناعات السيارات والتكنولوجيا والاتصالات. يمكن للشركات المتخصصة في رسم الخرائط التعاون مع الشركات المصنعة للمعدات الأصلية لتوفير حلول رسم خرائط مخصصة لتقنيات الملاحة والمركبات ذاتية القيادة في السيارات. على سبيل المثال، تتعاون خرائط Google وخرائط Apple بالفعل مع شركات تصنيع السيارات لتثبيت أنظمة رسم الخرائط الخاصة بها في السيارات. قد تشتري شركات التكنولوجيا الكبيرة أو شركات تصنيع السيارات أيضًا شركات ناشئة صغيرة في رسم الخرائط أو تقنيات رسم الخرائط ثلاثية الأبعاد التي تركز على مجالات محددة مثل الخرائط عالية الدقة وقدرات التحديث في الوقت الفعلي لسد الفجوات وإضافة المزيد إلى محفظتها وقدراتها.
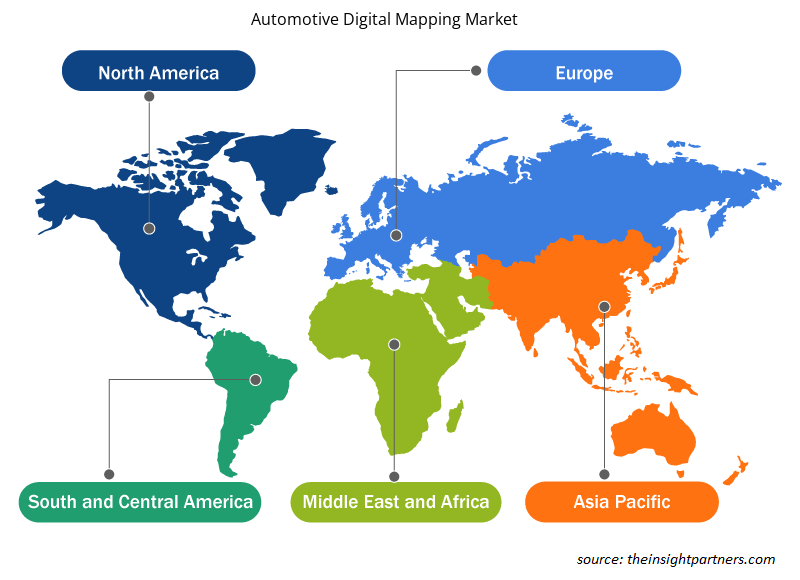
رؤى إقليمية حول سوق رسم الخرائط الرقمية للسيارات
لقد قام المحللون في Insight Partners بشرح الاتجاهات والعوامل الإقليمية المؤثرة على سوق الخرائط الرقمية للسيارات طوال فترة التوقعات بشكل شامل. يناقش هذا القسم أيضًا قطاعات سوق الخرائط الرقمية للسيارات والجغرافيا في جميع أنحاء أمريكا الشمالية وأوروبا ومنطقة آسيا والمحيط الهادئ والشرق الأوسط وأفريقيا وأمريكا الجنوبية والوسطى.
- احصل على البيانات الإقليمية المحددة لسوق رسم الخرائط الرقمية للسيارات
نطاق تقرير سوق رسم الخرائط الرقمية للسيارات
| سمة التقرير | تفاصيل |
|---|---|
| حجم السوق في عام 2023 | XX مليون دولار أمريكي |
| حجم السوق بحلول عام 2031 | XX مليون دولار أمريكي |
| معدل النمو السنوي المركب العالمي (2023 - 2031) | 6.7% |
| البيانات التاريخية | 2021-2022 |
| فترة التنبؤ | 2024-2031 |
| القطاعات المغطاة | حسب المكون
|
| المناطق والدول المغطاة | أمريكا الشمالية
|
| قادة السوق وملفات تعريف الشركات الرئيسية |
|
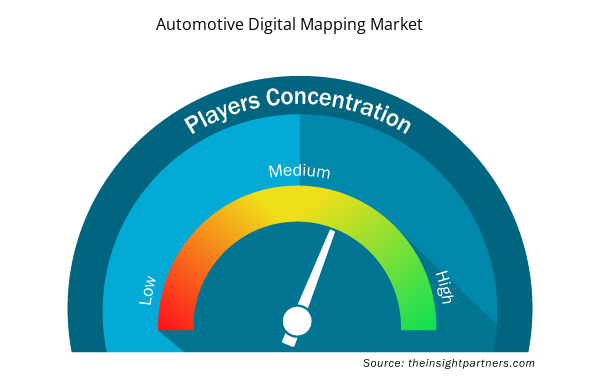
كثافة اللاعبين في سوق رسم الخرائط الرقمية للسيارات: فهم تأثيرها على ديناميكيات الأعمال
يشهد سوق رسم الخرائط الرقمية للسيارات نموًا سريعًا، مدفوعًا بالطلب المتزايد من المستخدم النهائي بسبب عوامل مثل تفضيلات المستهلكين المتطورة والتقدم التكنولوجي والوعي المتزايد بفوائد المنتج. ومع ارتفاع الطلب، تعمل الشركات على توسيع عروضها والابتكار لتلبية احتياجات المستهلكين والاستفادة من الاتجاهات الناشئة، مما يؤدي إلى زيادة نمو السوق.
تشير كثافة اللاعبين في السوق إلى توزيع الشركات أو المؤسسات العاملة في سوق أو صناعة معينة. وهي تشير إلى عدد المنافسين (اللاعبين في السوق) الموجودين في مساحة سوق معينة نسبة إلى حجمها أو قيمتها السوقية الإجمالية.
الشركات الرئيسية العاملة في سوق رسم الخرائط الرقمية للسيارات هي:
- شركة أبل
- شركة ARC للتصوير الجوي المحدودة
- شركة إسري العالمية
- شركة جوجل المحدودة
- شركة HERE Global BV
إخلاء المسؤولية : الشركات المذكورة أعلاه ليست مرتبة بأي ترتيب معين.
- احصل على نظرة عامة على أهم اللاعبين الرئيسيين في سوق رسم الخرائط الرقمية للسيارات
نقاط البيع الرئيسية
- التغطية الشاملة: يغطي التقرير بشكل شامل تحليل المنتجات والخدمات والأنواع والمستخدمين النهائيين لسوق رسم الخرائط الرقمية للسيارات، مما يوفر صورة شاملة.
- تحليل الخبراء: تم تجميع التقرير على أساس الفهم العميق لخبراء الصناعة والمحللين.
- معلومات محدثة: يضمن التقرير أهمية الأعمال التجارية بسبب تغطيته للمعلومات الحديثة واتجاهات البيانات.
- خيارات التخصيص: يمكن تخصيص هذا التقرير لتلبية متطلبات العملاء المحددة وبما يتناسب مع استراتيجيات العمل بشكل مناسب.
وبالتالي، يمكن أن يساعد تقرير البحث حول سوق رسم الخرائط الرقمية للسيارات في تمهيد الطريق لفك شفرة وفهم سيناريو الصناعة وآفاق النمو. ورغم وجود بعض المخاوف المشروعة، فإن الفوائد الإجمالية لهذا التقرير تميل إلى التفوق على العيوب.
- التحليل التاريخي (سنتان)، السنة الأساسية، التوقعات (7 سنوات) مع معدل النمو السنوي المركب
- تحليل PEST و SWOT
- حجم السوق والقيمة / الحجم - عالميًا وإقليميًا وقطريًا
- الصناعة والمنافسة
- مجموعة بيانات Excel


Report Coverage
Revenue forecast, Company Analysis, Industry landscape, Growth factors, and Trends

Segment Covered
This text is related
to segments covered.

Regional Scope
North America, Europe, Asia Pacific, Middle East & Africa, South & Central America

Country Scope
This text is related
to country scope.
الأسئلة الشائعة
The Automotive Digital Mapping Market is estimated to witness a CAGR of 6.7% from 2023 to 2032
The major factors driving the Automotive Digital Mapping Market are: Growing Adoption of Autonomous Vehicles (AVs)#Demand for Advanced Driver-Assistance Systems (ADAS)
Integration of Real-Time Data and IoT is the key future trend of the Automotive Digital Mapping Market
The leading players operating in the Automotive Digital Mapping Market include Apple Inc., ARC Aerial Imaging Limited, Esri Global, Inc., Google LLC, HERE Global B.V., MapQuest (AOL), MiTAC Holdings Corp, Mitsubishi Electric Corp., Nearmap Ltd
The report can be delivered in PDF/PPT format; we can also share excel dataset based on the request.
Some of the customization options available based on the request are an additional 3-5 company profiles and country-specific analysis of 3-5 countries of your choice. Customizations are to be requested/discussed before making final order confirmation, as our team would review the same and check the feasibility.
Trends and growth analysis reports related to Automotive and Transportation : READ MORE..
The List of Companies
1.Apple Inc.
2.ARC Aerial Imaging Limited
3.Esri Global, Inc.
4.Google LLC
5.HERE Global B.V.
6.MapQuest (AOL)
7.MiTAC Holdings Corp
8.Mitsubishi Electric Corp.
9.Nearmap Ltd
10.Tomtom NV
The Insight Partners performs research in 4 major stages: Data Collection & Secondary Research, Primary Research, Data Analysis and Data Triangulation & Final Review.
- Data Collection and Secondary Research:
As a market research and consulting firm operating from a decade, we have published and advised several client across the globe. First step for any study will start with an assessment of currently available data and insights from existing reports. Further, historical and current market information is collected from Investor Presentations, Annual Reports, SEC Filings, etc., and other information related to company’s performance and market positioning are gathered from Paid Databases (Factiva, Hoovers, and Reuters) and various other publications available in public domain.
Several associations trade associates, technical forums, institutes, societies and organization are accessed to gain technical as well as market related insights through their publications such as research papers, blogs and press releases related to the studies are referred to get cues about the market. Further, white papers, journals, magazines, and other news articles published in last 3 years are scrutinized and analyzed to understand the current market trends.
- Primary Research:
The primarily interview analysis comprise of data obtained from industry participants interview and answers to survey questions gathered by in-house primary team.
For primary research, interviews are conducted with industry experts/CEOs/Marketing Managers/VPs/Subject Matter Experts from both demand and supply side to get a 360-degree view of the market. The primary team conducts several interviews based on the complexity of the markets to understand the various market trends and dynamics which makes research more credible and precise.
A typical research interview fulfils the following functions:
- Provides first-hand information on the market size, market trends, growth trends, competitive landscape, and outlook
- Validates and strengthens in-house secondary research findings
- Develops the analysis team’s expertise and market understanding
Primary research involves email interactions and telephone interviews for each market, category, segment, and sub-segment across geographies. The participants who typically take part in such a process include, but are not limited to:
- Industry participants: VPs, business development managers, market intelligence managers and national sales managers
- Outside experts: Valuation experts, research analysts and key opinion leaders specializing in the electronics and semiconductor industry.
Below is the breakup of our primary respondents by company, designation, and region:

Once we receive the confirmation from primary research sources or primary respondents, we finalize the base year market estimation and forecast the data as per the macroeconomic and microeconomic factors assessed during data collection.
- Data Analysis:
Once data is validated through both secondary as well as primary respondents, we finalize the market estimations by hypothesis formulation and factor analysis at regional and country level.
- Macro-Economic Factor Analysis:
We analyse macroeconomic indicators such the gross domestic product (GDP), increase in the demand for goods and services across industries, technological advancement, regional economic growth, governmental policies, the influence of COVID-19, PEST analysis, and other aspects. This analysis aids in setting benchmarks for various nations/regions and approximating market splits. Additionally, the general trend of the aforementioned components aid in determining the market's development possibilities.
- Country Level Data:
Various factors that are especially aligned to the country are taken into account to determine the market size for a certain area and country, including the presence of vendors, such as headquarters and offices, the country's GDP, demand patterns, and industry growth. To comprehend the market dynamics for the nation, a number of growth variables, inhibitors, application areas, and current market trends are researched. The aforementioned elements aid in determining the country's overall market's growth potential.
- Company Profile:
The “Table of Contents” is formulated by listing and analyzing more than 25 - 30 companies operating in the market ecosystem across geographies. However, we profile only 10 companies as a standard practice in our syndicate reports. These 10 companies comprise leading, emerging, and regional players. Nonetheless, our analysis is not restricted to the 10 listed companies, we also analyze other companies present in the market to develop a holistic view and understand the prevailing trends. The “Company Profiles” section in the report covers key facts, business description, products & services, financial information, SWOT analysis, and key developments. The financial information presented is extracted from the annual reports and official documents of the publicly listed companies. Upon collecting the information for the sections of respective companies, we verify them via various primary sources and then compile the data in respective company profiles. The company level information helps us in deriving the base number as well as in forecasting the market size.
- Developing Base Number:
Aggregation of sales statistics (2020-2022) and macro-economic factor, and other secondary and primary research insights are utilized to arrive at base number and related market shares for 2022. The data gaps are identified in this step and relevant market data is analyzed, collected from paid primary interviews or databases. On finalizing the base year market size, forecasts are developed on the basis of macro-economic, industry and market growth factors and company level analysis.
- Data Triangulation and Final Review:
The market findings and base year market size calculations are validated from supply as well as demand side. Demand side validations are based on macro-economic factor analysis and benchmarks for respective regions and countries. In case of supply side validations, revenues of major companies are estimated (in case not available) based on industry benchmark, approximate number of employees, product portfolio, and primary interviews revenues are gathered. Further revenue from target product/service segment is assessed to avoid overshooting of market statistics. In case of heavy deviations between supply and demand side values, all thes steps are repeated to achieve synchronization.
We follow an iterative model, wherein we share our research findings with Subject Matter Experts (SME’s) and Key Opinion Leaders (KOLs) until consensus view of the market is not formulated – this model negates any drastic deviation in the opinions of experts. Only validated and universally acceptable research findings are quoted in our reports.
We have important check points that we use to validate our research findings – which we call – data triangulation, where we validate the information, we generate from secondary sources with primary interviews and then we re-validate with our internal data bases and Subject matter experts. This comprehensive model enables us to deliver high quality, reliable data in shortest possible time.
 احصل على عينة مجانية لهذا التقرير