نظرة عامة على سوق المواد الغذائية B2B والنمو والاتجاهات والتحليل والتقرير البحثي (2022-2028)

  • Report Code : TIPRE00015838
  • Category : Technology, Media and Telecommunications
  • Status : Published
  • No. of Pages : 163
Buy Now

B2B Food Marketplace Platform Market Size & Share | Report 2028

Buy Now


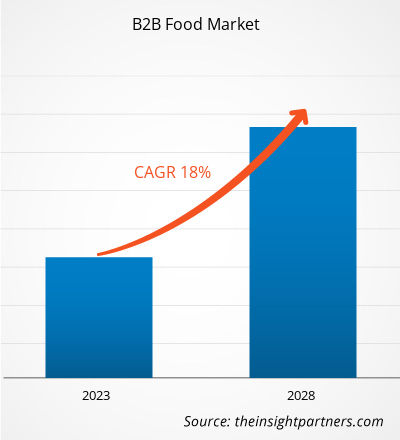
من المتوقع أن ينمو سوق منصات سوق المواد الغذائية B2B من 29,326.79 مليون دولار أمريكي في عام 2022 إلى 78,988.62 مليون دولار أمريكي بحلول عام 2028؛ ومن المتوقع أن ينمو بمعدل نمو سنوي مركب قدره 18.0٪ من عام 2022 إلى عام 2028.

تعمل منصات سوق المواد الغذائية B2B على ربط المشترين والبائعين في جميع أنحاء العالم. يمكن أن يكون البائعون في هذه المنصات منتجين أو بائعين، بينما يمكن أن يكون المشترون تجار تجزئة؛ الباعة؛ والجهات الفاعلة في صناعة الخدمات الغذائية، مثل المطاعم والفنادق والمقاصف. تُستخدم هذه المنصات لتداول الأطعمة المصنعة وغير المصنعة. يشهد سوق منصات سوق المواد الغذائية B2B نموًا كبيرًا بسبب انتشار الهواتف الذكية والأجهزة اللوحية، مما يسهل التواصل بشكل أفضل بين الشركات الصغيرة والمتوسطة والمشترين. علاوة على ذلك، فإن التسعير التعاقدي للمنتجات يغذي نمو سوق منصة سوق المواد الغذائية B2B. من المرجح أن يستمر الاعتماد المتزايد للمنتجات الغذائية المعبأة، وصناعة الخدمات الغذائية المتنامية بسبب ارتفاع الدخل المتاح وزيادة الميل نحو نمط الحياة الحديث، والصناعة المتجددة الخارجية المزدهرة، في دفع نمو سوق منصة سوق المواد الغذائية B2B في السنوات القادمة. لقد أثر جائحة كوفيد-19 بشكل إيجابي على نمو سوق منصة سوق المواد الغذائية B2B حيث يختار المشترون والبائعون الحلول الرقمية للعمليات التجارية.

تجذب شركات التوريد المستهلكين من خلال تقديم خصومات أو عروض خاصة على منتجاتها أو عند شراء كمية معينة. كثيرًا ما يدخل الموردون والشركات في ترتيبات تسعير على مستوى المؤسسة، ويظل سعر السوق لأي عنصر معين ثابتًا. يتم الحفاظ على شفافية الأسعار في قطاع الأغذية B2B أيضًا. وعادة ما تفيد هذه الديناميكية الموردين، الذين قد يتبنون استراتيجية التمييز في الأسعار على أساس قدرة العملاء واستعدادهم للدفع. على سبيل المثال، eFoodChoice.com هي شركة متخصصة في التعاملات التجارية عبر الإنترنت فيما يتعلق بالأغذية، وتساعد بائعي ومشتري المواد الغذائية الدوليين على توسيع قنواتهم التجارية، وتطوير أعمالهم عبر الإنترنت على المستوى الدولي، وزيادة ربحيتهم بشكل مستدام. اعتمادا على كمية البضائع، توفر الشركة نطاق تسعير حصري للمشترين. كما حددت الشركة الحد الأدنى لكميات الطلب (MOQs) لكل فئة من فئات المنتجات. من خلال هذا التسعير التعاقدي للمنتجات، يمكن للمستخدمين النهائيين اختيار العدد الأمثل من السلع بسعر عادل، مما يؤدي إلى زيادة الطلب على سوق منصات سوق المواد الغذائية B2B.


تخصيص البحث ليناسب متطلباتك

يمكننا تحسين وتخصيص التحليل والنطاق الذي لم يتم تلبيته من خلال عروضنا القياسية. ستساعدك هذه المرونة في الحصول على المعلومات الدقيقة اللازمة لتخطيط أعمالك واتخاذ القرارات.

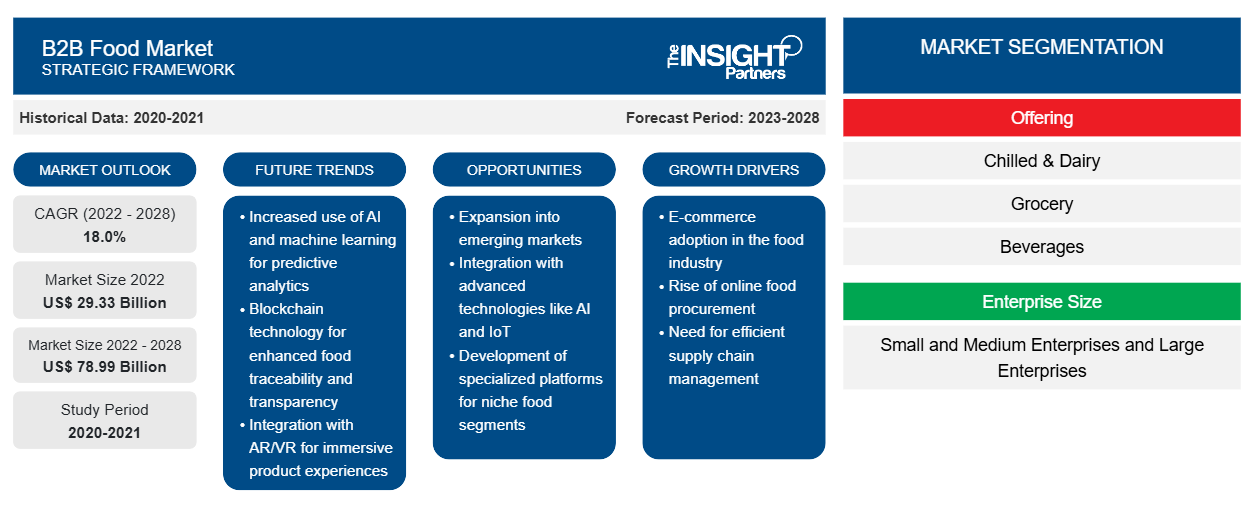
سوق المواد الغذائية B2B:

سوق المواد الغذائية B2B
  • B2B Food Market
    معدل النمو السنوي المركب (2022 - 2028)
    18.0%
  • حجم السوق 2022
    29.33 مليار دولار أمريكي
  • حجم السوق 2028
    78.99 مليار دولار أمريكي

ديناميات السوق

محركات النمو
  • XXXXXXX
  • XXXXXXX
  • XXXXXXX
الاتجاهات المستقبلية
  • XXXXXXX
  • XXXXXXX
  • XXXXXXX
فرص
  • XXXXXXX
  • XXXXXXX
  • XXXXXXX

اللاعبين الرئيسيين

  •  
  • FoodMaven
  • أمازون
  • eFoodChoice.com
  • شركة الفهد للتقنيات
  • Eworldtrade.com
  • تجارة المواد الغذائية
  • يوفودين
  • شركة بود فودز
  • الظهور ريالا

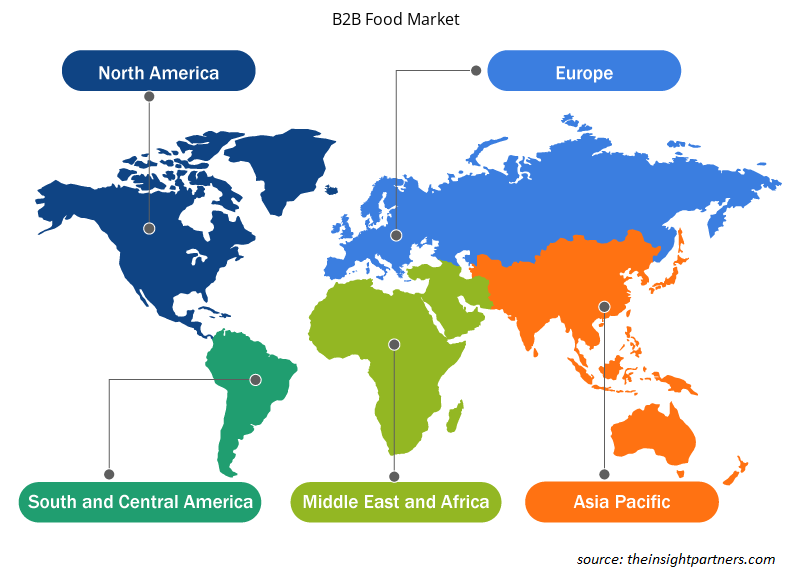
نظرة عامة إقليمية

B2B Food Market
  • أمريكا الشمالية
  • أوروبا
  • آسيا والمحيط الهادئ
  • أمريكا الجنوبية والوسطى
  • الشرق الأوسط وأفريقيا

تجزئة السوق

B2B Food Marketعرض
  • المبردة والألبان
  • خضروات
  • المشروبات
  • آحرون
B2B Food Marketحجم الشركة
  • المؤسسات الصغيرة والمتوسطة والمؤسسات الكبيرة
  • يعرض نموذج PDF بنية المحتوى وطبيعة المعلومات من خلال التحليل النوعي والكمي.


تأثير جائحة كوفيد-19 على سوق منصة سوق المواد الغذائية B2B في منطقة آسيا والمحيط الهادئ

أثرت جائحة كوفيد-19 بشدة على بلدان منطقة آسيا والمحيط الهادئ نظرًا لكثافة سكانها العالية، مما زاد من خطر انتشار فيروس سارس-كوف-2. ووفقا لمنظمة التعاون الاقتصادي والتنمية (OECD)، أثر الوباء في عام 2020 على الاقتصادات الكبرى مثل الصين والهند وأستراليا واليابان، التي تشهد التضخم. أثرت القيود التي فرضتها حكومات دول منطقة آسيا والمحيط الهادئ للسيطرة على انتشار فيروس كورونا (COVID-19) سلبًا على صناعة الأغذية والمشروبات. أدى إغلاق الفنادق والمطاعم وشركات تقديم الطعام إلى انخفاض اعتماد منصات سوق المواد الغذائية B2B في اقتصاد منطقة آسيا والمحيط الهادئ، حيث تم تقييد عمليات التسليم عبر الإنترنت بسبب الإغلاق. ومع ذلك، في الربع الثالث من عام 2020، استأنفت الفنادق والمطاعم ومقدمي الطعام أعمالها، والتي من المتوقع أن تنمو في السنوات المقبلة. بالإضافة إلى ذلك، ستؤدي السياحة المتنامية إلى نمو صناعة الخدمات الغذائية في المنطقة، مما سيزيد من نمو سوق منصة سوق المواد الغذائية B2B خلال الفترة المتوقعة. 


رؤى السوق – سوق منصة سوق المواد الغذائية B2B


زيادة اعتماد منصات التجارة الإلكترونية يعزز الطلب على سوق منصة سوق المواد الغذائية B2B

تُعزى الزيادة في الشراء عبر الإنترنت إلى العدد المتزايد من تجار التجزئة عبر الإنترنت والأسواق الافتراضية في جميع أنحاء العالم. تركز المؤسسات الصغيرة والمتاجر الإلكترونية وشركات التجارة الإلكترونية بشكل متزايد على الحلول المتطورة مثل منصات السوق. تساعد هذه المنصات في الإدارة والتحكم بكفاءة وفعالية عملياتها وعملياتها. علاوة على ذلك، فإن التركيز المتزايد على التحول الرقمي من قِبَل تجار التجزئة، ومحلات البقالة، والشركات الناشئة، فضلا عن الإيرادات المزدهرة من البيع عبر الإنترنت، يعمل على تعزيز توسع سوق منصات سوق المواد الغذائية بين الشركات في الولايات المتحدة. ويعمل تقليص الحواجز التجارية عبر الحدود في مختلف أنحاء العالم على خلق فرص كبيرة للبائعين والشركات، وخاصة في الولايات المتحدة، لتوسيع نطاق منتجاتهم على المستوى الدولي. تتجه شركات التجارة الإلكترونية ومراكز التسوق وغيرها من الشركات، مثل المتاجر الصغيرة والمحلات التجارية، إلى الأسواق عبر الإنترنت لبيع منتجاتها، مما يعزز نمو سوق منصة سوق المواد الغذائية B2B.


رؤى السوق على أساس فئة الأغذية

استنادًا إلى فئة المواد الغذائية، ينقسم سوق منصة سوق المواد الغذائية B2B إلى منتجات مبردة ومنتجات ألبان وبقالة ومشروبات وغيرها. استحوذ قطاع البقالة على الحصة الأكبر من السوق في عام 2021. وفيما يتعلق بفئة المواد الغذائية، يزداد الطلب على محلات البقالة في كل ركن من أركان العالم. ومع ارتفاع عدد السكان، زاد الطلب على ذلك بشكل ملحوظ. إن الطلب المتزايد على الأرز والحبوب والدقيق والنشا والأغذية سريعة التحضير والوجبات الجاهزة للطهي يقود السوق لقطاع البقالة. يؤدي تزايد عدد السكان الشباب وتغير أنماط الحياة إلى خلق طلب كبير على الأطعمة سريعة التحضير والوجبات الجاهزة للطهي. من المتوقع أن يعزز هذا العامل نمو سوق المواد الغذائية B2B في السنوات القادمة. بالإضافة إلى ذلك، فإن الطلب على المواد الغذائية الأخرى مثل المنتجات العضوية والمكونات الغذائية والزيوت والمكسرات والأعشاب والصلصات والتوابل والبذور والمحليات ومنتجات العسل يتزايد أيضًا، مما يؤدي إلى الحصة المهيمنة لهذا القطاع في سوق المواد الغذائية B2B. سوق.


نطاق تقرير سوق المواد الغذائية B2B

سمة التقريرتفاصيل
حجم السوق في عام 202229.33 مليار دولار أمريكي
حجم السوق بحلول عام 202878.99 مليار دولار أمريكي
معدل النمو السنوي المركب العالمي (2022 - 2028)18.0%
البيانات التاريخية2020-2021
فترة التنبؤ2023-2028
القطاعات المغطاةمن خلال تقديم
  • المبردة والألبان
  • خضروات
  • المشروبات
  • آحرون
حسب حجم المؤسسة
  • المؤسسات الصغيرة والمتوسطة والمؤسسات الكبيرة
المناطق والبلدان المشمولةأمريكا الشمالية
  • نحن
  • كندا
  • المكسيك
أوروبا
  • المملكة المتحدة
  • ألمانيا
  • فرنسا
  • روسيا
  • إيطاليا
  • بقية أوروبا
آسيا والمحيط الهادئ
  • الصين
  • الهند
  • اليابان
  • أستراليا
  • بقية منطقة آسيا والمحيط الهادئ
أمريكا الجنوبية والوسطى
  • البرازيل
  • الأرجنتين
  • بقية أمريكا الجنوبية والوسطى
الشرق الأوسط وأفريقيا
  • جنوب أفريقيا
  • المملكة العربية السعودية
  • الإمارات العربية المتحدة
  • بقية دول الشرق الأوسط وأفريقيا
قادة السوق وملفات تعريف الشركة الرئيسية
  •  
  • FoodMaven
  • أمازون
  • eFoodChoice.com
  • شركة الفهد للتقنيات
  • Eworldtrade.com
  • تجارة المواد الغذائية
  • يوفودين
  • شركة بود فودز
  • الظهور ريالا
  • يعرض نموذج PDF بنية المحتوى وطبيعة المعلومات من خلال التحليل النوعي والكمي.


يركز اللاعبون العاملون في سوق منصات سوق المواد الغذائية B2B بشكل أساسي على تطوير منتجات متقدمة وفعالة.

  • في عام 2022، أنهت شركة Cheetah جولة تمويل من السلسلة C بإجمالي 60 مليون دولار أمريكي وأعلنت أنها أبرمت ثلاث صفقات استحواذ مع Palo Alto Foods وEsteson وJoseph Martin Foods.
  • في عام 2022، أطلقت Pod Foods Pod Foods Capital، وهي أداة تمويل تمكن العلامات التجارية الناشئة من الوصول إلى رأس مال سهل وبأسعار معقولة للمساعدة في تنمية علامتها التجارية.

يشمل اللاعبون الرئيسيون الذين تم تحديدهم في سوق منصات سوق المواد الغذائية B2B FoodMaven، وAmazon، وeFoodChoice.com، وCheetah Technologies Inc.، وEworldtrade.com، وFoodsTrade، وUfoodin، وPod Foods Co.، وEmerge Srl، وNotch.

Report Coverage
Report Coverage

Revenue forecast, Company Analysis, Industry landscape, Growth factors, and Trends

Segment Covered
Segment Covered

This text is related
to segments covered.

Regional Scope
Regional Scope

North America, Europe, Asia Pacific, Middle East & Africa, South & Central America

Country Scope
Country Scope

This text is related
to country scope.

Frequently Asked Questions


What will be the global market size of B2B food marketplace platform market by 2028?

The global market size of B2B food marketplace platform market by 2028 will be around US$ 78,988.62 million

Which country is holding the major market share of B2B food marketplace platform market?

The China holds a major market share of B2B food marketplace platform market in 2022

What is the estimated global market size for the B2B food marketplace platform market in 2022?

The estimated global market size for the B2B food marketplace platform market in 2022 is expected to be around US$ 29,326.79 million

What are the driving factors impacting the B2B food marketplace platform market?

The factors such as better communications between SMEs and buyers due to smartphones and tablets and contract-based pricing of products are contributing to the growth of the market

Which countries are registering a high growth rate during the forecast period?

Thailand, Malaysia and Mexico register high growth rate during the forecast period

What is the future trend in the B2B food marketplace platform market?

An increase in online purchasing is attributed to the growing number of online retailers and virtual marketplaces across the world. Small enterprises, c-stores, and e-commerce corporations are increasingly focusing on sophisticated solutions such as marketplace platforms. E-commerce companies, shopping malls, and other businesses, such as small stores and shops, are turning to online marketplaces to sell their products, which is boosting the B2B food marketplace platform industry.

Which is the leading B2B food marketplace platform food category segment in the B2B food marketplace platform market?

Grocery segment is expected to hold a major market share of B2B food marketplace platform market in 2022

Which is the fastest growing regional market?

Asia Pacific is expected to register highest CAGR in the B2B food marketplace platform market during the forecast period (2022-2028)

Which are the key players holding the major market share of B2B food marketplace platform market?

FoodMaven; Amazon; eFoodChoice.com; Cheetah technologies Inc.; and Eworldtrade.com are the key market players expected to hold a major market share of B2B food marketplace platform market in 2022

The List of Companies - B2B Food Marketplace Platform Market

  1. FoodMaven
  2. Amazon
  3. eFoodChoice.com
  4. Cheetah technologies Inc.
  5. Eworldtrade.com
  6. FoodsTrade
  7. Ufoodin
  8. Pod foods Co.
  9. Emerge Srl
  10. Notch

The Insight Partners performs research in 4 major stages: Data Collection & Secondary Research, Primary Research, Data Analysis and Data Triangulation & Final Review.

  1. Data Collection and Secondary Research:

As a market research and consulting firm operating from a decade, we have published and advised several client across the globe. First step for any study will start with an assessment of currently available data and insights from existing reports. Further, historical and current market information is collected from Investor Presentations, Annual Reports, SEC Filings, etc., and other information related to company’s performance and market positioning are gathered from Paid Databases (Factiva, Hoovers, and Reuters) and various other publications available in public domain.

Several associations trade associates, technical forums, institutes, societies and organization are accessed to gain technical as well as market related insights through their publications such as research papers, blogs and press releases related to the studies are referred to get cues about the market. Further, white papers, journals, magazines, and other news articles published in last 3 years are scrutinized and analyzed to understand the current market trends.

  1. Primary Research:

The primarily interview analysis comprise of data obtained from industry participants interview and answers to survey questions gathered by in-house primary team.

For primary research, interviews are conducted with industry experts/CEOs/Marketing Managers/VPs/Subject Matter Experts from both demand and supply side to get a 360-degree view of the market. The primary team conducts several interviews based on the complexity of the markets to understand the various market trends and dynamics which makes research more credible and precise.

A typical research interview fulfils the following functions:

  • Provides first-hand information on the market size, market trends, growth trends, competitive landscape, and outlook
  • Validates and strengthens in-house secondary research findings
  • Develops the analysis team’s expertise and market understanding

Primary research involves email interactions and telephone interviews for each market, category, segment, and sub-segment across geographies. The participants who typically take part in such a process include, but are not limited to:

  • Industry participants: VPs, business development managers, market intelligence managers and national sales managers
  • Outside experts: Valuation experts, research analysts and key opinion leaders specializing in the electronics and semiconductor industry.

Below is the breakup of our primary respondents by company, designation, and region:

Research Methodology

Once we receive the confirmation from primary research sources or primary respondents, we finalize the base year market estimation and forecast the data as per the macroeconomic and microeconomic factors assessed during data collection.

  1. Data Analysis:

Once data is validated through both secondary as well as primary respondents, we finalize the market estimations by hypothesis formulation and factor analysis at regional and country level.

  • Macro-Economic Factor Analysis:

We analyse macroeconomic indicators such the gross domestic product (GDP), increase in the demand for goods and services across industries, technological advancement, regional economic growth, governmental policies, the influence of COVID-19, PEST analysis, and other aspects. This analysis aids in setting benchmarks for various nations/regions and approximating market splits. Additionally, the general trend of the aforementioned components aid in determining the market's development possibilities.

  • Country Level Data:

Various factors that are especially aligned to the country are taken into account to determine the market size for a certain area and country, including the presence of vendors, such as headquarters and offices, the country's GDP, demand patterns, and industry growth. To comprehend the market dynamics for the nation, a number of growth variables, inhibitors, application areas, and current market trends are researched. The aforementioned elements aid in determining the country's overall market's growth potential.

  • Company Profile:

The “Table of Contents” is formulated by listing and analyzing more than 25 - 30 companies operating in the market ecosystem across geographies. However, we profile only 10 companies as a standard practice in our syndicate reports. These 10 companies comprise leading, emerging, and regional players. Nonetheless, our analysis is not restricted to the 10 listed companies, we also analyze other companies present in the market to develop a holistic view and understand the prevailing trends. The “Company Profiles” section in the report covers key facts, business description, products & services, financial information, SWOT analysis, and key developments. The financial information presented is extracted from the annual reports and official documents of the publicly listed companies. Upon collecting the information for the sections of respective companies, we verify them via various primary sources and then compile the data in respective company profiles. The company level information helps us in deriving the base number as well as in forecasting the market size.

  • Developing Base Number:

Aggregation of sales statistics (2020-2022) and macro-economic factor, and other secondary and primary research insights are utilized to arrive at base number and related market shares for 2022. The data gaps are identified in this step and relevant market data is analyzed, collected from paid primary interviews or databases. On finalizing the base year market size, forecasts are developed on the basis of macro-economic, industry and market growth factors and company level analysis.

  1. Data Triangulation and Final Review:

The market findings and base year market size calculations are validated from supply as well as demand side. Demand side validations are based on macro-economic factor analysis and benchmarks for respective regions and countries. In case of supply side validations, revenues of major companies are estimated (in case not available) based on industry benchmark, approximate number of employees, product portfolio, and primary interviews revenues are gathered. Further revenue from target product/service segment is assessed to avoid overshooting of market statistics. In case of heavy deviations between supply and demand side values, all thes steps are repeated to achieve synchronization.

We follow an iterative model, wherein we share our research findings with Subject Matter Experts (SME’s) and Key Opinion Leaders (KOLs) until consensus view of the market is not formulated – this model negates any drastic deviation in the opinions of experts. Only validated and universally acceptable research findings are quoted in our reports.

We have important check points that we use to validate our research findings – which we call – data triangulation, where we validate the information, we generate from secondary sources with primary interviews and then we re-validate with our internal data bases and Subject matter experts. This comprehensive model enables us to deliver high quality, reliable data in shortest possible time.

Your data will never be shared with third parties, however, we may send you information from time to time about our products that may be of interest to you. By submitting your details, you agree to be contacted by us. You may contact us at any time to opt-out.

Trends and growth analysis reports related to Technology, Media and Telecommunications : READ MORE..