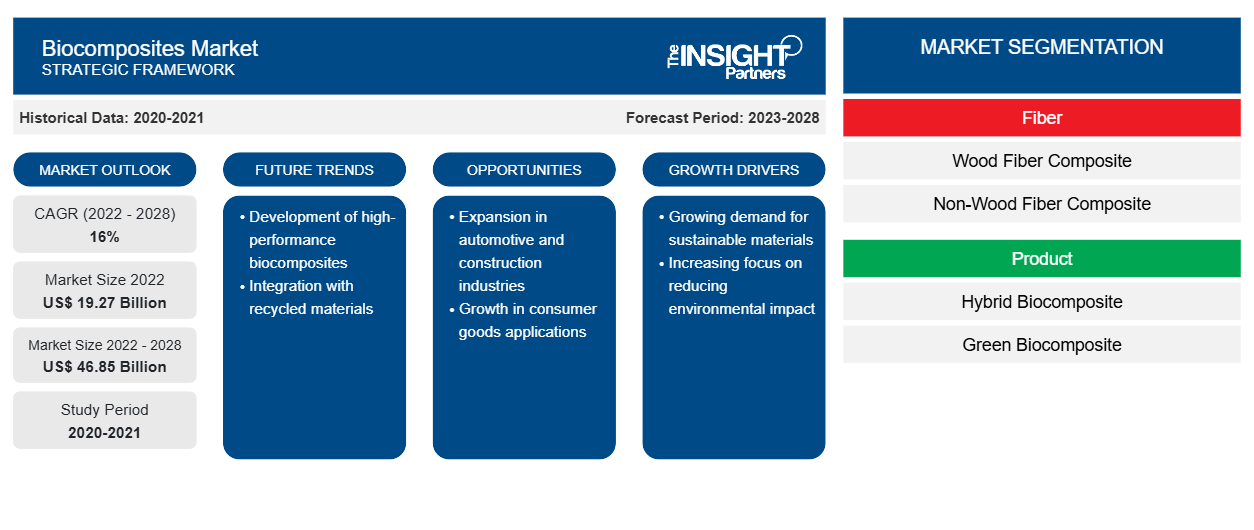
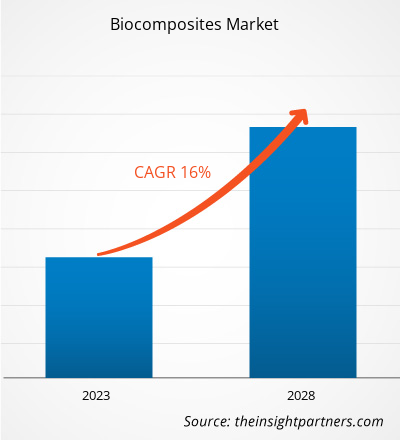
[تقرير بحثي] من المتوقع أن ينمو سوق المركبات الحيوية من 19،268.62 مليون دولار أمريكي في عام 2022 إلى 46،851.39 مليون دولار أمريكي بحلول عام 2028؛ ومن المتوقع أن ينمو بمعدل نمو سنوي مركب قدره 16٪ من عام 2022 إلى عام 2028.
تحليل السوق
المركبات الحيوية هي مواد تتشكل من تقوية الألياف الطبيعية والمصفوفة (الراتنج). يتزايد الاهتمام بالمركبات الحيوية بسرعة بين الصناعات ذات الاستخدام النهائي كتطبيقات في الأبحاث الأساسية والتعبئة والتغليف والبناء والتطبيقات العسكرية والفضاء والعربات السكك الحديدية والسيارات بسبب العديد من الفوائد المحتملة مثل سهولة التوافر والقوة النوعية العالية وخفة الوزن وقابلية التحلل البيولوجي وقابلية إعادة التدوير ورخص التكلفة وقابلية التجديد . تُستخدم المركبات الحيوية على نطاق واسع في صناعة السيارات لتصنيع الألواح الداخلية. نظرًا لأن المركبات الحيوية صديقة للبيئة ، فإنها تحل محل المركبات البوليمرية في تطبيقات مختلفة بسعر مرتفع.
محركات النمو والتحديات
لقد ساعد الاستخدام المتزايد لمواد البناء المستدامة في نمو سوق المركبات الحيوية . تعد صناعة البناء واحدة من أكثر القطاعات الناشئة ثباتًا في التحضر السريع نظرًا للنمو السكاني في المناطق الحضرية. هذا التحضر يجعل الصناعة المستهلك الأكثر إثارة للدهشة للمواد، ومعظمها من الموارد غير المتجددة. وفقًا للتقرير الصادر عن التحالف العالمي للبناء والتشييد، فإن قطاع البناء هو أحد أكثر القطاعات ضررًا بالبيئة. وفقًا للدراسة، فإن قطاع البناء مسؤول عن 39٪ من انبعاثات ثاني أكسيد الكربون المنتشرة في البيئة، و36٪ من استهلاك الطاقة العالمية و50٪ من استخراج المواد الخام. الانبعاثات مسؤولة بشكل أساسي عن تغير المناخ وزيادة درجة حرارة الأرض. مواد البناء التقليدية كثيفة الموارد والطاقة. وبالتالي، هناك قلق متزايد ووعي بشأن المخاطر الناجمة عن مواد البناء التقليدية التي لها تأثير اجتماعي وبيئي. من أجل معالجة هذه القضايا، يتم تطوير مواد وتقنيات جديدة في صناعة البناء. المركبات الحيوية هي مواد بناء مستدامة تساعد في القضاء على النفايات غير المتجددة، وتقليل استخدام المواد الخام، وخفض استهلاك الوقود الأحفوري. يتزايد الاهتمام باستخدام المركبات الحيوية في صناعة البناء على مستوى العالم، حيث تصنع هذه المواد من مصادر متجددة وقابلة لإعادة التدوير وقابلة للتحلل البيولوجي ولها مجموعة واسعة من الاستخدامات كعناصر بناء هيكلية وغير هيكلية. ومع ذلك، هناك عيوب قليلة للمركبات المصنوعة من الألياف الطبيعية مثل ضعف الترابط بين الألياف والمصفوفة، وضعف قابلية البلل ، وامتصاص الماء. تؤثر هذه التحديات على قوة وأداء المنتجات النهائية. تميل الطبيعة المحبة للماء للمركبات الحيوية إلى امتصاص الماء من البيئة المباشرة مما يتسبب في تضخم المركب. ومن المتوقع أن تعيق كل هذه العوامل نمو سوق المركبات الحيوية خلال فترة التنبؤ.
قم بتخصيص هذا التقرير ليناسب متطلباتك
ستحصل على تخصيص لأي تقرير - مجانًا - بما في ذلك أجزاء من هذا التقرير، أو تحليل على مستوى الدولة، وحزمة بيانات Excel، بالإضافة إلى الاستفادة من العروض والخصومات الرائعة للشركات الناشئة والجامعات
- احصل على أهم اتجاهات السوق الرئيسية لهذا التقرير.ستتضمن هذه العينة المجانية تحليلاً للبيانات، بدءًا من اتجاهات السوق وحتى التقديرات والتوقعات.
تقسيم التقرير ونطاقه
" تحليل سوق المركبات الحيوية العالمية حتى عام 2028" هو دراسة متخصصة ومتعمقة مع التركيز الرئيسي على اتجاهات سوق المركبات الحيوية العالمية وفرص النمو. يهدف التقرير إلى تقديم نظرة عامة على سوق المركبات الحيوية العالمية مع تقسيم السوق التفصيلي حسب الألياف والمنتج والاستخدام النهائي والجغرافيا. شهد سوق المركبات الحيوية العالمية نموًا مرتفعًا خلال الماضي القريب ومن المتوقع أن يستمر هذا الاتجاه خلال فترة التنبؤ. يقدم التقرير إحصائيات رئيسية عن استهلاك المركبات الحيوية في جميع أنحاء العالم جنبًا إلى جنب مع الطلب عليها في المناطق والبلدان الرئيسية. بالإضافة إلى ذلك، يقدم التقرير تقييمًا نوعيًا للعوامل المختلفة التي تؤثر على أداء سوق المركبات الحيوية في المناطق والبلدان الرئيسية. يتضمن التقرير أيضًا تحليلًا شاملاً للاعبين الرائدين في سوق المركبات الحيوية وتطوراتهم الاستراتيجية الرئيسية. يتم أيضًا تضمين العديد من التحليلات حول ديناميكيات السوق للمساعدة في تحديد العوامل الدافعة الرئيسية واتجاهات السوق وفرص سوق المركبات الحيوية المربحة التي من شأنها بدورها أن تساعد في تحديد جيوب الإيرادات الرئيسية.
علاوة على ذلك، يوفر تحليل النظام البيئي وتحليل القوى الخمس لبورتر رؤية بزاوية 360 درجة لسوق المركبات الحيوية العالمية، مما يساعد على فهم سلسلة التوريد بأكملها والعوامل المختلفة التي تؤثر على نمو السوق.
التحليل القطاعي
يتم تقسيم سوق المركبات الحيوية العالمية على أساس الألياف والمنتج والاستخدام النهائي. بناءً على الألياف، يتم تقسيم سوق المركبات الحيوية إلى مركبات ألياف خشبية ومركبات ألياف غير خشبية . بناءً على المنتج، يتم تصنيف السوق على أنها مركبات حيوية هجينة ومركبات حيوية خضراء. على أساس الاستخدام النهائي، يتم تقسيم السوق إلى مركبات البناء والتشييد والسيارات والسلع الاستهلاكية وغيرها.
استنادًا إلى الألياف، استحوذ قطاع مركبات ألياف الخشب على حصة كبيرة في سوق المركبات الحيوية. العيب الرئيسي لمركبات ألياف الخشب هو حساسيتها للرطوبة، ومع ذلك، مع زيادة البحث والتطوير، ينتج المصنعون مكونات ألياف الخشب ذات مقاومة أعلى للرطوبة وصلابة أكبر ومعامل أقل للتمدد الحراري. على أساس المنتج المركب الهجين، قاد سوق المركبات الحيوية بأكبر حصة في السوق. بناءً على الاستخدام النهائي، يهيمن قطاع البناء والتشييد على سوق المركبات الحيوية. تُستخدم المركبات الحيوية في البناء للتأطير والجدران والألواح الجدارية وإطارات النوافذ والأبواب والأرضيات والألواح الزخرفية وجدران الحجرات وألواح السقف. يقلل استخدام المركبات الحيوية لمكونات البناء المؤقتة والقابلة للتعديل من نفايات مكبات النفايات عند تعديل التصميمات الداخلية داخل الهيكل.
التحليل الإقليمي
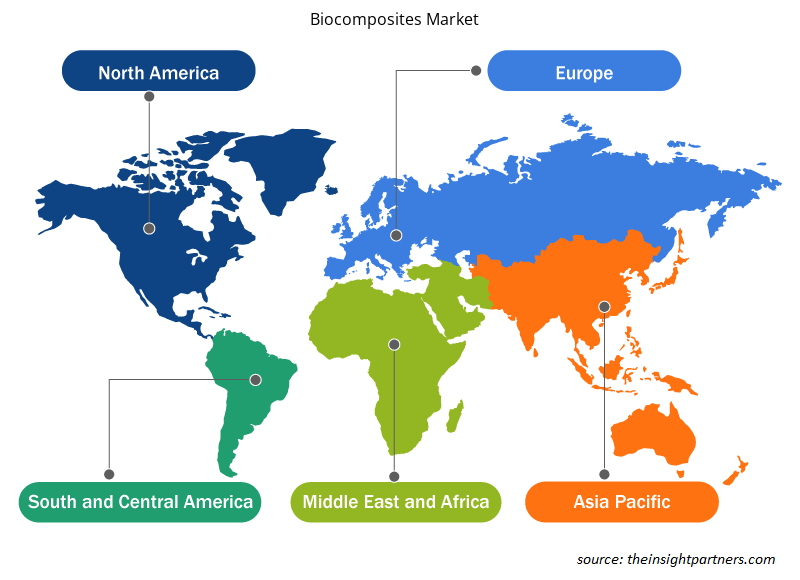
يقدم التقرير نظرة عامة مفصلة على سوق المركبات الحيوية العالمية فيما يتعلق بخمس مناطق رئيسية، وهي أمريكا الشمالية وأوروبا وآسيا والمحيط الهادئ (APAC) والشرق الأوسط وأفريقيا (MEA) وأمريكا الجنوبية والوسطى. استحوذت منطقة آسيا والمحيط الهادئ على حصة كبيرة من السوق وقُدرت قيمتها بأكثر من 9300 مليون دولار أمريكي في عام 2022. تضم منطقة آسيا والمحيط الهادئ العديد من الاقتصادات النامية والمتقدمة مثل الصين والهند واليابان وكوريا الجنوبية وأستراليا. العامل الحاسم الذي يساهم في نموها هو الطلب المتزايد من البناء والتشييد والنقل لصناعات الاستخدام النهائي. يُلاحظ الطلب المرتفع على المركبات الحيوية في المقام الأول في الصين واليابان والهند وكوريا الجنوبية. كما من المتوقع أن يؤدي زيادة الاستثمار الأجنبي المباشر (FDI) في قطاعي النقل والبنية التحتية إلى دفع الطلب على المركبات الحيوية خلال السنوات القليلة المقبلة. ومن المتوقع أيضًا أن تشهد أوروبا نموًا كبيرًا تقدر قيمته بحوالي 11000 مليون دولار أمريكي في عام 2028، وذلك بسبب الإنفاق الحكومي المتزايد على بناء البنية التحتية. علاوة على ذلك، في أمريكا الشمالية، كان هناك استخدام واسع النطاق للمركبات الحيوية في البناء السكني والتجاري والمنتجات الاستهلاكية وقطاع السيارات. وقد أدى هذا إلى خلق فرص مربحة في سوق المركبات الحيوية. ومن المتوقع أن ينمو سوق المركبات الحيوية في أمريكا الشمالية بمعدل نمو سنوي مركب يبلغ 15.0% خلال الفترة المتوقعة.
تطورات الصناعة والفرص المستقبلية
وُجِد أن الشراكات والاستحواذات وإطلاق المنتجات الجديدة هي الاستراتيجيات الرئيسية التي يتبناها اللاعبون العاملون في سوق المركبات الحيوية العالمية.
- في مايو 2022، خططت شركة أركيما لإطلاق حلها الجديد للمركبات القابلة لإعادة التدوير والأكثر كفاءة.
- في مارس 2021، أعلنت شركة Fiberon عن إطلاق الكسوة المركبة من الخشب البري، والتي توفر الجمال والدفء الذي لا مثيل له للخشب جنبًا إلى جنب مع متانة المواد عالية الأداء ومنخفضة الصيانة.
رؤى إقليمية حول سوق المركبات الحيوية
لقد قام المحللون في Insight Partners بشرح الاتجاهات والعوامل الإقليمية المؤثرة على سوق المركبات الحيوية طوال فترة التوقعات بشكل شامل. يناقش هذا القسم أيضًا قطاعات سوق المركبات الحيوية والجغرافيا في جميع أنحاء أمريكا الشمالية وأوروبا ومنطقة آسيا والمحيط الهادئ والشرق الأوسط وأفريقيا وأمريكا الجنوبية والوسطى.

- احصل على البيانات الإقليمية المحددة لسوق المركبات الحيوية
نطاق تقرير سوق المركبات الحيوية
| سمة التقرير | تفاصيل |
|---|---|
| حجم السوق في عام 2022 | 19.27 مليار دولار أمريكي |
| حجم السوق بحلول عام 2028 | 46.85 مليار دولار أمريكي |
| معدل النمو السنوي المركب العالمي (2022 - 2028) | 16% |
| البيانات التاريخية | 2020-2021 |
| فترة التنبؤ | 2023-2028 |
| القطاعات المغطاة | بالألياف
|
| المناطق والدول المغطاة | أمريكا الشمالية
|
| قادة السوق وملفات تعريف الشركات الرئيسية |
|
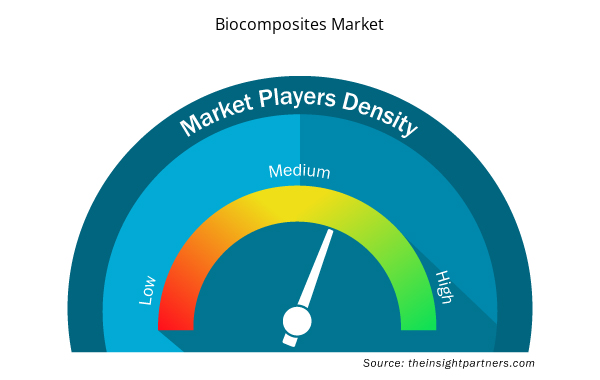
كثافة اللاعبين في السوق: فهم تأثيرها على ديناميكيات الأعمال
يشهد سوق المركبات الحيوية نموًا سريعًا، مدفوعًا بالطلب المتزايد من المستخدم النهائي بسبب عوامل مثل تفضيلات المستهلك المتطورة والتقدم التكنولوجي والوعي المتزايد بفوائد المنتج. ومع ارتفاع الطلب، تعمل الشركات على توسيع عروضها والابتكار لتلبية احتياجات المستهلكين والاستفادة من الاتجاهات الناشئة، مما يؤدي إلى زيادة نمو السوق.
تشير كثافة اللاعبين في السوق إلى توزيع الشركات أو المؤسسات العاملة في سوق أو صناعة معينة. وهي تشير إلى عدد المنافسين (اللاعبين في السوق) الموجودين في مساحة سوق معينة نسبة إلى حجمها أو قيمتها السوقية الإجمالية.
الشركات الرئيسية العاملة في سوق المركبات الحيوية هي:
- تحويل النص إلى كلام
- لينجروف
- شركة بي كومب المحدودة
- اتحاد المحاسبين القانونيين المعتمدين
- تقنيات فليكس فورم
إخلاء المسؤولية : الشركات المذكورة أعلاه ليست مرتبة بأي ترتيب معين.

- احصل على نظرة عامة على أهم اللاعبين الرئيسيين في سوق المركبات الحيوية
تأثير كوفيد/ تأثير السيناريو الجيوسياسي/ تأثير الركود
أثرت عمليات الإغلاق والقيود المفروضة على السفر وإغلاق الشركات بسبب جائحة كوفيد-19 سلبًا على الاقتصادات والصناعات في مختلف البلدان في أمريكا الشمالية وأوروبا ومنطقة آسيا والمحيط الهادئ وأمريكا الجنوبية والوسطى والشرق الأوسط وأفريقيا. وقد أزعجت الأزمة سلاسل التوريد العالمية وأنشطة التصنيع وجداول التسليم ومبيعات المنتجات الأساسية وغير الأساسية. وأعلنت شركات مختلفة عن تأخيرات محتملة في تسليم المنتجات وانخفاض في مبيعات منتجاتها المستقبلية في عام 2020. وعلاوة على ذلك، أجبر حظر السفر الدولي الذي فرضته حكومات مختلفة في أوروبا ومنطقة آسيا والمحيط الهادئ وأمريكا الشمالية العديد من الشركات على وقف خطط التعاون والشراكة. كل هذه العوامل أعاقت صناعة المواد الكيميائية والمواد في عام 2020 وأوائل عام 2021، وبالتالي قيدت نمو العديد من الأسواق المتعلقة بهذه الصناعة، بما في ذلك سوق المركبات الحيوية.
قبل تفشي فيروس كورونا المستجد، كان سوق المركبات الحيوية مدفوعًا بشكل أساسي بالطلب المتزايد من صناعات السيارات والبناء والتشييد. ومع ذلك، في عام 2020، اضطرت العديد من الصناعات إلى إبطاء عملياتها بسبب الاضطرابات في سلاسل القيمة الناجمة عن إغلاق الحدود الوطنية والدولية. لقد تسبب جائحة كوفيد-19 في تعطيل سلسلة توريد المواد الخام الرئيسية وإرباك عمليات التصنيع بسبب القيود التي فرضتها السلطات الحكومية في بلدان مختلفة. ومع ذلك، أحيت الاقتصادات عملياتها. واستؤنفت مشاريع البناء المؤجلة سابقًا، مما أتاح الفرصة للاعبين في سوق المركبات الحيوية لاستعادة الوضع الطبيعي.
المشهد التنافسي والشركات الرئيسية
تشمل بعض اللاعبين الرئيسيين العاملين في سوق المركبات الحيوية شركة TTS؛ وLingrove؛ وBcomp Ltd؛ وUPM؛ وFlexform Technologies؛ وTecnaro GmbH؛ وFiberon؛ وArkema؛ وTrex Company, Inc.؛ وHempFlax Group BV وغيرها.
- التحليل التاريخي (سنتان)، السنة الأساسية، التوقعات (7 سنوات) مع معدل النمو السنوي المركب
- تحليل PEST و SWOT
- حجم السوق والقيمة / الحجم - عالميًا وإقليميًا وقطريًا
- الصناعة والمنافسة
- مجموعة بيانات Excel


Report Coverage
Revenue forecast, Company Analysis, Industry landscape, Growth factors, and Trends

Segment Covered
This text is related
to segments covered.

Regional Scope
North America, Europe, Asia Pacific, Middle East & Africa, South & Central America

Country Scope
This text is related
to country scope.
الأسئلة الشائعة
The green biocomposite is expected to be the fastest-growing segment during the forecast period. Green biocomposites are typically made by combining a biodegradable polymeric matrix with eco-friendly and renewable fibers. Increasing concern for the environment is driving the growth of green biocomposites during the forecast period.
During the forecast period, the automotive segment is expected to be the fastest-growing segment. Many automotive applications use biocomposites to achieve objectives, including light vehicle weight, fuel economy, low battery weight, low CO2 emissions, and high accident safety. Increasing demand for lightweight and fuel-efficient vehicles is propelling the demand for biocomposites during the forecast period.
The key driver fueling the biocomposites market's expansion is the population's increased awareness of the necessity for eco-friendly materials to protect the environment from degradation. Another aspect driving the biocomposites market's expansion is the growing use of biocomposites to lighten vehicles and increase safety. Other reasons that contributed to the market's growth include the introduction of strict government restrictions and safer usage of biocomposites than glass fiber.
In 2021, Asia-Pacific accounted for the largest share of the global biocomposites market. Due to growing environmental concerns, strict government restrictions, and a sense of social responsibility, the commercial and residential construction sector in the Asia Pacific is booming. Increased use of biocomposites in the building and construction sector led to the dominance of the Asia Pacific region in the global biocomposites market.
In 2021, the wood fiber composite segment held the largest market share. Composites made of wood fiber cost less than non-wood composites. These are used in a variety of applications, including residential, commercial, swimming pool, observation decks, and jetties. These are a few of the factors that led to the dominance of wood fiber composites in 2021.
The major players operating in the biocomposites market are TTS, Lingrove, Bcomp Ltd., UPM, Flexform Technologies, Tecnaro GMBH, Green Bay Decking, Fiberon LLC, Arkema, and Procotex.
The List of Companies - Biocomposites Market
- TTS
- Lingrove
- Bcomp Ltd
- UPM
- Flexform Technologies
- Tecnaro GMBH
- Green Bay Decking
- Fiberon LLC
- Arkema
- Procotex
The Insight Partners performs research in 4 major stages: Data Collection & Secondary Research, Primary Research, Data Analysis and Data Triangulation & Final Review.
- Data Collection and Secondary Research:
As a market research and consulting firm operating from a decade, we have published and advised several client across the globe. First step for any study will start with an assessment of currently available data and insights from existing reports. Further, historical and current market information is collected from Investor Presentations, Annual Reports, SEC Filings, etc., and other information related to company’s performance and market positioning are gathered from Paid Databases (Factiva, Hoovers, and Reuters) and various other publications available in public domain.
Several associations trade associates, technical forums, institutes, societies and organization are accessed to gain technical as well as market related insights through their publications such as research papers, blogs and press releases related to the studies are referred to get cues about the market. Further, white papers, journals, magazines, and other news articles published in last 3 years are scrutinized and analyzed to understand the current market trends.
- Primary Research:
The primarily interview analysis comprise of data obtained from industry participants interview and answers to survey questions gathered by in-house primary team.
For primary research, interviews are conducted with industry experts/CEOs/Marketing Managers/VPs/Subject Matter Experts from both demand and supply side to get a 360-degree view of the market. The primary team conducts several interviews based on the complexity of the markets to understand the various market trends and dynamics which makes research more credible and precise.
A typical research interview fulfils the following functions:
- Provides first-hand information on the market size, market trends, growth trends, competitive landscape, and outlook
- Validates and strengthens in-house secondary research findings
- Develops the analysis team’s expertise and market understanding
Primary research involves email interactions and telephone interviews for each market, category, segment, and sub-segment across geographies. The participants who typically take part in such a process include, but are not limited to:
- Industry participants: VPs, business development managers, market intelligence managers and national sales managers
- Outside experts: Valuation experts, research analysts and key opinion leaders specializing in the electronics and semiconductor industry.
Below is the breakup of our primary respondents by company, designation, and region:

Once we receive the confirmation from primary research sources or primary respondents, we finalize the base year market estimation and forecast the data as per the macroeconomic and microeconomic factors assessed during data collection.
- Data Analysis:
Once data is validated through both secondary as well as primary respondents, we finalize the market estimations by hypothesis formulation and factor analysis at regional and country level.
- Macro-Economic Factor Analysis:
We analyse macroeconomic indicators such the gross domestic product (GDP), increase in the demand for goods and services across industries, technological advancement, regional economic growth, governmental policies, the influence of COVID-19, PEST analysis, and other aspects. This analysis aids in setting benchmarks for various nations/regions and approximating market splits. Additionally, the general trend of the aforementioned components aid in determining the market's development possibilities.
- Country Level Data:
Various factors that are especially aligned to the country are taken into account to determine the market size for a certain area and country, including the presence of vendors, such as headquarters and offices, the country's GDP, demand patterns, and industry growth. To comprehend the market dynamics for the nation, a number of growth variables, inhibitors, application areas, and current market trends are researched. The aforementioned elements aid in determining the country's overall market's growth potential.
- Company Profile:
The “Table of Contents” is formulated by listing and analyzing more than 25 - 30 companies operating in the market ecosystem across geographies. However, we profile only 10 companies as a standard practice in our syndicate reports. These 10 companies comprise leading, emerging, and regional players. Nonetheless, our analysis is not restricted to the 10 listed companies, we also analyze other companies present in the market to develop a holistic view and understand the prevailing trends. The “Company Profiles” section in the report covers key facts, business description, products & services, financial information, SWOT analysis, and key developments. The financial information presented is extracted from the annual reports and official documents of the publicly listed companies. Upon collecting the information for the sections of respective companies, we verify them via various primary sources and then compile the data in respective company profiles. The company level information helps us in deriving the base number as well as in forecasting the market size.
- Developing Base Number:
Aggregation of sales statistics (2020-2022) and macro-economic factor, and other secondary and primary research insights are utilized to arrive at base number and related market shares for 2022. The data gaps are identified in this step and relevant market data is analyzed, collected from paid primary interviews or databases. On finalizing the base year market size, forecasts are developed on the basis of macro-economic, industry and market growth factors and company level analysis.
- Data Triangulation and Final Review:
The market findings and base year market size calculations are validated from supply as well as demand side. Demand side validations are based on macro-economic factor analysis and benchmarks for respective regions and countries. In case of supply side validations, revenues of major companies are estimated (in case not available) based on industry benchmark, approximate number of employees, product portfolio, and primary interviews revenues are gathered. Further revenue from target product/service segment is assessed to avoid overshooting of market statistics. In case of heavy deviations between supply and demand side values, all thes steps are repeated to achieve synchronization.
We follow an iterative model, wherein we share our research findings with Subject Matter Experts (SME’s) and Key Opinion Leaders (KOLs) until consensus view of the market is not formulated – this model negates any drastic deviation in the opinions of experts. Only validated and universally acceptable research findings are quoted in our reports.
We have important check points that we use to validate our research findings – which we call – data triangulation, where we validate the information, we generate from secondary sources with primary interviews and then we re-validate with our internal data bases and Subject matter experts. This comprehensive model enables us to deliver high quality, reliable data in shortest possible time.


 احصل على عينة مجانية لهذا التقرير