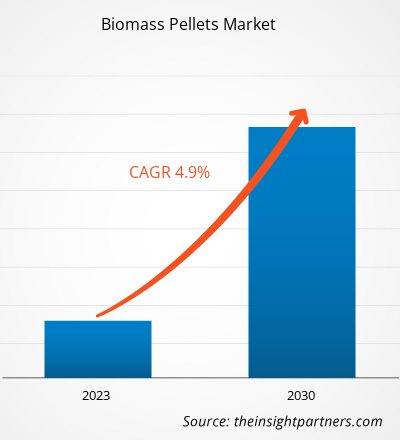
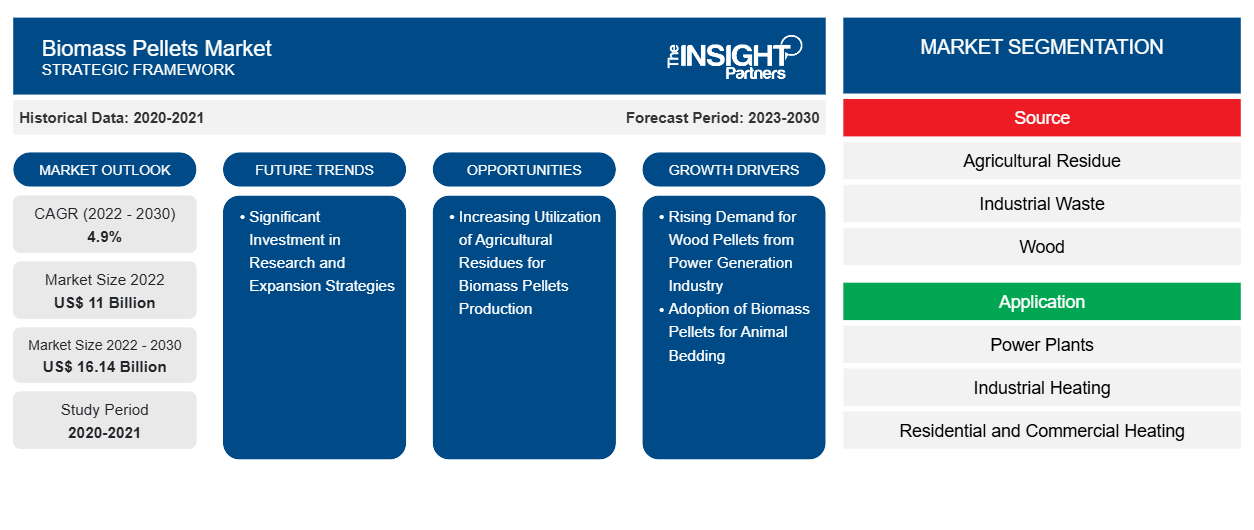
[تقرير بحثي] تم تقييم حجم سوق حبيبات الكتلة الحيوية بـ 11،001.59 مليون دولار أمريكي في عام 2022 ومن المتوقع أن يصل إلى 16،137.89 مليون دولار أمريكي بحلول عام 2030؛ ومن المتوقع أن يسجل معدل نمو سنوي مركب بنسبة 4.9٪ من عام 2022 إلى عام 2030.
رؤى السوق ووجهة نظر المحلل:
حبيبات الكتلة الحيوية هي كتلة حيوية عالية الكثافة ومعالجة مضغوطة في شكل أسطواني صغير. وهي مشتقة من مواد عضوية، مثل المخلفات الزراعية ونفايات الخشب ورقائق الخشب ونشارة الخشب ومخلفات الغابات. تُستخدم حبيبات الكتلة الحيوية في توليد الطاقة وكذلك تطبيقات التدفئة في القطاعات السكنية والتجارية والصناعية. ولديها العديد من المزايا مقارنة بالكتلة الحيوية غير المعالجة، مثل الخصائص الموحدة ومحتوى الطاقة العالي وإمكانية التخزين وسهولة النقل. تُستخدم حبيبات الكتلة الحيوية، أي حبيبات الخشب، على نطاق واسع في مواقد ومراجل الحبيبات السكنية. إن جهود الحكومة للحد من انبعاثات الغازات المسببة للانحباس الحراري وتعزيز استخدام حبيبات الكتلة الحيوية تدفع نمو سوق حبيبات الكتلة الحيوية .
محركات النمو والتحديات:
مع التركيز المتزايد على الاستدامة، زاد الطلب على حبيبات الكتلة الحيوية مثل حبيبات الخشب بشكل كبير. يمكن استخدام حبيبات الخشب لإنتاج الكهرباء كبديل لمواد تغذية الفحم. علاوة على ذلك، فإن حبيبات الكتلة الحيوية ذات شكل موحد، وتتمتع بكثافة عالية، ويمكن استخدامها للنقل والتخزين. نما الطلب على حبيبات الخشب بشكل كبير لتطبيقات توليد الطاقة. في أوروبا وأمريكا الشمالية، وكذلك في الدول الآسيوية مثل الصين واليابان وكوريا الجنوبية، تُستخدم حبيبات الخشب في المقام الأول في الحرق المشترك في محطات الطاقة التي تعمل بالفحم. هناك ارتفاع في استخدام المواد البديلة للفحم في محطات الطاقة واسعة النطاق في جميع أنحاء العالم. في عام 2021، فرضت وزارة الطاقة الهندية استخدام حبيبات الكتلة الحيوية بنسبة 5٪ على الأقل في خليط الوقود مع الفحم في جميع محطات الطاقة التي تعمل بالفحم. مثل هذه الأوامر تدفع نمو سوق حبيبات الكتلة الحيوية في الهند. علاوة على ذلك، قامت شركات الطاقة واسعة النطاق في العديد من الدول الأوروبية مثل هولندا وبلجيكا بتوريد حبيبات الكتلة الحيوية من الولايات المتحدة وروسيا وكندا، وفقًا لوزارة الزراعة الأمريكية. وبالتالي، فإن الطلب المتزايد على حبيبات الخشب من صناعة توليد الطاقة هو الذي يحرك سوق حبيبات الكتلة الحيوية. حبيبات الكتلة الحيوية مشتقة من مواد عضوية مثل الخشب والمخلفات الزراعية والنفايات الصناعية. تعتبر العديد من البلدان حبيبات الكتلة الحيوية مصدرًا مستدامًا للوقود؛ ومع ذلك، هناك العديد من المخاوف البيئية المتعلقة بحبيبات الكتلة الحيوية. يؤدي احتراق حبيبات الكتلة الحيوية إلى إطلاق الملوثات في الهواء، بما في ذلك الجسيمات وأكاسيد النيتروجين والمركبات العضوية المتطايرة. علاوة على ذلك، يتضمن إنتاج الكتلة الحيوية كمية كبيرة من استهلاك المياه للمعالجة. وبالتالي، فإن المخاوف البيئية المتعلقة بحبيبات الكتلة الحيوية تعيق نمو سوق حبيبات الكتلة الحيوية.
قم بتخصيص هذا التقرير ليناسب متطلباتك
ستحصل على تخصيص لأي تقرير - مجانًا - بما في ذلك أجزاء من هذا التقرير، أو تحليل على مستوى الدولة، وحزمة بيانات Excel، بالإضافة إلى الاستفادة من العروض والخصومات الرائعة للشركات الناشئة والجامعات
- احصل على أهم اتجاهات السوق الرئيسية لهذا التقرير.ستتضمن هذه العينة المجانية تحليلاً للبيانات، بدءًا من اتجاهات السوق وحتى التقديرات والتوقعات.
تقسيم التقرير ونطاقه:
يتم تقسيم سوق حبيبات الكتلة الحيوية العالمية على أساس المصدر والتطبيق والجغرافيا. بناءً على المصدر، يتم تقسيم سوق حبيبات الكتلة الحيوية إلى مخلفات زراعية ونفايات صناعية وخشب وغيرها. بناءً على التطبيق، يتم تقسيم سوق حبيبات الكتلة الحيوية إلى محطات الطاقة والتدفئة الصناعية والتدفئة السكنية والتجارية وغيرها. من الناحية الجغرافية، يتم تقسيم سوق حبيبات الكتلة الحيوية إلى أمريكا الشمالية (الولايات المتحدة وكندا والمكسيك) وأوروبا (ألمانيا وفرنسا وإيطاليا والمملكة المتحدة وروسيا وبقية أوروبا) وآسيا والمحيط الهادئ (أستراليا والصين واليابان والهند وكوريا الجنوبية وبقية آسيا والمحيط الهادئ) والشرق الأوسط وأفريقيا (جنوب أفريقيا والمملكة العربية السعودية والإمارات العربية المتحدة وبقية الشرق الأوسط وأفريقيا) وأمريكا الجنوبية والوسطى (البرازيل والأرجنتين وبقية أمريكا الجنوبية والوسطى)UAE, and Rest of Middle East & Africa), and South & Central America (Brazil, Argentina, and Rest of South & Central America)
التحليل القطاعي:
بناءً على المصدر، يتم تقسيم سوق حبيبات الكتلة الحيوية إلى مخلفات زراعية ونفايات صناعية وخشب وغيرها. احتل قطاع الخشب الحصة الأكبر في سوق حبيبات الكتلة الحيوية ومن المتوقع أن يسجل نموًا كبيرًا خلال فترة التنبؤ. يتم تصنيع حبيبات الكتلة الحيوية باستخدام نفايات الخشب مثل نشارة الخشب ورقائق الخشب ونشارة الخشب واللحاء والمواد المتبقية الأخرى الناتجة عن أعمال النجارة ومصانع الأخشاب ومعالجة الأخشاب. يتم جمع نفايات الخشب ومعالجتها وتجفيفها وتحويلها إلى حبيبات. تُستخدم حبيبات الكتلة الحيوية الخشبية على نطاق واسع في تطبيقات التدفئة السكنية والأفران الصناعية ومحطات الطاقة.
التحليل الإقليمي:
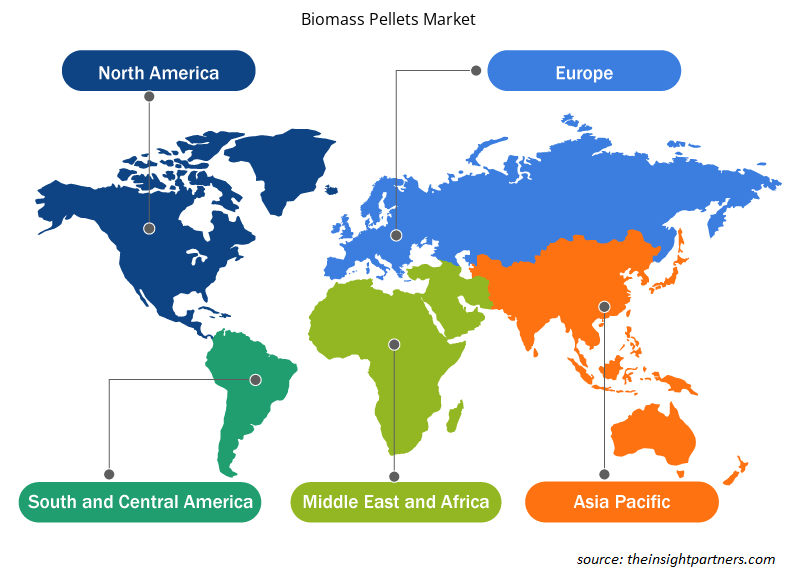
بناءً على الجغرافيا، يتم تقسيم سوق حبيبات الكتلة الحيوية إلى خمس مناطق رئيسية - أمريكا الشمالية وأوروبا وآسيا والمحيط الهادئ وأمريكا الجنوبية والوسطى والشرق الأوسط وأفريقيا. هيمنت أوروبا على سوق حبيبات الكتلة الحيوية العالمية، والتي بلغت قيمتها حوالي 6478 مليون دولار أمريكي في عام 2022. تعد منطقة آسيا والمحيط الهادئ ثاني أكبر مساهم، حيث سجلت أكثر من 30٪ من حصة سوق حبيبات الكتلة الحيوية العالمية في نفس العام. ومن المتوقع أن تسجل أمريكا الشمالية معدل نمو سنوي مركب يزيد عن 4.5٪ خلال فترة التوقعات. في أمريكا الشمالية، يتم دفع سوق حبيبات الكتلة الحيوية بشكل كبير من خلال القدرة التنافسية الإقليمية لتكلفة حبيبات الكتلة الحيوية مقارنة بزيت التدفئة السكني والبروبان. اكتسب إنتاج حبيبات الخشب في أمريكا الشمالية قوة دفع على مدار السنوات القليلة الماضية بسبب الطلب المتزايد من الأسواق الخارجية. وفقًا لوزارة الزراعة الأمريكية، تقوم الولايات المتحدة وكندا بتوريد حبيبات الخشب لمحطات الطاقة في هولندا وبلجيكا. وقد دفع ارتفاع الطلب المحلي على حبيبات الكتلة الحيوية في المنطقة الشركات المصنعة إلى توسيع قدراتها الإنتاجية. ففي عام 2023، استثمرت شركة Grand River Pellets (كندا) 30 مليون دولار أمريكي لتوسيع قدرة إنتاج حبيبات الكتلة الحيوية من 140 ألف طن متري إلى 220 ألف طن متري سنويًا. وكل هذه العوامل تدفع نمو سوق حبيبات الكتلة الحيوية في أمريكا الشمالية.
تطورات الصناعة والفرص المستقبلية:
فيما يلي قائمة بالمبادرات المختلفة التي اتخذها اللاعبون الرئيسيون العاملون في سوق حبيبات الكتلة الحيوية:
- في سبتمبر 2022، افتتحت شركة Enviva Inc منشأة تصنيع حبيبات الخشب التي تم بناؤها حديثًا في مقاطعة جورج بولاية ميسيسيبي (الولايات المتحدة). بدأ المصنع أنشطة الإنتاج في بداية عام 2022 للوصول إلى طاقة إنتاجية سنوية مسموح بها تبلغ 750 ألف طن متري سنويًا (MTPY).
- في أبريل 2022، افتتحت شركة Drax Group PLC مصنعًا جديدًا للحبيبات في ديموبوليس في ألاباما بالولايات المتحدة. ينتج المصنع حبيبات الكتلة الحيوية المستدامة سنويًا من مخلفات مصانع الأخشاب مثل نشارة الخشب والرقائق والقصاصات.
- في ديسمبر 2020، أطلقت شركة Pure Biofuel Ltd. حبيبات الخشب ENPOWER. تتضمن أكياس حبيبات الخشب ENPOWER معايير الجودة A1، التي وضعها مجلس حبيبات الخشب في المملكة المتحدة والمجلس الأوروبي. يتوفر هذا المنتج في عبوات تزن 10 كجم أو 15 كجم.
- في أبريل 2021، استحوذت شركة Drax Group PLC على شركة Pinnacle Renewable Energy Inc. ومن خلال هذا الاستحواذ، قدمت شركة Drax Group PLC الطاقة الحيوية مع التقاط الكربون وتخزينه (BECCS)، وإزالة ثاني أكسيد الكربون من الغلاف الجوي بشكل دائم سنويًا.
- في مايو 2023، استحوذت مجموعة LEAG على شركة Wismar Pellets GmbH من Metropolitan Equity Partners، وهي شركة استثمارية خاصة، في عملية تقديم عطاءات لتوسيع محفظة الإنتاج والتوريد لعمليات التكرير الخاصة بها. سيساعد هذا الاستحواذ مجموعة LEAG على خدمة عدد أكبر من العملاء.
نظرة إقليمية على سوق حبيبات الكتلة الحيوية
لقد قام المحللون في Insight Partners بشرح الاتجاهات والعوامل الإقليمية المؤثرة على سوق حبيبات الكتلة الحيوية طوال فترة التوقعات بشكل شامل. يناقش هذا القسم أيضًا قطاعات سوق حبيبات الكتلة الحيوية والجغرافيا في جميع أنحاء أمريكا الشمالية وأوروبا ومنطقة آسيا والمحيط الهادئ والشرق الأوسط وأفريقيا وأمريكا الجنوبية والوسطى.

- احصل على البيانات الإقليمية المحددة لسوق حبيبات الكتلة الحيوية
نطاق تقرير سوق حبيبات الكتلة الحيوية
| سمة التقرير | تفاصيل |
|---|---|
| حجم السوق في عام 2022 | 11 مليار دولار أمريكي |
| حجم السوق بحلول عام 2030 | 16.14 مليار دولار أمريكي |
| معدل النمو السنوي المركب العالمي (2022 - 2030) | 4.9% |
| البيانات التاريخية | 2020-2021 |
| فترة التنبؤ | 2023-2030 |
| القطاعات المغطاة | حسب المصدر
|
| المناطق والدول المغطاة | أمريكا الشمالية
|
| قادة السوق وملفات تعريف الشركات الرئيسية |
|
كثافة اللاعبين في سوق حبيبات الكتلة الحيوية: فهم تأثيرها على ديناميكيات الأعمال
يشهد سوق حبيبات الكتلة الحيوية نموًا سريعًا، مدفوعًا بالطلب المتزايد من المستخدم النهائي بسبب عوامل مثل تفضيلات المستهلكين المتطورة والتقدم التكنولوجي والوعي المتزايد بفوائد المنتج. ومع ارتفاع الطلب، تعمل الشركات على توسيع عروضها والابتكار لتلبية احتياجات المستهلكين والاستفادة من الاتجاهات الناشئة، مما يؤدي إلى زيادة نمو السوق.
تشير كثافة اللاعبين في السوق إلى توزيع الشركات أو المؤسسات العاملة في سوق أو صناعة معينة. وهي تشير إلى عدد المنافسين (اللاعبين في السوق) الموجودين في مساحة سوق معينة نسبة إلى حجمها أو قيمتها السوقية الإجمالية.
الشركات الرئيسية العاملة في سوق حبيبات الكتلة الحيوية هي:
- مجموعة دراكس المحدودة
- شركة إنفيفا
- AS جرانول للاستثمار
- شركة ليجنتكس
- شركة فالفي للمنتجات
إخلاء المسؤولية : الشركات المذكورة أعلاه ليست مرتبة بأي ترتيب معين.

- احصل على نظرة عامة على أهم اللاعبين الرئيسيين في سوق حبيبات الكتلة الحيوية
تأثير كوفيد-19:
أثرت جائحة كوفيد-19 على جميع الصناعات تقريبًا في مختلف البلدان. أعاقت عمليات الإغلاق والقيود على السفر وإغلاق الأعمال في أمريكا الشمالية وأوروبا ومنطقة آسيا والمحيط الهادئ وأمريكا الجنوبية والوسطى والشرق الأوسط وأفريقيا نمو العديد من الصناعات، بما في ذلك صناعة الكيماويات والمواد. أدى إغلاق وحدات التصنيع لشركات حبيبات الكتلة الحيوية إلى اضطراب سلاسل التوريد العالمية وأنشطة التصنيع وجداول التسليم. شهدت العديد من الشركات تأخيرات في تسليم المنتجات وانخفاضًا في مبيعات منتجاتها في عام 2020. تم إغلاق معظم محطات الطاقة والمصانع الصناعية أثناء الوباء، مما أدى إلى انخفاض استهلاك حبيبات الكتلة الحيوية. بالإضافة إلى ذلك، تسبب الوباء في تقلبات في أسعار حبيبات الكتلة الحيوية. ومع ذلك، أحيت العديد من الصناعات عملياتها بعد حل قيود العرض. علاوة على ذلك، فإن الطلب المتزايد على حبيبات الكتلة الحيوية من القطاعين الصناعي والسكني يعزز بشكل كبير نمو سوق حبيبات الكتلة الحيوية.
المنافسة والشركات الرئيسية:
تشمل بعض الشركات العاملة في سوق حبيبات الكتلة الحيوية العالمية شركة Drax Group Plc، وشركة Enviva Inc، وشركة AS Graanul Invest، وشركة Lignetics Inc، وشركة Valfei Products Inc، وشركة Mallard Creek Inc، وشركة Energex American Inc.، وشركة Wismar Pellets GmbH، وشركة UAB Redal Ltd، وشركة Premium Pellet Ltd. تركز الشركات العاملة في سوق حبيبات الكتلة الحيوية العالمية على توفير منتجات عالية الجودة لتلبية طلب العملاء.
- التحليل التاريخي (سنتان)، سنة الأساس، التوقعات (7 سنوات) مع معدل النمو السنوي المركب
- تحليل PEST و SWOT
- حجم السوق والقيمة / الحجم - عالمي، إقليمي، بلد
- الصناعة والمنافسة
- مجموعة بيانات إكسل
التقارير الحديثة
تقارير ذات صلة
شهادات العملاء
سبب الشراء
- اتخاذ قرارات مدروسة
- فهم ديناميكيات السوق
- تحليل المنافسة
- رؤى العملاء
- توقعات السوق
- تخفيف المخاطر
- التخطيط الاستراتيجي
- مبررات الاستثمار
- تحديد الأسواق الناشئة
- تحسين استراتيجيات التسويق
- تعزيز الكفاءة التشغيلية
- مواكبة التوجهات التنظيمية


 احصل على عينة مجانية ل - سوق حبيبات الكتلة الحيوية