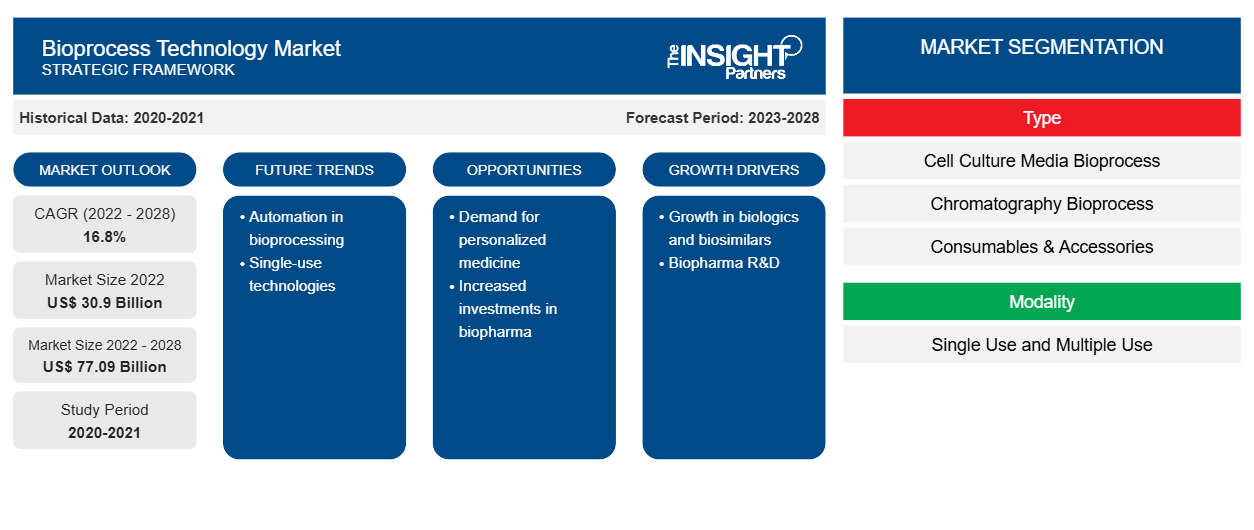
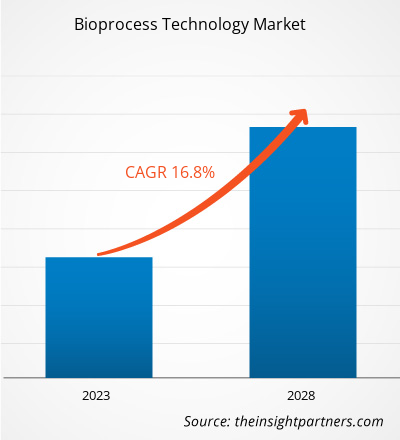
[تقرير بحثي] تم تقييم حجم سوق تكنولوجيا العمليات الحيوية بـ 30،897.49 مليون دولار أمريكي في عام 2022 ومن المتوقع أن يصل إلى 77،090.05 مليون دولار أمريكي بحلول عام 2028؛ ومن المتوقع أن يسجل معدل نمو سنوي مركب بنسبة 16.8٪ من عام 2023 إلى عام 2028.
وجهة نظر المحلل
تتمثل مزايا المعالجة الحيوية في استخدام ضغط أقل ودرجات حرارة أقل ومستويات pH أكثر ملاءمة، والعملية بأكملها قابلة للتجديد. زيادة الإنفاق على البحث والتطوير لتقديم مركبات دوائية جديدة وزيادة انتشار الأمراض المزمنة. تعد السياسات التنظيمية الصارمة من أكثر العوامل تأثيرًا المسؤولة عن النمو المؤثر لسوق تكنولوجيا المعالجة الحيوية. بالإضافة إلى ذلك، فإن إدخال تقنيات المعالجة الحيوية المتقدمة يوفر فرصة سوقية مربحة للسوق الإجمالية للنمو بشكل كبير خلال فترة التنبؤ. علاوة على ذلك، يعمل ظهور قياس التدفق الخلوي الآلي في الوقت الفعلي (ART-FCM) كاتجاه مستقبلي لنمو السوق خلال الفترة 2023-2028. وفقًا للتجزئة الموضحة في التقرير، بناءً على شريحة النوع، تمثل المعالجة الحيوية لوسائط زراعة الخلايا الحصة الأكبر؛ وبالمثل، من المتوقع أن تسجل المعالجة الحيوية للكروماتوغرافيا أعلى معدل نمو سنوي مركب خلال الفترة المتوقعة (2023-2028). علاوة على ذلك، من حيث الطريقة، ستشكل شريحة الاستخدام الفردي حصة كبيرة لتكنولوجيا المعالجة الحيوية خلال فترة التنبؤ. من حيث المستخدم النهائي، سوف يهيمن قطاع شركات الأدوية الحيوية على نمو سوق تكنولوجيا المعالجة الحيوية خلال الفترة المتوقعة.
تعد تكنولوجيا المعالجة الحيوية جزءًا أساسيًا من التكنولوجيا الحيوية التي تتعامل مع العمليات التي تجمع بين المادة الحية أو مكوناتها مع العناصر الغذائية التي تنتج مواد كيميائية متخصصة وكواشف وعلاجات حيوية. تتضمن المراحل المختلفة المرتبطة بتكنولوجيا المعالجة الحيوية تحضير الركائز والوسائط واختيار المحفزات الحيوية وتحسينها وإنتاج الحجم والمعالجة اللاحقة والتنقية والمعالجة النهائية. تُستخدم تكنولوجيا المعالجة الحيوية على نطاق واسع، من الأغذية والأدوية إلى الوقود والمواد الكيميائية.
قم بتخصيص هذا التقرير ليناسب متطلباتك
ستحصل على تخصيص لأي تقرير - مجانًا - بما في ذلك أجزاء من هذا التقرير، أو تحليل على مستوى الدولة، وحزمة بيانات Excel، بالإضافة إلى الاستفادة من العروض والخصومات الرائعة للشركات الناشئة والجامعات
- احصل على أهم اتجاهات السوق الرئيسية لهذا التقرير.ستتضمن هذه العينة المجانية تحليلاً للبيانات، بدءًا من اتجاهات السوق وحتى التقديرات والتوقعات.
رؤى السوق
زيادة الإنفاق على البحث والتطوير لإنتاج مركبات دوائية جديدة
تنفق شركات الأدوية مبالغ ضخمة في البحث والتطوير لتقديم جزيئات جديدة ذات فعالية طبية وتجارية معززة لتطبيقات علاجية مختلفة. في السنة المالية 2019/2020، وصلت 16 شركة أدوية إلى قائمة أكبر 50 شركة في العالم من حيث إجمالي الاستثمار في البحث والتطوير. تعد نوفارتيس وروتش وجونسون آند جونسون وميرك آند كو وجلاكسو سميث كلاين وفايزر من بين أكبر 10 شركات في العالم باستثمارات عالية في البحث والتطوير.
استثمارات البحث والتطوير من قبل شركات الأدوية الكبرى
شركة
|
الاستثمار في البحث والتطوير في عام 2022 (مليون دولار أمريكي)
|
الاستثمار في البحث والتطوير في عام 2021 (مليون دولار أمريكي)
|
شركة جيلياد للعلوم | 27,305 | 27,281 |
شركة بريستول مايرز سكويب | 46,159 | 46,385 |
شركة أمجين | 26,323 | 25,979 |
فايزر | 100,330 | 81,288 |
شركة ميرك وشركاه | 59,283 | 48,704 |
شركة آبفي | 58,054 | 56,197 |
ملحوظة: لقد تم أخذ أسعار تحويل العملات في الاعتبار حيثما كان ذلك مطلوبًا.
المصدر: التقارير السنوية للشركات وتحليلات Insight Partners
وقد أدى انتهاء صلاحية براءات الاختراع للجزيئات الرائجة، وعدد محدود من المنتجات المحتملة في خط الأنابيب، والطلب المتزايد على المواد البيولوجية إلى دفع الشركات إلى تبني تقنيات جديدة، مثل تقنيات المعالجة الحيوية للاستخدام مرة واحدة، من أجل تسهيل عملية تحول سريعة وفعالة من حيث التكلفة للمنتجات. وعادة ما يقوم مصنعو المكونات والأنظمة للاستخدام مرة واحدة بإنتاج وتجميع المنتجات في غرف نظيفة لضمان عدم إدخال الجسيمات الضارة والسموم الداخلية في عملية حيوية. وبالتالي، يتم استثمار مبالغ كبيرة في البحث والتطوير لإدخال مركبات دوائية جديدة والمساعدة في تطوير تقنيات المعالجة الحيوية؛ وتدعم هذه التقنيات قدرات التصنيع الحيوي الناشئة والتشغيل البيني المرتبط بالمواد الخام والمفاعلات الحيوية وعمليات الوحدات.
رؤى مبنية على النوع
بناءً على النوع، يتم تقسيم سوق تكنولوجيا المعالجة الحيوية إلى معالجة حيوية لوسائط زراعة الخلايا ، ومعالجة حيوية للكروماتوغرافيا، والمواد الاستهلاكية والملحقات، وغيرها. احتل قطاع المعالجة الحيوية لوسائط زراعة الخلايا أكبر حصة سوقية لتكنولوجيا المعالجة الحيوية في عام 2022 بينما من المتوقع أن تسجل المعالجة الحيوية للكروماتوغرافيا أعلى معدل نمو سنوي مركب خلال الفترة المتوقعة (2023-2028).
رؤى تعتمد على النمط
بناءً على الطريقة المتبعة، ينقسم سوق تكنولوجيا المعالجة الحيوية العالمية إلى استخدام فردي واستخدامات متعددة. وقد استحوذ قطاع الاستخدام الفردي على حصة سوقية أكبر لتكنولوجيا المعالجة الحيوية في عام 2022. ومن المتوقع أن ينمو قطاع الاستخدام المتعدد بمعدل نمو سنوي مركب أعلى خلال الفترة المتوقعة.
رؤى تعتمد على المستخدم النهائي
من حيث المستخدم النهائي، يتم تصنيف سوق تكنولوجيا المعالجة الحيوية إلى المؤسسات الأكاديمية والطبية، وشركات الأدوية الحيوية، ومختبرات الأبحاث، وغيرها. استحوذت شركات الأدوية الحيوية على أكبر حصة سوقية في عام 2022، في حين من المتوقع أن تسجل المؤسسات الأكاديمية والطبية معدل نمو سنوي مركب أعلى خلال فترة التوقعات.
التحليل الإقليمي
سيطرت أمريكا الشمالية على سوق تكنولوجيا المعالجة الحيوية حيث استحوذت على الحصة القصوى. ويعزى نمو سوق تكنولوجيا المعالجة الحيوية في هذه المنطقة إلى وجود لاعبين كبار يطلقون منتجات مبتكرة (خاصة فيما يتعلق بتكنولوجيا المعالجة الحيوية)، وتزايد طرح المنتجات في المنطقة، والتقدم التكنولوجي في تكنولوجيا المعالجة الحيوية. في أمريكا الشمالية، تسجل الولايات المتحدة أقصى حصة لتكنولوجيا المعالجة الحيوية. ووفقًا لتقرير إدارة الغذاء والدواء (FDA)، يعاني أكثر من 30 مليون شخص في الولايات المتحدة من حوالي 7000 مرض نادر، وهو ما يمثل حالات تهدد الحياة مع خيارات علاج منخفضة. يعد تطوير الأدوية والبيولوجيا والأجهزة في علاج الأمراض النادرة أمرًا صعبًا بسبب الافتقار إلى فهم تاريخ الأمراض النادرة وصعوبة إجراء التجارب السريرية. لذلك، يمثل نمو تكنولوجيا المعالجة الحيوية مثل العلاجات الجينية والخلوية (CGTs) والمستحضرات الصيدلانية المتخصصة تحولًا جذريًا في علاج الأمراض النادرة. على سبيل المثال، كشفت العلاجات الجينية والخلوية (CGTs) والمستحضرات الصيدلانية المتخصصة عن فوائد صحية كبيرة مقارنة بالأدوية المصنعة لعلاج الأمراض النادرة. في الولايات المتحدة، هناك أكثر من 900 طلب بحثي لدواء جديد (IND) يستهدف منتجات العلاج الجيني قيد التنفيذ. كما توافق إدارة الغذاء والدواء الأمريكية سنويًا على 10 إلى 20 علاجًا جينيًا. وعلى نحو مماثل، وافقت إدارة الغذاء والدواء الأمريكية في أغسطس 2022 على عقار "زينتيجلو (بيتيبيجلوجين أوتوتيمسيل)" من إنتاج شركة بلوبيرد بايو. وكان هذا العقار هو أغلى عقار يتم الموافقة عليه في الولايات المتحدة لعلاج اضطراب عصبي نادر - اعتلال الغدة الكظرية الدماغية (CALD).
وبالمثل، ستمثل منطقة آسيا والمحيط الهادئ أعلى معدل نمو سنوي مركب لسوق تكنولوجيا المعالجة الحيوية. ومن بين منطقة آسيا والمحيط الهادئ، ستحتفظ الصين بحصة سوقية كبيرة لسوق تكنولوجيا المعالجة الحيوية. وقد زادت قدرة المعالجة الحيوية على مستوى العالم بمعدل 12% في المتوسط منذ العقد الماضي، وفقًا لتقرير مؤشر BioPlan Associates لأفضل 1000 منشأة حيوية وقاعدة بيانات الشركات المصنعة الحيوية. وتتمتع الصين بمكانة جيدة كمشارك عالمي في الأسواق التي تضم أدوية الجزيئات الصغيرة والكبيرة، حيث تحتل المركزين الثاني والثالث على التوالي على مستوى العالم. كما تعد الصين موطنًا للعديد من مطوري العلاج الخلوي والجينات نظرًا لقاعدة الصين لمنظمات تطوير وتصنيع العقود (CDMOs)، والتي تمثل حوالي 25% من قدرة الإنتاج الحيوي في البلاد. لذلك، تتمتع الصين بقدرات تصنيع حيوي كبيرة ولكنها تلتزم بشكل صارم بمعايير GMP العالمية التي تبني الثقة في سلامة وفعالية المواد البيولوجية.
دولة
|
منشأة التصنيع الحيوي (ل)
|
القدرة العالمية (%)
|
معدل النمو السنوي المركب للقدرة المقدرة (%)
|
الصين | 1.77 مليون | 10.2 | 15-20 |
المصدر: مقارنة عالمية لقدرة التصنيع الحيوي؛ بيانات من مؤشر BioPlan Associates لأفضل 1000 منشأة حيوية وقاعدة بيانات الشركات المصنعة الحيوية (معدل النمو السنوي المركب).
رؤى إقليمية حول سوق تكنولوجيا المعالجة الحيوية
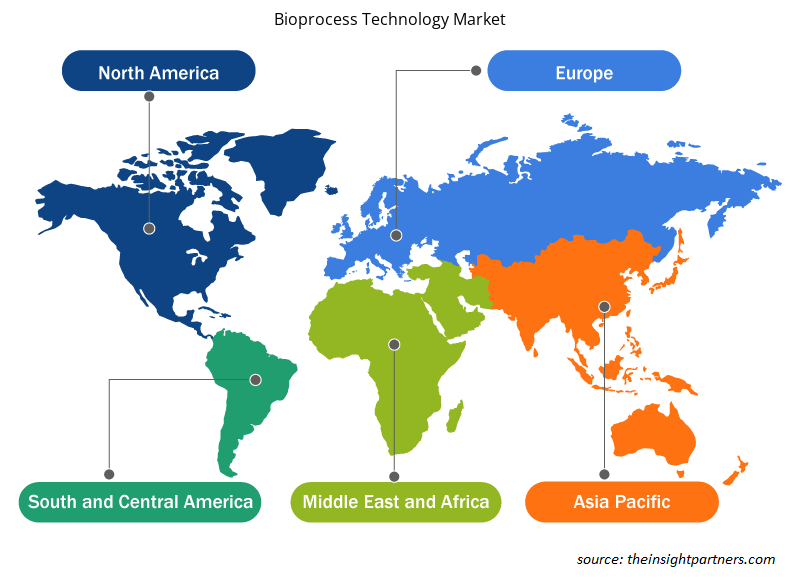
لقد قام المحللون في Insight Partners بشرح الاتجاهات والعوامل الإقليمية المؤثرة على سوق تكنولوجيا المعالجة الحيوية طوال فترة التوقعات بشكل شامل. يناقش هذا القسم أيضًا قطاعات سوق تكنولوجيا المعالجة الحيوية والجغرافيا في جميع أنحاء أمريكا الشمالية وأوروبا ومنطقة آسيا والمحيط الهادئ والشرق الأوسط وأفريقيا وأمريكا الجنوبية والوسطى.

- احصل على البيانات الإقليمية المحددة لسوق تكنولوجيا المعالجة الحيوية
نطاق تقرير سوق تكنولوجيا المعالجة الحيوية
| سمة التقرير | تفاصيل |
|---|---|
| حجم السوق في عام 2022 | 30.9 مليار دولار أمريكي |
| حجم السوق بحلول عام 2028 | 77.09 مليار دولار أمريكي |
| معدل النمو السنوي المركب العالمي (2022 - 2028) | 16.8% |
| البيانات التاريخية | 2020-2021 |
| فترة التنبؤ | 2023-2028 |
| القطاعات المغطاة | حسب النوع
|
| المناطق والدول المغطاة | أمريكا الشمالية
|
| قادة السوق وملفات تعريف الشركات الرئيسية |
|
كثافة اللاعبين في سوق تكنولوجيا المعالجة الحيوية: فهم تأثيرها على ديناميكيات الأعمال
يشهد سوق تكنولوجيا المعالجة الحيوية نموًا سريعًا، مدفوعًا بالطلب المتزايد من المستخدم النهائي بسبب عوامل مثل تفضيلات المستهلك المتطورة والتقدم التكنولوجي والوعي المتزايد بفوائد المنتج. ومع ارتفاع الطلب، تعمل الشركات على توسيع عروضها والابتكار لتلبية احتياجات المستهلكين والاستفادة من الاتجاهات الناشئة، مما يؤدي إلى زيادة نمو السوق.
تشير كثافة اللاعبين في السوق إلى توزيع الشركات أو المؤسسات العاملة في سوق أو صناعة معينة. وهي تشير إلى عدد المنافسين (اللاعبين في السوق) الموجودين في مساحة سوق معينة نسبة إلى حجمها أو قيمتها السوقية الإجمالية.
الشركات الرئيسية العاملة في سوق تكنولوجيا المعالجة الحيوية هي:
- ميرك كي جي ايه ايه
- شركة سارتوريوس ايه جي
- شركة ثيرمو فيشر العلمية
- شركة كورنينج
- ستام للتكنولوجيا الحيوية
إخلاء المسؤولية : الشركات المذكورة أعلاه ليست مرتبة بأي ترتيب معين.

- احصل على نظرة عامة على أهم اللاعبين الرئيسيين في سوق تكنولوجيا المعالجة الحيوية
تعد Merck KGaA وSartorius AG وThermo Fisher Scientific Inc وCorning Inc وSTAMM Biotech وLonza Group AG وEppendorf SE وRepligen Corp وDanaher Corp وBioPharma Dynamics Ltd من بين اللاعبين الرائدين الذين يعملون في نمو سوق تكنولوجيا المعالجة الحيوية العالمية. تم تحليل العديد من اللاعبين الأساسيين الآخرين في السوق للحصول على رؤية شاملة للسوق ونظامها البيئي. يوفر التقرير رؤى تفصيلية للسوق، والتي تساعد اللاعبين الرئيسيين في وضع استراتيجيات لنمو سوقهم. تم ذكر بعض التطورات أدناه:
- في يونيو 2022، دخلت شركة ميرك في تعاون مع شركة أجيلنت تكنولوجيز لتطوير تقنيات التحليل العملي (PAT). تعد تقنيات التحليل العملي، التي تشجعها السلطات التنظيمية العالمية بقوة، ممكّنًا رئيسيًا للإصدار في الوقت الفعلي والمعالجة الحيوية 4.0.
- في مارس 2020، أطلقت شركة Sartorius الجيل الثالث من المفاعل الحيوي للاستخدام الفردي BIOSTAT STR ومنصة الأتمتة BIOBRAIN لتقديم ابتكارات من شأنها أن تغير مجال تطوير وتصنيع العمليات الصيدلانية الحيوية. تعمل Biostat STR على تبسيط إنتاج المواد البيولوجية.
نبذة عن الشركة
- ميرك كي جي ايه ايه
- شركة سارتوريوس ايه جي
- شركة ثيرمو فيشر العلمية
- شركة كورنينج
- ستام للتكنولوجيا الحيوية
- مجموعة لونزا ايه جي
- إيبندورف SE
- شركة ريبليجين
- شركة داناهر
- شركة بيوفارما ديناميكس المحدودة
- التحليل التاريخي (سنتان)، السنة الأساسية، التوقعات (7 سنوات) مع معدل النمو السنوي المركب
- تحليل PEST و SWOT
- حجم السوق والقيمة / الحجم - عالميًا وإقليميًا وقطريًا
- الصناعة والمنافسة
- مجموعة بيانات Excel


Report Coverage
Revenue forecast, Company Analysis, Industry landscape, Growth factors, and Trends

Segment Covered
This text is related
to segments covered.

Regional Scope
North America, Europe, Asia Pacific, Middle East & Africa, South & Central America

Country Scope
This text is related
to country scope.
الأسئلة الشائعة
Bioprocessing is the process that utilizes complete living cells or components (e.g., bacteria, enzymes, and proteins) to obtain desired products. The process is commonly known as fermentation. The entire process is divided into three stages: upstream process, fermentation, and downstream process. The upstream process involves preparation of liquid media, separation of particulate and inhibitory chemicals through sterilization and air purification. Additionally, fermentation involves the conversion of substrate to obtain desired products through biological agents such as microorganisms. Furthermore, downstream processing involves separation of cells from the fermentation broth, purification and concentration of desired products and waste disposal or recycle method.
The growing R&D spendings to introduce new drug compounds, and increasing prevalence of chronic diseases. However, stringent regulatory policies are restricting the market growth.
Based on type, cell culture media bioprocess took the forefront leaders in the worldwide market by accounting largest share in 2022 and is expected to continue to do so till the forecast period.
Global bioprocess technology market is segmented by region into North America, Europe, Asia Pacific, the Middle East & Africa, and South & Central America. In North America, the U.S. held the largest market share for bioprocess technology market. The US is expected to hold the largest share in the bioprocess technology market during the forecast period. The presence of top players and favorable regulations related to product approvals coupled with commercializing new products are the contributing factors for the regional growth. Additionally, the increasing number of technological advancements is the key factor responsible for the Asia Pacific regional growth in the coming years.
Merck KGaA, Sartorius AG, Thermo Fisher Scientific Inc, Corning Inc, STAMM Biotech, Lonza Group AG, Eppendorf SE, Repligen Corp, Danaher Corp, BioPharma Dynamics Ltd; are among the leading companies operating in the global bioprocess technology market
The single use segment dominated the global bioprocess technology market.
The List of Companies - Bioprocess Technology Market
- Merck KGaA
- Sartorius AG
- Thermo Fisher Scientific Inc
- Corning Inc
- STAMM Biotech
- Lonza Group AG
- Eppendorf SE
- Repligen Corp
- Danaher Corp
- BioPharma Dynamics Ltd
The Insight Partners performs research in 4 major stages: Data Collection & Secondary Research, Primary Research, Data Analysis and Data Triangulation & Final Review.
- Data Collection and Secondary Research:
As a market research and consulting firm operating from a decade, we have published and advised several client across the globe. First step for any study will start with an assessment of currently available data and insights from existing reports. Further, historical and current market information is collected from Investor Presentations, Annual Reports, SEC Filings, etc., and other information related to company’s performance and market positioning are gathered from Paid Databases (Factiva, Hoovers, and Reuters) and various other publications available in public domain.
Several associations trade associates, technical forums, institutes, societies and organization are accessed to gain technical as well as market related insights through their publications such as research papers, blogs and press releases related to the studies are referred to get cues about the market. Further, white papers, journals, magazines, and other news articles published in last 3 years are scrutinized and analyzed to understand the current market trends.
- Primary Research:
The primarily interview analysis comprise of data obtained from industry participants interview and answers to survey questions gathered by in-house primary team.
For primary research, interviews are conducted with industry experts/CEOs/Marketing Managers/VPs/Subject Matter Experts from both demand and supply side to get a 360-degree view of the market. The primary team conducts several interviews based on the complexity of the markets to understand the various market trends and dynamics which makes research more credible and precise.
A typical research interview fulfils the following functions:
- Provides first-hand information on the market size, market trends, growth trends, competitive landscape, and outlook
- Validates and strengthens in-house secondary research findings
- Develops the analysis team’s expertise and market understanding
Primary research involves email interactions and telephone interviews for each market, category, segment, and sub-segment across geographies. The participants who typically take part in such a process include, but are not limited to:
- Industry participants: VPs, business development managers, market intelligence managers and national sales managers
- Outside experts: Valuation experts, research analysts and key opinion leaders specializing in the electronics and semiconductor industry.
Below is the breakup of our primary respondents by company, designation, and region:

Once we receive the confirmation from primary research sources or primary respondents, we finalize the base year market estimation and forecast the data as per the macroeconomic and microeconomic factors assessed during data collection.
- Data Analysis:
Once data is validated through both secondary as well as primary respondents, we finalize the market estimations by hypothesis formulation and factor analysis at regional and country level.
- Macro-Economic Factor Analysis:
We analyse macroeconomic indicators such the gross domestic product (GDP), increase in the demand for goods and services across industries, technological advancement, regional economic growth, governmental policies, the influence of COVID-19, PEST analysis, and other aspects. This analysis aids in setting benchmarks for various nations/regions and approximating market splits. Additionally, the general trend of the aforementioned components aid in determining the market's development possibilities.
- Country Level Data:
Various factors that are especially aligned to the country are taken into account to determine the market size for a certain area and country, including the presence of vendors, such as headquarters and offices, the country's GDP, demand patterns, and industry growth. To comprehend the market dynamics for the nation, a number of growth variables, inhibitors, application areas, and current market trends are researched. The aforementioned elements aid in determining the country's overall market's growth potential.
- Company Profile:
The “Table of Contents” is formulated by listing and analyzing more than 25 - 30 companies operating in the market ecosystem across geographies. However, we profile only 10 companies as a standard practice in our syndicate reports. These 10 companies comprise leading, emerging, and regional players. Nonetheless, our analysis is not restricted to the 10 listed companies, we also analyze other companies present in the market to develop a holistic view and understand the prevailing trends. The “Company Profiles” section in the report covers key facts, business description, products & services, financial information, SWOT analysis, and key developments. The financial information presented is extracted from the annual reports and official documents of the publicly listed companies. Upon collecting the information for the sections of respective companies, we verify them via various primary sources and then compile the data in respective company profiles. The company level information helps us in deriving the base number as well as in forecasting the market size.
- Developing Base Number:
Aggregation of sales statistics (2020-2022) and macro-economic factor, and other secondary and primary research insights are utilized to arrive at base number and related market shares for 2022. The data gaps are identified in this step and relevant market data is analyzed, collected from paid primary interviews or databases. On finalizing the base year market size, forecasts are developed on the basis of macro-economic, industry and market growth factors and company level analysis.
- Data Triangulation and Final Review:
The market findings and base year market size calculations are validated from supply as well as demand side. Demand side validations are based on macro-economic factor analysis and benchmarks for respective regions and countries. In case of supply side validations, revenues of major companies are estimated (in case not available) based on industry benchmark, approximate number of employees, product portfolio, and primary interviews revenues are gathered. Further revenue from target product/service segment is assessed to avoid overshooting of market statistics. In case of heavy deviations between supply and demand side values, all thes steps are repeated to achieve synchronization.
We follow an iterative model, wherein we share our research findings with Subject Matter Experts (SME’s) and Key Opinion Leaders (KOLs) until consensus view of the market is not formulated – this model negates any drastic deviation in the opinions of experts. Only validated and universally acceptable research findings are quoted in our reports.
We have important check points that we use to validate our research findings – which we call – data triangulation, where we validate the information, we generate from secondary sources with primary interviews and then we re-validate with our internal data bases and Subject matter experts. This comprehensive model enables us to deliver high quality, reliable data in shortest possible time.


 احصل على عينة مجانية لهذا التقرير