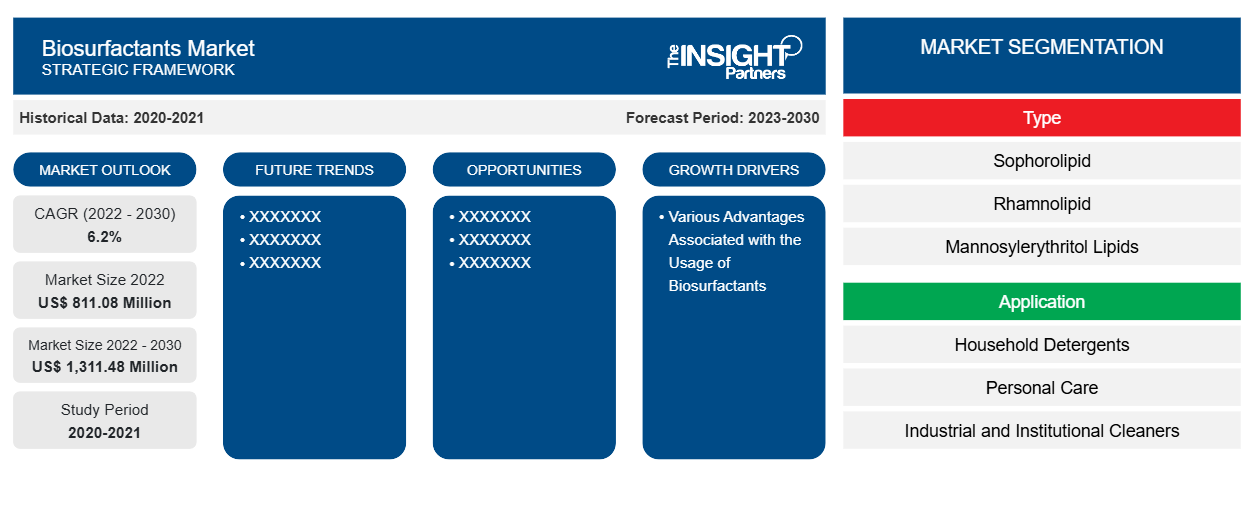
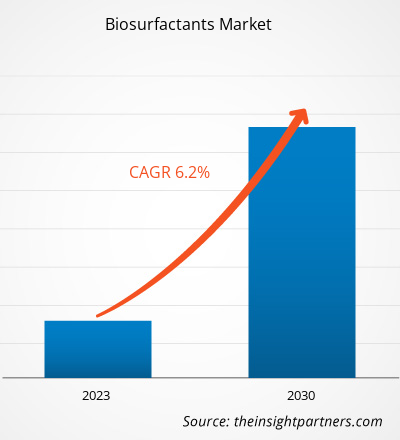
[تقرير بحثي] من المتوقع أن ينمو حجم سوق المواد الخافضة للتوتر السطحي من 811.08 مليون دولار أمريكي في عام 2022 إلى 1،311.48 مليون دولار أمريكي بحلول عام 2030؛ ومن المتوقع أن يسجل معدل نمو سنوي مركب بنسبة 6.2٪ من عام 2022 إلى عام 2030.
رؤى السوق ووجهة نظر المحلل:
تُعرف المواد الخافضة للتوتر السطحي بأنها مركبات نشطة على السطح يمكن تصنيعها بعدد محدد من السمية. بالإضافة إلى القدرة على التحلل البيولوجي والسمية المنخفضة وإمكانات الإنتاج العالية، تتمتع المواد الخافضة للتوتر السطحي بنشاط سطحي وواجهة مرتفع. تُستخدم المواد الخافضة للتوتر السطحي على نطاق واسع في المنتجات الزراعية، مثل المبيدات الحشرية والمواد الكيميائية الأخرى، وفي المنظفات للاستخدام السكني والطبي والرعاية الصحية؛ وفي منتجات العناية الشخصية ومستحضرات التجميل، مثل الشامبو وسوائل غسيل الحشيش والصابون والعديد من المنتجات الأخرى. نظرًا للطلب المتزايد على المواد الخافضة للتوتر السطحي من العديد من الصناعات ذات الاستخدام النهائي، بما في ذلك النفط والطاقة والزراعة والمواد الكيميائية والأدوية والطب والرعاية الصحية والسلع الاستهلاكية وغيرها، فإن هذا السوق يزدهر يومًا بعد يوم. هذا العامل يحرك بشكل كبير سوق المواد الخافضة للتوتر السطحي العالمية
محركات النمو والتحديات:
تقدم المواد الخافضة للتوتر السطحي الحيوية العديد من المزايا مقارنة بالمواد الخافضة للتوتر السطحي الكيميائية، مثل قابلية التحلل البيولوجي العالية، وتنوع الخصائص البيولوجية، والخصائص المتجددة التي يتم تصنيعها كمزيج من جزيئات مختلفة. تتمتع المواد الخافضة للتوتر السطحي الحيوية بخصائص مختلفة، بما في ذلك النشاط المضاد للميكروبات ومضادات الأكسدة، مما يسمح بتطبيقها في صناعات مختلفة، مثل المنظفات والعناية الشخصية. كما أنها فعالة للغاية في تقليل التوتر السطحي والبيني. علاوة على ذلك، فإن ارتفاع مستويات المعيشة، والنمو السكاني، وزيادة التحضر، وزيادة إطلاق المنتجات المبتكرة، وزيادة وعي المستهلك بالصحة والنظافة هي عوامل رئيسية تعزز الطلب على المنظفات المنزلية ومنتجات التنظيف في جميع أنحاء العالم. بالإضافة إلى ذلك، تعمل الأنشطة والحملات التسويقية المختلفة التي يقوم بها اللاعبون في السوق على توليد الوعي بمنتجات المنظفات مثل الهلام والقرون والسوائل بين المستهلكين. في السنوات الأخيرة، كان سوق منتجات التنظيف في الصين ينمو بشكل مطرد. ومع ذلك، يواجه المصنعون تحديات في تحقيق الإنتاج الصناعي، وهو أمر مجدٍ اقتصاديًا لإنتاج المواد الخافضة للتوتر السطحي الحيوية. تكلفة إنتاج المواد الخافضة للتوتر السطحي الحيوية مرتفعة بسبب العائدات الأضعف مقارنة بالمواد الخافضة للتوتر السطحي الاصطناعية التجارية. تؤثر تكاليف المواد الخام المرتفعة، والتطهير الباهظ التكلفة، والمعالجة اللاحقة على تكلفة الإنتاج. العيب الرئيسي للمواد الخافضة للتوتر السطحي هو سعرها المرتفع، وهو عامل رئيسي في تقليل الطلب على المواد الخافضة للتوتر السطحي.
قم بتخصيص هذا التقرير ليناسب متطلباتك
ستحصل على تخصيص لأي تقرير - مجانًا - بما في ذلك أجزاء من هذا التقرير، أو تحليل على مستوى الدولة، وحزمة بيانات Excel، بالإضافة إلى الاستفادة من العروض والخصومات الرائعة للشركات الناشئة والجامعات
- احصل على أهم اتجاهات السوق الرئيسية لهذا التقرير.ستتضمن هذه العينة المجانية تحليلاً للبيانات، بدءًا من اتجاهات السوق وحتى التقديرات والتوقعات.
تقسيم التقرير ونطاقه:
يتم تقسيم سوق المواد الخافضة للتوتر السطحي العالمية على أساس النوع والتطبيق والجغرافيا. بناءً على النوع، يتم تقسيم سوق المواد الخافضة للتوتر السطحي إلى سوفوروليبيد، ورامنوليبيد، ودهون مانوسيل إريثريتول (MELs)، وألكيل بولي جلوكوزيدات (APGs)، وسورفاكتين، وفسفوليبيدات، وبوليمرية، وغيرها. بناءً على التطبيق، يتم تقسيم سوق المواد الخافضة للتوتر السطحي إلى المنظفات المنزلية، والعناية الشخصية، والمنظفات الصناعية والمؤسسية، ومعالجة الأغذية، والمواد الكيميائية لحقول النفط، ومعالجة الجلود، والزراعة، والمستحضرات الصيدلانية، وغيرها. جغرافيًا، يتم تقسيم السوق إلى أمريكا الشمالية (الولايات المتحدة وكندا والمكسيك)، وأوروبا (ألمانيا وفرنسا والمملكة المتحدة وروسيا وإيطاليا وبقية أوروبا)، وآسيا والمحيط الهادئ (كوريا الجنوبية وأستراليا والصين واليابان والهند وبقية آسيا والمحيط الهادئ)، والشرق الأوسط وأفريقيا (الإمارات العربية المتحدة وجنوب أفريقيا والمملكة العربية السعودية وبقية الشرق الأوسط وأفريقيا)، وأمريكا الجنوبية والوسطى (البرازيل والأرجنتين وبقية أمريكا الجنوبية والوسطى).
التحليل القطاعي:
بناءً على النوع، يتم تقسيم سوق المواد الخافضة للتوتر السطحي إلى صفوروليبيد، ورامنوليبيد، ودهون مانوسيل إريثريتول (MELs)، وبولي جلوكوزيدات ألكيل (APGs)، وسورفاكتين، وفسفوليبيدات، وبوليمرية، وغيرها. احتل قطاع الصفوروليبيد أكبر حصة سوقية في عام 2022. الصفوروليبيدات هي فئة من المواد الخافضة للتوتر السطحي الجليكوليبيدية التي تنتجها الخميرة، وخاصة الكانديدا بومبيكولا. تمتلك هذه الجزيئات خصائص سطحية ممتازة، مما يجعلها قيمة في تطبيقات مختلفة مثل منتجات العناية الشخصية والمنظفات والمواد المضافة للأغذية والمستحضرات الصيدلانية وإصلاح البيئة. في مستحضرات التجميل، اكتسبت الصفوروليبيدات قوة كمستحلبات طبيعية وقابلة للتحلل البيولوجي وعوامل رغوية. تتوافق قدرتها على تثبيت التركيبات مع كونها لطيفة على الجلد مع تفضيل المستهلك المتزايد للمنتجات الصديقة للبيئة والصديقة للبشرة. بناءً على التطبيق، يتم تقسيم سوق المواد الخافضة للتوتر السطحي إلى المنظفات المنزلية، والعناية الشخصية، والمنظفات الصناعية والمؤسسية، ومعالجة الأغذية، والمواد الكيميائية لحقول النفط، ومعالجة الجلود، والزراعة، والمستحضرات الصيدلانية، وغيرها. كانت حصة قطاع المنظفات المنزلية في سوق المواد الخافضة للتوتر السطحي ملحوظة في عام 2022. أظهرت المواد الخافضة للتوتر السطحي نتائج فعالة في تنظيف الأسطح الصلبة وتركيبات مساعدات غسيل الأطباق الآلية. ويرجع هذا جزئيًا إلى ملف الرغوة المنخفض وخصائص نشاط السطح، والتي قد تكون مثيرة للاهتمام في تطبيقات إضافية. فهي تجمع بين ملف بيئي متميز وكفاءة ممتازة وبالتالي فهي مناسبة للاستخدام في السلع التجارية المنزلية.
التحليل الإقليمي:
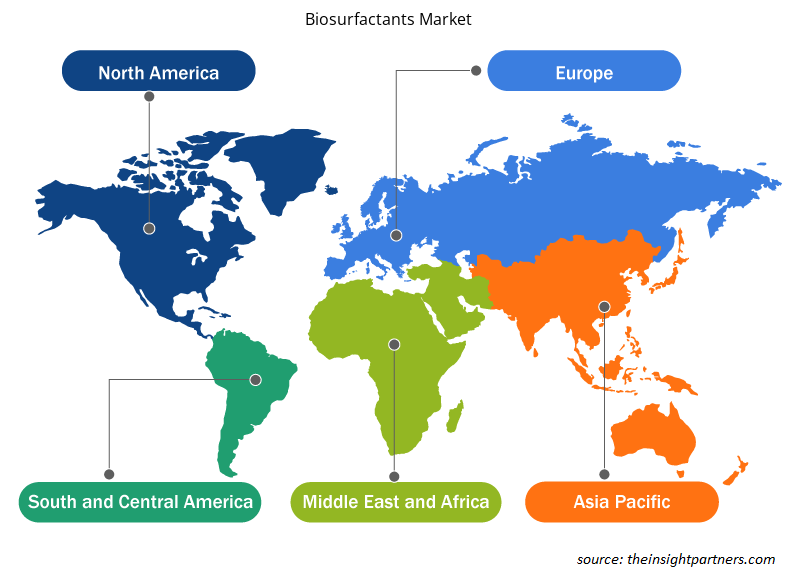
تم تقسيم سوق المواد الخافضة للتوتر السطحي إلى خمس مناطق رئيسية - أمريكا الشمالية وأوروبا وآسيا والمحيط الهادئ وأمريكا الجنوبية والوسطى والشرق الأوسط وأفريقيا. سيطرت أوروبا على سوق المواد الخافضة للتوتر السطحي العالمية، وبلغت قيمة السوق الإقليمية حوالي 300 مليون دولار أمريكي في عام 2022. كما تعد أمريكا الشمالية مساهمًا رئيسيًا، حيث تمتلك حصة كبيرة من حصة سوق المواد الخافضة للتوتر السطحي العالمية. ومن المتوقع أن يصل سوق أمريكا الشمالية إلى أكثر من 340 مليون دولار أمريكي في عام 2030. ومن المتوقع أن تسجل منطقة آسيا والمحيط الهادئ معدل نمو سنوي مركب كبير يتجاوز 7٪ من عام 2022 إلى عام 2030. يتم تقسيم سوق المواد الخافضة للتوتر السطحي في منطقة آسيا والمحيط الهادئ، حسب البلد، إلى أستراليا والصين والهند واليابان وكوريا الجنوبية وبقية منطقة آسيا والمحيط الهادئ. يتم دفع السوق بعوامل مثل الطلب المتزايد من صناعة المنظفات ومنتجات التنظيف والوعي المتزايد بشأن المزايا المرتبطة باستخدام المواد الخافضة للتوتر السطحي. اكتسبت هذه المواد الخافضة للتوتر السطحي المتوافقة بيولوجيًا والصديقة للبيئة زخمًا كبيرًا بسبب تطبيقاتها المتنوعة في الصناعات مثل العناية الشخصية والمستحضرات الصيدلانية والزراعة واستخراج النفط. ومن المتوقع أن يؤدي الوعي المتزايد بشأن التقنيات المستدامة والخضراء إلى دفع الطلب على المواد الخافضة للتوتر السطحي بسبب فعاليتها في الحد من التأثير البيئي. علاوة على ذلك، دفع التركيز المتزايد على تقليل الاعتماد على المواد الخافضة للتوتر السطحي التقليدية القائمة على البتروكيماويات الشركات في منطقة آسيا والمحيط الهادئ إلى الاستثمار في البحث والتطوير وإنتاج هذه البدائل القائمة على المواد الحيوية
رؤى إقليمية حول سوق المواد الخافضة للتوتر السطحي
لقد قام المحللون في Insight Partners بشرح الاتجاهات والعوامل الإقليمية المؤثرة على سوق المواد الخافضة للتوتر السطحي طوال فترة التوقعات بشكل شامل. يناقش هذا القسم أيضًا قطاعات سوق المواد الخافضة للتوتر السطحي والجغرافيا في جميع أنحاء أمريكا الشمالية وأوروبا ومنطقة آسيا والمحيط الهادئ والشرق الأوسط وأفريقيا وأمريكا الجنوبية والوسطى.

- احصل على البيانات الإقليمية المحددة لسوق المواد الخافضة للتوتر السطحي
نطاق تقرير سوق المواد الخافضة للتوتر السطحي الحيوية
| سمة التقرير | تفاصيل |
|---|---|
| حجم السوق في عام 2022 | 811.08 مليون دولار أمريكي |
| حجم السوق بحلول عام 2030 | 1,311.48 مليون دولار أمريكي |
| معدل النمو السنوي المركب العالمي (2022 - 2030) | 6.2% |
| البيانات التاريخية | 2020-2021 |
| فترة التنبؤ | 2023-2030 |
| القطاعات المغطاة | حسب النوع
|
| المناطق والدول المغطاة | أمريكا الشمالية
|
| قادة السوق وملفات تعريف الشركات الرئيسية |
|
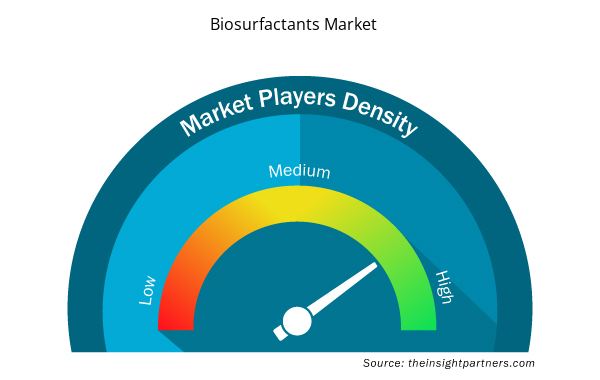
كثافة اللاعبين في سوق المواد الخافضة للتوتر السطحي: فهم تأثيرها على ديناميكيات الأعمال
يشهد سوق المواد الخافضة للتوتر السطحي نموًا سريعًا، مدفوعًا بالطلب المتزايد من المستخدم النهائي بسبب عوامل مثل تفضيلات المستهلكين المتطورة والتقدم التكنولوجي والوعي المتزايد بفوائد المنتج. ومع ارتفاع الطلب، تعمل الشركات على توسيع عروضها والابتكار لتلبية احتياجات المستهلكين والاستفادة من الاتجاهات الناشئة، مما يؤدي إلى زيادة نمو السوق.
تشير كثافة اللاعبين في السوق إلى توزيع الشركات أو المؤسسات العاملة في سوق أو صناعة معينة. وهي تشير إلى عدد المنافسين (اللاعبين في السوق) الموجودين في مساحة سوق معينة نسبة إلى حجمها أو قيمتها السوقية الإجمالية.
الشركات الرئيسية العاملة في سوق المواد الخافضة للتوتر السطحي هي:
- شركة داو،
- شركة الحلول الكربونية المتحالفة المحدودة
- شركة سرايا المحدودة
- شركة إيفونيك للصناعات
- باسف اس اي
إخلاء المسؤولية : الشركات المذكورة أعلاه ليست مرتبة بأي ترتيب معين.

- احصل على نظرة عامة على أهم اللاعبين الرئيسيين في سوق المواد الخافضة للتوتر السطحي
تطورات الصناعة والفرص المستقبلية:
فيما يلي قائمة بالمبادرات المختلفة التي اتخذها اللاعبون الرئيسيون العاملون في سوق المواد الخافضة للتوتر السطحي:
- في مارس 2023، أعلنت شركة Holiferm Ltd وSasol Chemicals، وهي وحدة أعمال تابعة لشركة Sasol Ltd، عن تعاون لإنتاج وتسويق رامنوليبيدات ودهون مانوسيل إريثريتول (MELs). يعمل هذا التعاون على توسيع الشراكة التي تم الإعلان عنها في مارس 2022 بين الشركتين لتطوير وتسويق منتج آخر من المواد الخافضة للتوتر السطحي، وهو السوفوروليبيدات.
تأثير كوفيد-19:
أثرت جائحة كوفيد-19 على العديد من الصناعات في العديد من البلدان. أعاقت عمليات الإغلاق والقيود على السفر وإغلاق الشركات في أمريكا الشمالية وأوروبا ومنطقة آسيا والمحيط الهادئ وأمريكا الجنوبية والوسطى والشرق الأوسط وأفريقيا نمو العديد من الصناعات، بما في ذلك صناعة الكيماويات والمواد. أدى إغلاق وحدات التصنيع إلى اضطراب سلاسل التوريد العالمية وأنشطة التصنيع وجداول التسليم ومبيعات المنتجات الأساسية وغير الأساسية. أفادت العديد من الشركات بتأخيرات في تسليم المنتجات وانخفاض في مبيعات منتجاتها في عام 2020. وبسبب الركود الاقتصادي الناجم عن الوباء، أصبح المستهلكون حذرين وانتقائيين في قرارات الشراء. قلل المستهلكون بشكل كبير من المشتريات غير الأساسية بسبب انخفاض الدخول وآفاق الكسب غير المؤكدة، وخاصة في المناطق النامية. واجهت العديد من الشركات المصنعة للمواد الخافضة للتوتر السطحي انخفاضًا في الأرباح بسبب انخفاض الطلب من المستهلكين خلال المرحلة الأولية من الوباء. ومع ذلك، بحلول نهاية عام 2021، تم تطعيم العديد من البلدان بالكامل، وأعلنت حكومات دول مختلفة عن تخفيف بعض القيود التنظيمية، بما في ذلك عمليات الإغلاق وحظر السفر. بدأ الناس في السفر إلى أماكن مختلفة، مما أدى إلى زيادة الطلب على المواد الخافضة للتوتر السطحي. كل هذه العوامل تعزز نمو سوق المواد الخافضة للتوتر السطحي في مختلف المناطق.
المنافسة والشركات الرئيسية:
تعد شركة Dow Inc، وAllied Carbon Solutions Co Ltd، وSaraya Co Ltd، وEvonik Industries AG، وBASF SE، وSabo SPA، وHoliferm Ltd، وStepan Co، وDeguan Biosurfactant Supplier، وJeneil Bioproducts GmbH من بين اللاعبين البارزين الذين يعملون في سوق المواد الخافضة للتوتر السطحي العالمية. تقدم هذه الشركات المواد الخافضة للتوتر السطحي عالية الجودة وتلبي احتياجات العديد من المستهلكين في السوق العالمية.
- التحليل التاريخي (سنتان)، السنة الأساسية، التوقعات (7 سنوات) مع معدل النمو السنوي المركب
- تحليل PEST و SWOT
- حجم السوق والقيمة / الحجم - عالميًا وإقليميًا وقطريًا
- الصناعة والمنافسة
- مجموعة بيانات Excel


Report Coverage
Revenue forecast, Company Analysis, Industry landscape, Growth factors, and Trends

Segment Covered
This text is related
to segments covered.

Regional Scope
North America, Europe, Asia Pacific, Middle East & Africa, South & Central America

Country Scope
This text is related
to country scope.
الأسئلة الشائعة
Europe accounted for the largest share of the global biosurfactants market. Europe is one of the most significant regions for the biosurfactants market owing to drastic preference towards ecofriendly biosurfactants.
Biosurfactants offer several advantages over chemical surfactants, such as high biodegradability, diversity of biological properties, and renewable characteristics being synthesized as a mixture of different molecules. Biosurfactants have various properties, including antimicrobial and antioxidant activity, that allow their application in different industries, such as detergents and personal care. They are also highly efficient in reducing surface and interfacial tensions.
Based on type, the biosurfactants market is segmented into sophorolipid, rhamnolipid, mannosylerythritol lipids (MELs), alkyl polyglucosides (APGs), surfactin, phospholipids, polymeric, and others. The sophorolipid segment held the largest market share in 2022. Sophorolipids are a class of glycolipid biosurfactants produced by yeast, primarily Candida bombicola. These molecules possess excellent surface-active properties, making them valuable in various applications such as personal care products, detergents, food additives, pharmaceuticals, and environmental remediation.
The major players operating in the global biosurfactants market are Dow Inc, Allied Carbon Solutions Co Ltd, Saraya Co Ltd, Evonik Industries AG, BASF SE, Sabo SPA, Holiferm Ltd, Stepan Co, Deguan Biosurfactant Supplier, and Jeneil Bioproducts GmbH.
Based on application, the biosurfactants market is segmented into household detergents, personal care, industrial and institutional cleaners, food processing, oilfield chemicals, leather processing, agriculture, pharmaceuticals, and others. The biosurfactants market share for the household detergents segment was notable in 2022. Biosurfactants have shown effective results in hard surface cleaning and automated dishwashing aid formulations.
The personal care & cosmetics industry is growing significantly as people increasingly buy personal care and beauty products. In recent years, there has been a growth in the use of different cosmetic products among both male and female consumers in their daily routines. The personal care and cosmetic product manufacturers focus on product branding, advertising, and new product launch strategies to increase product sales. The e-commerce industry in many countries has been witnessing a rising growth curve, further boosting the sales of personal care and cosmetic products across the globe.
Trends and growth analysis reports related to Chemicals and Materials : READ MORE..
The List of Companies - Biosurfactants Market
- Dow Inc,
- Allied Carbon Solutions Co Ltd
- Saraya Co Ltd
- Evonik Industries AG
- BASF SE
- Sabo SPA
- Holiferm Ltd
- Stepan Co
- Deguan Biosurfactant Supplier
- Jeneil Bioproducts GmbH
The Insight Partners performs research in 4 major stages: Data Collection & Secondary Research, Primary Research, Data Analysis and Data Triangulation & Final Review.
- Data Collection and Secondary Research:
As a market research and consulting firm operating from a decade, we have published and advised several client across the globe. First step for any study will start with an assessment of currently available data and insights from existing reports. Further, historical and current market information is collected from Investor Presentations, Annual Reports, SEC Filings, etc., and other information related to company’s performance and market positioning are gathered from Paid Databases (Factiva, Hoovers, and Reuters) and various other publications available in public domain.
Several associations trade associates, technical forums, institutes, societies and organization are accessed to gain technical as well as market related insights through their publications such as research papers, blogs and press releases related to the studies are referred to get cues about the market. Further, white papers, journals, magazines, and other news articles published in last 3 years are scrutinized and analyzed to understand the current market trends.
- Primary Research:
The primarily interview analysis comprise of data obtained from industry participants interview and answers to survey questions gathered by in-house primary team.
For primary research, interviews are conducted with industry experts/CEOs/Marketing Managers/VPs/Subject Matter Experts from both demand and supply side to get a 360-degree view of the market. The primary team conducts several interviews based on the complexity of the markets to understand the various market trends and dynamics which makes research more credible and precise.
A typical research interview fulfils the following functions:
- Provides first-hand information on the market size, market trends, growth trends, competitive landscape, and outlook
- Validates and strengthens in-house secondary research findings
- Develops the analysis team’s expertise and market understanding
Primary research involves email interactions and telephone interviews for each market, category, segment, and sub-segment across geographies. The participants who typically take part in such a process include, but are not limited to:
- Industry participants: VPs, business development managers, market intelligence managers and national sales managers
- Outside experts: Valuation experts, research analysts and key opinion leaders specializing in the electronics and semiconductor industry.
Below is the breakup of our primary respondents by company, designation, and region:

Once we receive the confirmation from primary research sources or primary respondents, we finalize the base year market estimation and forecast the data as per the macroeconomic and microeconomic factors assessed during data collection.
- Data Analysis:
Once data is validated through both secondary as well as primary respondents, we finalize the market estimations by hypothesis formulation and factor analysis at regional and country level.
- Macro-Economic Factor Analysis:
We analyse macroeconomic indicators such the gross domestic product (GDP), increase in the demand for goods and services across industries, technological advancement, regional economic growth, governmental policies, the influence of COVID-19, PEST analysis, and other aspects. This analysis aids in setting benchmarks for various nations/regions and approximating market splits. Additionally, the general trend of the aforementioned components aid in determining the market's development possibilities.
- Country Level Data:
Various factors that are especially aligned to the country are taken into account to determine the market size for a certain area and country, including the presence of vendors, such as headquarters and offices, the country's GDP, demand patterns, and industry growth. To comprehend the market dynamics for the nation, a number of growth variables, inhibitors, application areas, and current market trends are researched. The aforementioned elements aid in determining the country's overall market's growth potential.
- Company Profile:
The “Table of Contents” is formulated by listing and analyzing more than 25 - 30 companies operating in the market ecosystem across geographies. However, we profile only 10 companies as a standard practice in our syndicate reports. These 10 companies comprise leading, emerging, and regional players. Nonetheless, our analysis is not restricted to the 10 listed companies, we also analyze other companies present in the market to develop a holistic view and understand the prevailing trends. The “Company Profiles” section in the report covers key facts, business description, products & services, financial information, SWOT analysis, and key developments. The financial information presented is extracted from the annual reports and official documents of the publicly listed companies. Upon collecting the information for the sections of respective companies, we verify them via various primary sources and then compile the data in respective company profiles. The company level information helps us in deriving the base number as well as in forecasting the market size.
- Developing Base Number:
Aggregation of sales statistics (2020-2022) and macro-economic factor, and other secondary and primary research insights are utilized to arrive at base number and related market shares for 2022. The data gaps are identified in this step and relevant market data is analyzed, collected from paid primary interviews or databases. On finalizing the base year market size, forecasts are developed on the basis of macro-economic, industry and market growth factors and company level analysis.
- Data Triangulation and Final Review:
The market findings and base year market size calculations are validated from supply as well as demand side. Demand side validations are based on macro-economic factor analysis and benchmarks for respective regions and countries. In case of supply side validations, revenues of major companies are estimated (in case not available) based on industry benchmark, approximate number of employees, product portfolio, and primary interviews revenues are gathered. Further revenue from target product/service segment is assessed to avoid overshooting of market statistics. In case of heavy deviations between supply and demand side values, all thes steps are repeated to achieve synchronization.
We follow an iterative model, wherein we share our research findings with Subject Matter Experts (SME’s) and Key Opinion Leaders (KOLs) until consensus view of the market is not formulated – this model negates any drastic deviation in the opinions of experts. Only validated and universally acceptable research findings are quoted in our reports.
We have important check points that we use to validate our research findings – which we call – data triangulation, where we validate the information, we generate from secondary sources with primary interviews and then we re-validate with our internal data bases and Subject matter experts. This comprehensive model enables us to deliver high quality, reliable data in shortest possible time.


 احصل على عينة مجانية لهذا التقرير