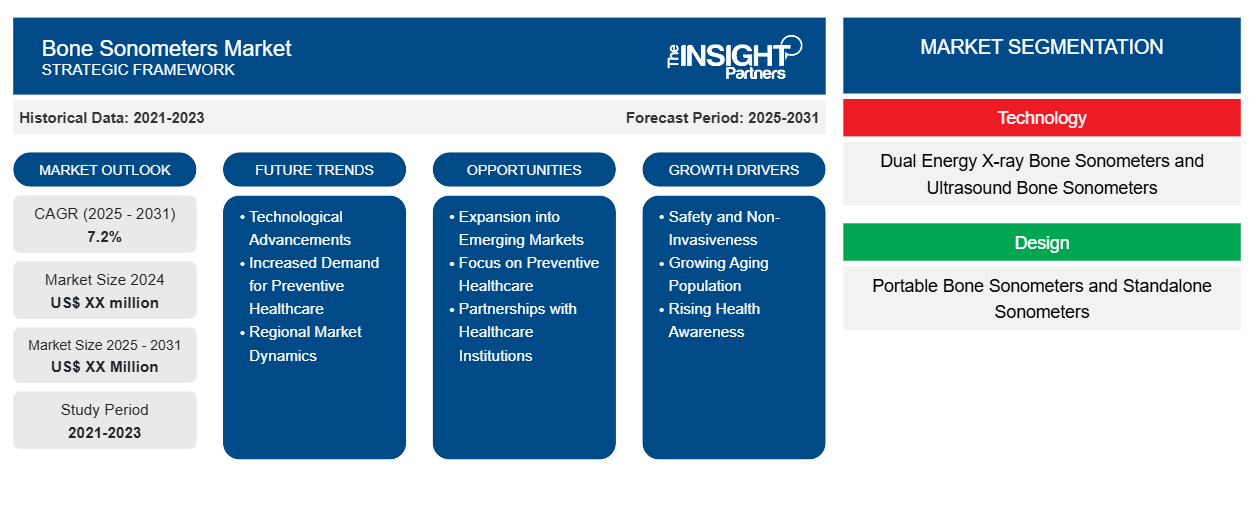
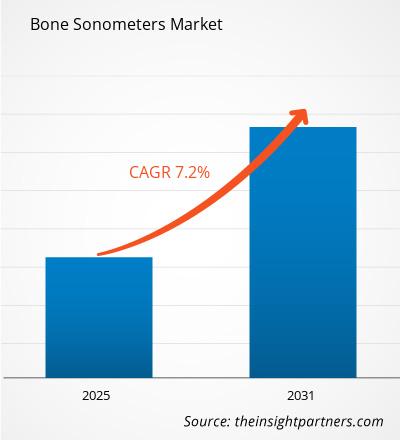
من المتوقع أن يسجل سوق أجهزة قياس سونومتر العظام معدل نمو سنوي مركب بنسبة 7.2٪ من عام 2023 إلى عام 2031، مع توسع حجم السوق من XX مليون دولار أمريكي في عام 2023 إلى XX مليون دولار أمريكي بحلول عام 2031.
تم تقسيم التقرير حسب التكنولوجيا (أجهزة قياس سونومتر العظام بالأشعة السينية ثنائية الطاقة وأجهزة قياس سونومتر العظام بالموجات فوق الصوتية)، وحسب التصميم (أجهزة قياس سونومتر العظام المحمولة وأجهزة قياس سونومتر مستقلة)، وحسب المستخدم النهائي (المستشفيات ومراكز الجراحة الخارجية والعيادات وغيرها). كما تم تقسيم التحليل العالمي إلى مستويات إقليمية ودول رئيسية. ويقدم التقرير القيمة بالدولار الأمريكي للتحليل والقطاعات المذكورة أعلاه.
غرض التقرير
يهدف تقرير سوق أجهزة قياس سونوميتر العظام الصادر عن The Insight Partners إلى وصف المشهد الحالي والنمو المستقبلي وأهم العوامل الدافعة والتحديات والفرص. وسيوفر هذا رؤى لمختلف أصحاب المصلحة في الأعمال التجارية، مثل:
- مزودي/مصنعي التكنولوجيا: لفهم ديناميكيات السوق المتطورة ومعرفة فرص النمو المحتملة، وتمكينهم من اتخاذ قرارات استراتيجية مستنيرة.
- المستثمرون: إجراء تحليل شامل للاتجاهات فيما يتعلق بمعدل نمو السوق، وتوقعات السوق المالية، والفرص المتاحة عبر سلسلة القيمة.
- الهيئات التنظيمية: لتنظيم السياسات ومراقبة الأنشطة في السوق بهدف تقليل الانتهاكات والحفاظ على ثقة المستثمرين ودعم سلامة السوق واستقرارها.
تجزئة سوق أجهزة قياس سونومتر العظام
تكنولوجيا
- أجهزة قياس سونار العظام بالأشعة السينية ثنائية الطاقة وأجهزة قياس سونار العظام بالموجات فوق الصوتية
تصميم
- أجهزة قياس سونومتر العظام المحمولة وأجهزة قياس سونومتر مستقلة
المستخدم النهائي
- المستشفيات
- مراكز الجراحة الخارجية
- العيادات
- آحرون
الجغرافيا
- أمريكا الشمالية
- أوروبا
- آسيا والمحيط الهادئ
- أمريكا الجنوبية والوسطى
- الشرق الأوسط وأفريقيا
الجغرافيا
- أمريكا الشمالية
- أوروبا
- آسيا والمحيط الهادئ
- أمريكا الجنوبية والوسطى
- الشرق الأوسط وأفريقيا
قم بتخصيص هذا التقرير ليناسب متطلباتك
ستحصل على تخصيص لأي تقرير - مجانًا - بما في ذلك أجزاء من هذا التقرير، أو تحليل على مستوى الدولة، وحزمة بيانات Excel، بالإضافة إلى الاستفادة من العروض والخصومات الرائعة للشركات الناشئة والجامعات
سوق أجهزة قياس سونوغرافيا العظام: رؤى استراتيجية
- احصل على أهم اتجاهات السوق الرئيسية لهذا التقرير.ستتضمن هذه العينة المجانية تحليلاً للبيانات، بدءًا من اتجاهات السوق وحتى التقديرات والتوقعات.
عوامل نمو سوق أجهزة قياس سونوميتر العظام
- السلامة وعدم التدخل: عدم التدخل والسلامة من حيث قياس الجرعات توفر أجهزة قياس كثافة العظام مزايا أكثر أهمية مقارنة بأي طرق قياس كثافة تقليدية أخرى، مثل قياس امتصاص الأشعة السينية ثنائية الطاقة (DXA)، والتي تزيد من مخاطر التعرض. أولاً، إنها عملية غير جراحية تقلل من التعرض للإشعاع، مما يجعلها أكثر فائدة لفئات معينة من الجمهور الذين يخضعون لفحوصات منتظمة، على سبيل المثال، كبار السن والأشخاص الذين يعانون من هشاشة العظام.
- النمو السكاني المتقدم في السن: أحد العوامل الحاسمة التي تدفع إلى زيادة حجم السوق هو ارتفاع عدد حالات هشاشة العظام والأمراض الأخرى المرتبطة بالعظام والتي تؤثر بشكل أكبر على كبار السن. وذلك لأن جانب العرض سيكون قادرًا على توفير المرافق التي تهدف إلى مراقبة صحة عظام الأفراد، وخاصة مع الزيادة المتوقعة في عدد السكان المسنين.
- الوعي الصحي المتزايد: لقد كان هناك وعي متزايد بصحة العظام، وخاصة الحاجة إلى التعرف على مضاعفات كثافة العظام "في الوقت المناسب" لإيجاد حلول عملية. وهذا يعالج المستويات المتزايدة من الفحص والاختبارات التشخيصية، ومن ثم الحاجة إلى أجهزة قياس كثافة العظام.
الاتجاهات المستقبلية لسوق أجهزة قياس سونوميتر العظام
- التطورات التكنولوجية: تعمل تقنية الموجات فوق الصوتية على تعزيز قدرات أجهزة قياس سونار العظام. وتشهد هذه الأجهزة الحديثة ارتفاعًا في الطلب لأنها توفر دقة أفضل وقابلية للحمل وسهولة في الاستخدام، وهي عوامل أساسية للاستخدام السريري والمنزلي. ومن المرجح أن تساهم أساليب التصوير المتقدمة وتقييم البيانات المباشرة بشكل أكبر في اختراق السوق.
- زيادة الطلب على الرعاية الصحية الوقائية: هناك تركيز متزايد على الرعاية الصحية الوقائية، وخاصة بين كبار السن فيما يتعلق بصحة العظام. ومن المتوقع أن يشهد السوق العالمي لتقنيات فحص كثافة العظام غير الجراحية، مثل قياس توتر العظام، نموًا مع رغبة المزيد من الأشخاص في اكتشاف الأمراض في المراحل المبكرة. وهذا يتوافق مع انخفاض حالات الكسور والمضاعفات المرتبطة بالكسور في استراتيجيات الرعاية الصحية المتنوعة.
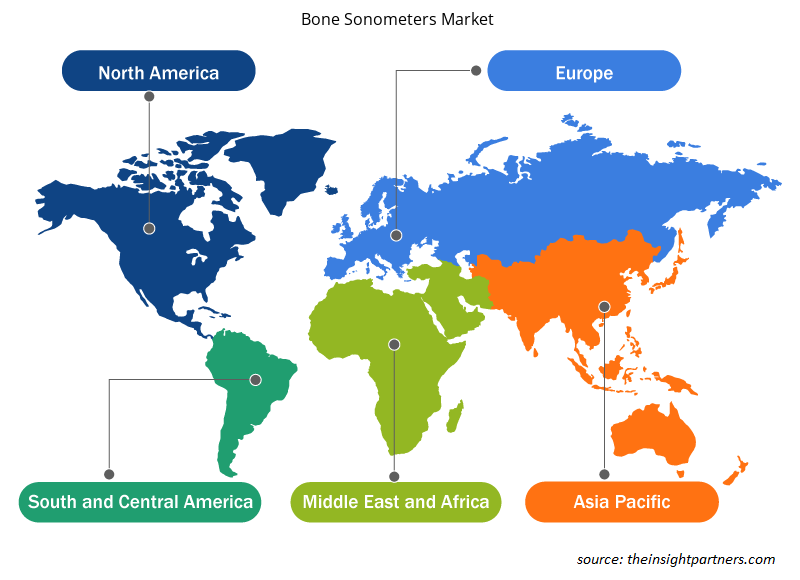
- ديناميكيات السوق الإقليمية: في الوقت الحاضر، تعد أمريكا الشمالية المنطقة المهيمنة على أعمال سونار العظام، حيث يتميز السوق بالإنفاق المرتفع على الرعاية الصحية والتكنولوجيا الطبية المتطورة. ومع ذلك، نظرًا لارتفاع الإنفاق على الرعاية الصحية والمخاوف المتزايدة بشأن هشاشة العظام، أصبحت البلدان في منطقة آسيا والمحيط الهادئ أسواقًا أساسية.
فرص سوق أجهزة قياس سونومتر العظام
- التوسع في الأسواق الناشئة: مع التقدم المحرز في البنية الأساسية للرعاية الصحية في الدول النامية، هناك حاجة متزايدة إلى أدوات تشخيصية عملية ومنخفضة التكلفة. إن أجهزة قياس الموجات فوق الصوتية للعظام غير جراحية ولا تستخدم الإشعاع، مما يجعلها الأدوات المثالية لمثل هذه الأسواق. ويمكن الاستفادة من ذلك من خلال إنشاء شبكة توزيع والتعاون مع مقدمي الرعاية الصحية المحليين.
- التركيز على الرعاية الصحية الوقائية: مع صعود الطب الوقائي، هناك أيضًا مجال للأدوات التي تساعد في الكشف المبكر عن المشاكل المرتبطة بالعظام. يمكن أن تكون أجهزة قياس الموجات فوق الصوتية للعظام مفيدة في الفحوصات الروتينية للسكان المعرضين للخطر مثل الفئة العمرية بعد انقطاع الطمث، وعادةً ما تكون النساء وكبار السن. سيكون وضع هذه الأجهزة كمعدات رعاية صحية وقائية مفيدًا في العديد من الممارسات لأنها ستلفت انتباه مقدمي الرعاية الصحية والمرضى.
- الشراكات مع مؤسسات الرعاية الصحية: يمكن للمستشفيات والعيادات ومراكز الأبحاث المساعدة في تقييم الحاجة إلى استخدام أجهزة قياس الموجات فوق الصوتية للعظام وتعزيز استخدامها. كما يمكن لمثل هذه التعاونات أن تمهد الطريق للتجارب السريرية التي تساعد في إثبات الفائدة السريرية لهذه الأجهزة، مما يجعلها أكثر احترامًا وقبولًا من قبل نظام الرعاية الصحية.
رؤى إقليمية حول سوق أجهزة قياس سونوغرافيا العظام
لقد قام المحللون في Insight Partners بشرح الاتجاهات والعوامل الإقليمية المؤثرة على سوق أجهزة قياس سونوميتر العظام طوال فترة التوقعات بشكل شامل. يناقش هذا القسم أيضًا قطاعات سوق أجهزة قياس سونوميتر العظام والجغرافيا في جميع أنحاء أمريكا الشمالية وأوروبا ومنطقة آسيا والمحيط الهادئ والشرق الأوسط وأفريقيا وأمريكا الجنوبية والوسطى.
- احصل على البيانات الإقليمية المحددة لسوق أجهزة قياس سونومتر العظام
نطاق تقرير سوق أجهزة قياس سونومتر العظام
| سمة التقرير | تفاصيل |
|---|---|
| حجم السوق في عام 2023 | XX مليون دولار أمريكي |
| حجم السوق بحلول عام 2031 | XX مليون دولار أمريكي |
| معدل النمو السنوي المركب العالمي (2023 - 2031) | 7.2% |
| البيانات التاريخية | 2021-2022 |
| فترة التنبؤ | 2024-2031 |
| القطاعات المغطاة | حسب التكنولوجيا
|
| المناطق والدول المغطاة | أمريكا الشمالية
|
| قادة السوق وملفات تعريف الشركات الرئيسية |
|
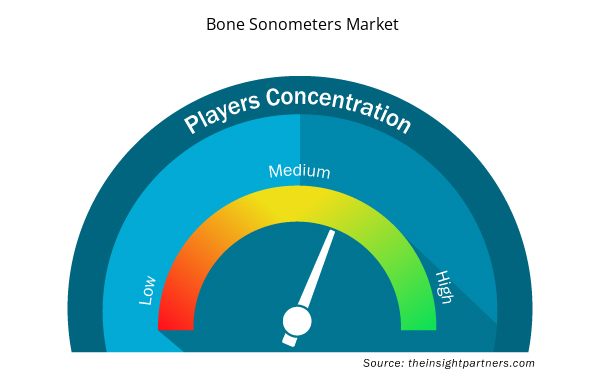
كثافة اللاعبين في سوق أجهزة قياس سونوميتر العظام: فهم تأثيرها على ديناميكيات الأعمال
يشهد سوق أجهزة قياس سونوميتر العظام نموًا سريعًا، مدفوعًا بالطلب المتزايد من جانب المستخدم النهائي بسبب عوامل مثل تفضيلات المستهلكين المتطورة والتقدم التكنولوجي والوعي المتزايد بفوائد المنتج. ومع ارتفاع الطلب، تعمل الشركات على توسيع عروضها والابتكار لتلبية احتياجات المستهلكين والاستفادة من الاتجاهات الناشئة، مما يؤدي إلى زيادة نمو السوق.
تشير كثافة اللاعبين في السوق إلى توزيع الشركات أو المؤسسات العاملة في سوق أو صناعة معينة. وهي تشير إلى عدد المنافسين (اللاعبين في السوق) الموجودين في مساحة سوق معينة نسبة إلى حجمها أو قيمتها السوقية الإجمالية.
الشركات الرئيسية العاملة في سوق أجهزة قياس سونومتر العظام هي:
- شركة هولوجيك
- إيكو لايت
- تصوير DMS
- شركة أوستيوسيز المحدودة
- شركة بيم ميد المحدودة
إخلاء المسؤولية : الشركات المذكورة أعلاه ليست مرتبة بأي ترتيب معين.
- احصل على نظرة عامة على أهم اللاعبين الرئيسيين في سوق أجهزة قياس سونوميتر العظام
نقاط البيع الرئيسية
- التغطية الشاملة: يغطي التقرير بشكل شامل تحليل المنتجات والخدمات والأنواع والمستخدمين النهائيين لسوق أجهزة قياس سونوميتر العظام، مما يوفر صورة شاملة.
- تحليل الخبراء: تم تجميع التقرير على أساس الفهم العميق لخبراء الصناعة والمحللين.
- معلومات محدثة: يضمن التقرير أهمية الأعمال التجارية بسبب تغطيته للمعلومات الحديثة واتجاهات البيانات.
- خيارات التخصيص: يمكن تخصيص هذا التقرير لتلبية متطلبات العملاء المحددة وبما يتناسب مع استراتيجيات العمل بشكل مناسب.
وبالتالي، يمكن أن يساعد تقرير البحث حول سوق أجهزة قياس عظام العظام في تمهيد الطريق لفك شفرة وفهم سيناريو الصناعة وآفاق النمو. ورغم وجود بعض المخاوف المشروعة، فإن الفوائد الإجمالية لهذا التقرير تميل إلى التفوق على العيوب.
- التحليل التاريخي (سنتان)، السنة الأساسية، التوقعات (7 سنوات) مع معدل النمو السنوي المركب
- تحليل PEST و SWOT
- حجم السوق والقيمة / الحجم - عالميًا وإقليميًا وقطريًا
- الصناعة والمنافسة
- مجموعة بيانات Excel


Report Coverage
Revenue forecast, Company Analysis, Industry landscape, Growth factors, and Trends

Segment Covered
This text is related
to segments covered.

Regional Scope
North America, Europe, Asia Pacific, Middle East & Africa, South & Central America

Country Scope
This text is related
to country scope.
الأسئلة الشائعة
Hologic, Inc., BeamMed Ltd, Osteometer Meditech, DMS Imaging are the major companies operating in the Bone Sonometers Market
Asia Pacific is estimated to grow at the highest CAGR over the forecast year (2023 - 2031)
The North America region accounts for highest revenue share Bone Sonometers Market
The final report will duly include market size and projection estimates for all the segments from 2021 to 2031, along with a revenue share and compound annual growth rate (%) for the regional
/
country-wise market wherein 2021-2022 are the historic years, 2023 is considered to be the base year, and the forecast will be provided till 2031, along with CAGR (%)
Rising Health Awareness is the major factors boosting the Bone Sonometers Market growth
The market is expected to grow at a CAGR of 7.2%
Trends and growth analysis reports related to Life Sciences : READ MORE..
1. Hologic, Inc.
2. Echolight
3. DMS Imaging
4. Osteocys Co. Ltd.
5. BeamMed Ltd
6. Medilink
7. Furuno Electric Co.
8. General Electric
9. Swissray
10. Osteometer Meditech
The Insight Partners performs research in 4 major stages: Data Collection & Secondary Research, Primary Research, Data Analysis and Data Triangulation & Final Review.
- Data Collection and Secondary Research:
As a market research and consulting firm operating from a decade, we have published and advised several client across the globe. First step for any study will start with an assessment of currently available data and insights from existing reports. Further, historical and current market information is collected from Investor Presentations, Annual Reports, SEC Filings, etc., and other information related to company’s performance and market positioning are gathered from Paid Databases (Factiva, Hoovers, and Reuters) and various other publications available in public domain.
Several associations trade associates, technical forums, institutes, societies and organization are accessed to gain technical as well as market related insights through their publications such as research papers, blogs and press releases related to the studies are referred to get cues about the market. Further, white papers, journals, magazines, and other news articles published in last 3 years are scrutinized and analyzed to understand the current market trends.
- Primary Research:
The primarily interview analysis comprise of data obtained from industry participants interview and answers to survey questions gathered by in-house primary team.
For primary research, interviews are conducted with industry experts/CEOs/Marketing Managers/VPs/Subject Matter Experts from both demand and supply side to get a 360-degree view of the market. The primary team conducts several interviews based on the complexity of the markets to understand the various market trends and dynamics which makes research more credible and precise.
A typical research interview fulfils the following functions:
- Provides first-hand information on the market size, market trends, growth trends, competitive landscape, and outlook
- Validates and strengthens in-house secondary research findings
- Develops the analysis team’s expertise and market understanding
Primary research involves email interactions and telephone interviews for each market, category, segment, and sub-segment across geographies. The participants who typically take part in such a process include, but are not limited to:
- Industry participants: VPs, business development managers, market intelligence managers and national sales managers
- Outside experts: Valuation experts, research analysts and key opinion leaders specializing in the electronics and semiconductor industry.
Below is the breakup of our primary respondents by company, designation, and region:

Once we receive the confirmation from primary research sources or primary respondents, we finalize the base year market estimation and forecast the data as per the macroeconomic and microeconomic factors assessed during data collection.
- Data Analysis:
Once data is validated through both secondary as well as primary respondents, we finalize the market estimations by hypothesis formulation and factor analysis at regional and country level.
- Macro-Economic Factor Analysis:
We analyse macroeconomic indicators such the gross domestic product (GDP), increase in the demand for goods and services across industries, technological advancement, regional economic growth, governmental policies, the influence of COVID-19, PEST analysis, and other aspects. This analysis aids in setting benchmarks for various nations/regions and approximating market splits. Additionally, the general trend of the aforementioned components aid in determining the market's development possibilities.
- Country Level Data:
Various factors that are especially aligned to the country are taken into account to determine the market size for a certain area and country, including the presence of vendors, such as headquarters and offices, the country's GDP, demand patterns, and industry growth. To comprehend the market dynamics for the nation, a number of growth variables, inhibitors, application areas, and current market trends are researched. The aforementioned elements aid in determining the country's overall market's growth potential.
- Company Profile:
The “Table of Contents” is formulated by listing and analyzing more than 25 - 30 companies operating in the market ecosystem across geographies. However, we profile only 10 companies as a standard practice in our syndicate reports. These 10 companies comprise leading, emerging, and regional players. Nonetheless, our analysis is not restricted to the 10 listed companies, we also analyze other companies present in the market to develop a holistic view and understand the prevailing trends. The “Company Profiles” section in the report covers key facts, business description, products & services, financial information, SWOT analysis, and key developments. The financial information presented is extracted from the annual reports and official documents of the publicly listed companies. Upon collecting the information for the sections of respective companies, we verify them via various primary sources and then compile the data in respective company profiles. The company level information helps us in deriving the base number as well as in forecasting the market size.
- Developing Base Number:
Aggregation of sales statistics (2020-2022) and macro-economic factor, and other secondary and primary research insights are utilized to arrive at base number and related market shares for 2022. The data gaps are identified in this step and relevant market data is analyzed, collected from paid primary interviews or databases. On finalizing the base year market size, forecasts are developed on the basis of macro-economic, industry and market growth factors and company level analysis.
- Data Triangulation and Final Review:
The market findings and base year market size calculations are validated from supply as well as demand side. Demand side validations are based on macro-economic factor analysis and benchmarks for respective regions and countries. In case of supply side validations, revenues of major companies are estimated (in case not available) based on industry benchmark, approximate number of employees, product portfolio, and primary interviews revenues are gathered. Further revenue from target product/service segment is assessed to avoid overshooting of market statistics. In case of heavy deviations between supply and demand side values, all thes steps are repeated to achieve synchronization.
We follow an iterative model, wherein we share our research findings with Subject Matter Experts (SME’s) and Key Opinion Leaders (KOLs) until consensus view of the market is not formulated – this model negates any drastic deviation in the opinions of experts. Only validated and universally acceptable research findings are quoted in our reports.
We have important check points that we use to validate our research findings – which we call – data triangulation, where we validate the information, we generate from secondary sources with primary interviews and then we re-validate with our internal data bases and Subject matter experts. This comprehensive model enables us to deliver high quality, reliable data in shortest possible time.
 احصل على عينة مجانية لهذا التقرير