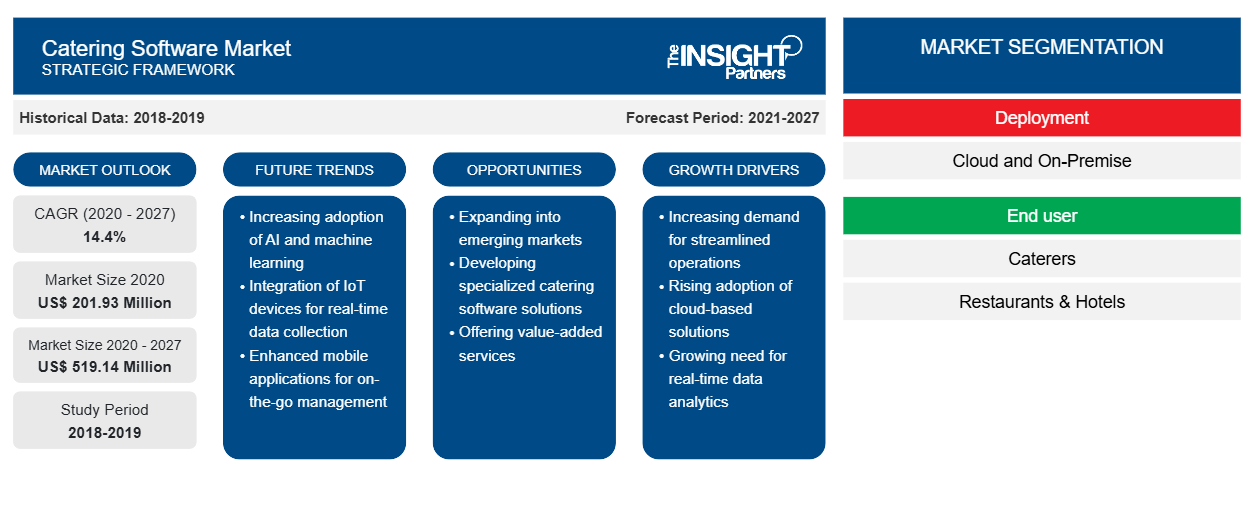
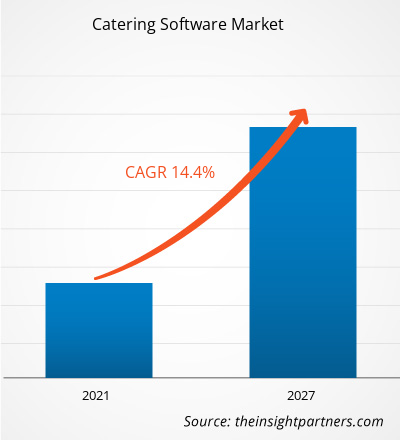
من المتوقع أن ينمو سوق برمجيات تقديم الطعام من 201.93 مليون دولار أمريكي في عام 2020 إلى 519.14 مليون دولار أمريكي بحلول عام 2027؛ ومن المتوقع أن ينمو بمعدل نمو سنوي مركب قدره 14.4٪ من عام 2020 إلى عام 2027.
إن استخدام تقنية تحليل البيانات الضخمة لتحسين عمليات تقديم الطعام يعزى إلى نمو السوق. تتمتع تقنية تحليل البيانات الضخمة بإمكانات هائلة لتحويل أعمال تقديم الطعام بالكامل. يساعد تبني حلول البيانات الضخمة في تحسين كفاءة شبكات التوزيع والإنتاج في صناعة تقديم الطعام بشكل عام. تسمح التكنولوجيا بتتبع العملية الكاملة لنقل الإمدادات. من خلال الرؤى في الوقت الفعلي، يمكن للعملاء تتبع أوامر الشراء الخاصة بهم على أجهزتهم والتحقق من حالة تقديم الطعام. يساعد دمج لوحة معلومات التحليلات في برنامج تقديم الطعام في تتبع وتقييم أداء وكلاء تقديم الطعام. أيضًا، يجب أن يكون لدى كل صاحب مصلحة في أعمال تقديم الطعام بيانات ذات صلة بمنتجاتهم، بما في ذلك البيانات المتعلقة بالمزارعين والشاحنين وتجار التجزئة، وانتهاءً بالمطاعم والمتاجر. على سبيل المثال، يستخدم مطعم كنتاكي أدوات البيانات الضخمة لتحليل ردود الفعل من العملاء وتفضيلات الطعام، مما يؤدي إلى تجارب أفضل للعملاء والمبيعات والأرباح.
لقد شهدت صناعة التجارة الإلكترونية في جميع المناطق تحولات عديدة خلال السنوات القليلة الماضية؛ وقد دفع نمو الصناعة اللاعبين في سوق برامج تقديم الطعام إلى الاستفادة من تحليلات البيانات الضخمة لاتخاذ قرارات عمل أكثر ذكاءً. تسمح التكنولوجيا لتجار التجزئة عبر الإنترنت بتقييم تفاعلات العملاء عبر القنوات مثل الأجهزة المحمولة ووسائل التواصل الاجتماعي ومواقع الويب.
قم بتخصيص هذا التقرير ليناسب متطلباتك
ستحصل على تخصيص لأي تقرير - مجانًا - بما في ذلك أجزاء من هذا التقرير، أو تحليل على مستوى الدولة، وحزمة بيانات Excel، بالإضافة إلى الاستفادة من العروض والخصومات الرائعة للشركات الناشئة والجامعات
سوق برمجيات تقديم الطعام:
- احصل على أهم اتجاهات السوق الرئيسية لهذا التقرير.ستتضمن هذه العينة المجانية تحليلاً للبيانات، بدءًا من اتجاهات السوق وحتى التقديرات والتوقعات.
تأثير جائحة كوفيد-19 على سوق برامج تقديم الطعام
في أعقاب تفشي جائحة كوفيد-19 على مستوى العالم، اضطرت بعض الشركات إلى تقليص عملياتها بسبب تدابير الاحتواء المختلفة التي أصدرتها الحكومات في جميع أنحاء العالم. دفع الانتشار السريع للفيروس الحكومات في جميع أنحاء العالم إلى فرض قيود صارمة على حركة الأشخاص والمركبات. لقد تضررت الشركات التي تعتمد على التفاعل المادي لتوليد الإيرادات بشدة بسبب عمليات الإغلاق. ونتيجة لذلك، تركز بعض الشركات على زيادة التحويلات والتفاعلات والإيرادات من خلال الوسائط الرقمية.lockdowns. As a result, some businesses are concentrating on increasing conversions, interactions, and revenue through digital media.
رؤى السوق - سوق برامج تقديم الطعام
التعلم الآلي سيحدث ثورة في مجال تقديم الطعام
في صناعة المطاعم، يؤدي عدم كفاية رسم الخرائط للمناطق، وعدم التوازن بين الطلب وتوافر الموارد إلى العديد من التحديات. يشكل التعلم الآلي والذكاء الاصطناعي أسس تقنيات تقديم الطعام من الجيل التالي. تمكن هذه التقنيات الأنظمة من التعلم من البيانات المسجلة، والتي تتألف من خوارزميات وأنماط ورؤى تنبؤية. تتبنى العديد من شركات توصيل الطعام عبر الإنترنت تقنية التعلم الآلي لتعزيز أعمال تقديم الطعام وزيادة كفاءة أعمالها. على سبيل المثال، تستثمر Deliveroo، وهي شركة توصيل طعام مقرها المملكة المتحدة، في تقنيات متقدمة مثل التعلم الآلي لتظل قادرة على المنافسة في السوق من خلال تقديم خدمة توصيل طعام أكثر فعالية. تستخدم Glovo، وهي شركة توصيل طعام مقرها إسبانيا، أيضًا التعلم الآلي للتنبؤ باحتمالية البقاء نشطًا على التطبيق. وبالتالي، من المتوقع أن يؤدي دمج التعلم الآلي في شركات تقديم الطعام إلى تعزيز الطلب على برامج تقديم الطعام خلال فترة التنبؤ.
رؤى تعتمد على النشر
بناءً على نوع النشر، يتم تقسيم سوق برامج تقديم الطعام إلى السحابة والمحلية. احتلت شريحة السحابة أكبر حصة في السوق في عام 2019.
رؤى إقليمية حول سوق برامج تقديم الطعام
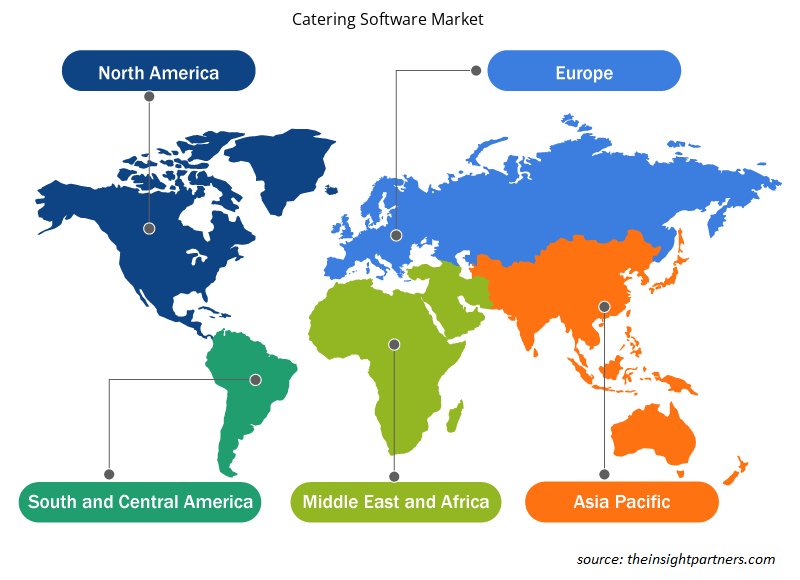
لقد قام المحللون في Insight Partners بشرح الاتجاهات والعوامل الإقليمية المؤثرة على سوق برمجيات تقديم الطعام طوال فترة التوقعات بشكل شامل. يناقش هذا القسم أيضًا قطاعات سوق برمجيات تقديم الطعام والجغرافيا في جميع أنحاء أمريكا الشمالية وأوروبا ومنطقة آسيا والمحيط الهادئ والشرق الأوسط وأفريقيا وأمريكا الجنوبية والوسطى.
- احصل على البيانات الإقليمية المحددة لسوق برامج تقديم الطعام
نطاق تقرير سوق برامج تقديم الطعام
| سمة التقرير | تفاصيل |
|---|---|
| حجم السوق في عام 2020 | 201.93 مليون دولار أمريكي |
| حجم السوق بحلول عام 2027 | 519.14 مليون دولار أمريكي |
| معدل النمو السنوي المركب العالمي (2020 - 2027) | 14.4% |
| البيانات التاريخية | 2018-2019 |
| فترة التنبؤ | 2021-2027 |
| القطاعات المغطاة | حسب النشر
|
| المناطق والدول المغطاة | أمريكا الشمالية
|
| قادة السوق وملفات تعريف الشركات الرئيسية |
|
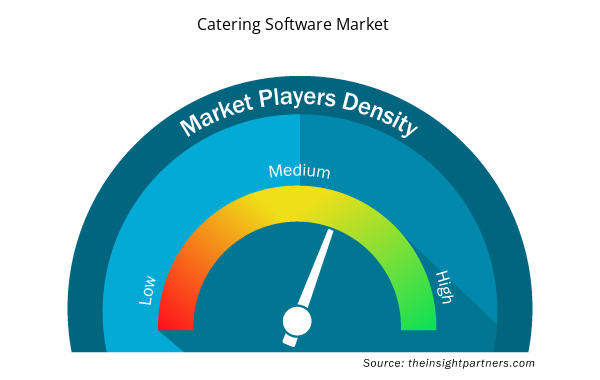
كثافة اللاعبين في سوق برمجيات تقديم الطعام: فهم تأثيرها على ديناميكيات الأعمال
يشهد سوق برامج تقديم الطعام نموًا سريعًا، مدفوعًا بالطلب المتزايد من المستخدم النهائي بسبب عوامل مثل تفضيلات المستهلكين المتطورة والتقدم التكنولوجي والوعي المتزايد بفوائد المنتج. ومع ارتفاع الطلب، تعمل الشركات على توسيع عروضها والابتكار لتلبية احتياجات المستهلكين والاستفادة من الاتجاهات الناشئة، مما يؤدي إلى زيادة نمو السوق.
تشير كثافة اللاعبين في السوق إلى توزيع الشركات أو المؤسسات العاملة في سوق أو صناعة معينة. وهي تشير إلى عدد المنافسين (اللاعبين في السوق) الموجودين في مساحة سوق معينة نسبة إلى حجمها أو قيمتها السوقية الإجمالية.
الشركات الرئيسية العاملة في سوق برمجيات تقديم الطعام هي:
- شركة ابتيوس سيستمز المحدودة
- شركة بيتر كاتير
- برنامج كاتيريز
- شركة كاتر تراكس
- CaterZen من شركة Restaurant & Catering Systems
إخلاء المسؤولية : الشركات المذكورة أعلاه ليست مرتبة بأي ترتيب معين.
- احصل على نظرة عامة على أهم اللاعبين الرئيسيين في سوق برمجيات تقديم الطعام
يركز اللاعبون العاملون في سوق برمجيات تقديم الطعام بشكل أساسي على تطوير المنتجات المتقدمة والفعالة.
- في عام 2020، استثمرت CaterZen ساعات برمجة منذ بداية شهر مارس لتأكيد قدرة المطاعم ومقدمي الطعام على مواصلة العمليات من خلال التركيز القوي على الطلب عبر الإنترنت وتوصيل الطعام.
- في عام 2020، قدمت شركة Flex Catering نظام KDS (نظام عرض المطبخ) وهو نوع من الشاشات الرقمية التي تحل محل طلبات التذاكر المطبوعة أو المكتوبة بخط اليد في المطاعم ومؤسسات الأغذية.
تم تقسيم سوق برمجيات تقديم الطعام على النحو التالي:
برنامج تقديم الطعام العالمي - حسب النشر
- سحاب
- في الموقع
برنامج تقديم الطعام العالمي - حسب المستخدم النهائي
- المطاعم
- المطاعم والفنادق
- آحرون
السوق العالمية لبرمجيات المطاعم – حسب المنطقة الجغرافية
أمريكا الشمالية
- نحن
- كندا
- المكسيك
أوروبا
- فرنسا
- ألمانيا
- إيطاليا
- روسيا
- المملكة المتحدة
- بقية أوروبا
آسيا والمحيط الهادئ (APAC)
- اليابان
- الصين
- أستراليا
- الهند
- كوريا الجنوبية
- بقية منطقة آسيا والمحيط الهادئ
الشرق الأوسط وأفريقيا
- المملكة العربية السعودية
- الامارات العربية المتحدة
- جنوب أفريقيا
- باقي منطقة الشرق الأوسط وأفريقيا
أمريكا الجنوبية (SAM)
- البرازيل
- الأرجنتين
- بقية سام
سوق برمجيات المطاعم – نبذة عن الشركة
- شركة ابتيوس سيستمز المحدودة
- شركة بيتر كاتير
- برنامج كاتيريز
- شركة كاتر تراكس
- CaterZen من شركة Restaurant & Catering Systems
- خدمات تقديم الطعام المرنة
- برنامج FoodStorm Catering (CaterXpress)
- دفتر التخطيط (دفتر عمل الزفاف الخاص بي، ذ.م.م)
- شركة أنظمة الربح المحدودة
- بيكسيير
- التحليل التاريخي (سنتان)، السنة الأساسية، التوقعات (7 سنوات) مع معدل النمو السنوي المركب
- تحليل PEST و SWOT
- حجم السوق والقيمة / الحجم - عالميًا وإقليميًا وقطريًا
- الصناعة والمنافسة
- مجموعة بيانات Excel


Report Coverage
Revenue forecast, Company Analysis, Industry landscape, Growth factors, and Trends

Segment Covered
This text is related
to segments covered.

Regional Scope
North America, Europe, Asia Pacific, Middle East & Africa, South & Central America

Country Scope
This text is related
to country scope.
الأسئلة الشائعة
The catering software market is led by cloud segment with highest share and is expected to dominate in the forecast period. The cloud segment generates the majority of the demand since it is comparatively less expensive and due to strong network infrastructure in developed countries. In addition, the cloud-based browser isolation software vendors are highly focused on developing a high-level security patch in order to eliminate the risk of cyber-attack.
The growth of the catering software market is primarily attributed to growing popularity of e-commerce platforms. Moreover, increasing integration of payment gateway, thereby substantially driving the catering software software market.
The Big Data analytics technology has enormous potential to completely transform the catering business. The adoption of Big Data solutions helps improve the efficiency of distribution and production networks in the overall catering industry. The technology allows tracking the entire process of the transportation of supplies. With real-time insights, customers can track their purchase orders on their devices and check the catering status. The integration of an analytics dashboard in catering software helps track and evaluate the performance of catering agents. Also, every stakeholder in the catering business must have relevant data on their products, including data related to farmers, shippers, and retailers, ending with restaurants and shops.
Trends and growth analysis reports related to Technology, Media and Telecommunications : READ MORE..
The List Companies - Catering Software Market
- Aptus Systems Ltd.
- Better Cater, Inc
- Caterease Software
- CaterTrax, Inc.
- CaterZen by Restaurant & Catering Systems
- Flex Catering
- FoodStorm Catering Software (CaterXpress)
- Planning Pod (My Wedding Workbook, LLC)
- Profit Systems Inc.
- Pxier
The Insight Partners performs research in 4 major stages: Data Collection & Secondary Research, Primary Research, Data Analysis and Data Triangulation & Final Review.
- Data Collection and Secondary Research:
As a market research and consulting firm operating from a decade, we have published and advised several client across the globe. First step for any study will start with an assessment of currently available data and insights from existing reports. Further, historical and current market information is collected from Investor Presentations, Annual Reports, SEC Filings, etc., and other information related to company’s performance and market positioning are gathered from Paid Databases (Factiva, Hoovers, and Reuters) and various other publications available in public domain.
Several associations trade associates, technical forums, institutes, societies and organization are accessed to gain technical as well as market related insights through their publications such as research papers, blogs and press releases related to the studies are referred to get cues about the market. Further, white papers, journals, magazines, and other news articles published in last 3 years are scrutinized and analyzed to understand the current market trends.
- Primary Research:
The primarily interview analysis comprise of data obtained from industry participants interview and answers to survey questions gathered by in-house primary team.
For primary research, interviews are conducted with industry experts/CEOs/Marketing Managers/VPs/Subject Matter Experts from both demand and supply side to get a 360-degree view of the market. The primary team conducts several interviews based on the complexity of the markets to understand the various market trends and dynamics which makes research more credible and precise.
A typical research interview fulfils the following functions:
- Provides first-hand information on the market size, market trends, growth trends, competitive landscape, and outlook
- Validates and strengthens in-house secondary research findings
- Develops the analysis team’s expertise and market understanding
Primary research involves email interactions and telephone interviews for each market, category, segment, and sub-segment across geographies. The participants who typically take part in such a process include, but are not limited to:
- Industry participants: VPs, business development managers, market intelligence managers and national sales managers
- Outside experts: Valuation experts, research analysts and key opinion leaders specializing in the electronics and semiconductor industry.
Below is the breakup of our primary respondents by company, designation, and region:

Once we receive the confirmation from primary research sources or primary respondents, we finalize the base year market estimation and forecast the data as per the macroeconomic and microeconomic factors assessed during data collection.
- Data Analysis:
Once data is validated through both secondary as well as primary respondents, we finalize the market estimations by hypothesis formulation and factor analysis at regional and country level.
- Macro-Economic Factor Analysis:
We analyse macroeconomic indicators such the gross domestic product (GDP), increase in the demand for goods and services across industries, technological advancement, regional economic growth, governmental policies, the influence of COVID-19, PEST analysis, and other aspects. This analysis aids in setting benchmarks for various nations/regions and approximating market splits. Additionally, the general trend of the aforementioned components aid in determining the market's development possibilities.
- Country Level Data:
Various factors that are especially aligned to the country are taken into account to determine the market size for a certain area and country, including the presence of vendors, such as headquarters and offices, the country's GDP, demand patterns, and industry growth. To comprehend the market dynamics for the nation, a number of growth variables, inhibitors, application areas, and current market trends are researched. The aforementioned elements aid in determining the country's overall market's growth potential.
- Company Profile:
The “Table of Contents” is formulated by listing and analyzing more than 25 - 30 companies operating in the market ecosystem across geographies. However, we profile only 10 companies as a standard practice in our syndicate reports. These 10 companies comprise leading, emerging, and regional players. Nonetheless, our analysis is not restricted to the 10 listed companies, we also analyze other companies present in the market to develop a holistic view and understand the prevailing trends. The “Company Profiles” section in the report covers key facts, business description, products & services, financial information, SWOT analysis, and key developments. The financial information presented is extracted from the annual reports and official documents of the publicly listed companies. Upon collecting the information for the sections of respective companies, we verify them via various primary sources and then compile the data in respective company profiles. The company level information helps us in deriving the base number as well as in forecasting the market size.
- Developing Base Number:
Aggregation of sales statistics (2020-2022) and macro-economic factor, and other secondary and primary research insights are utilized to arrive at base number and related market shares for 2022. The data gaps are identified in this step and relevant market data is analyzed, collected from paid primary interviews or databases. On finalizing the base year market size, forecasts are developed on the basis of macro-economic, industry and market growth factors and company level analysis.
- Data Triangulation and Final Review:
The market findings and base year market size calculations are validated from supply as well as demand side. Demand side validations are based on macro-economic factor analysis and benchmarks for respective regions and countries. In case of supply side validations, revenues of major companies are estimated (in case not available) based on industry benchmark, approximate number of employees, product portfolio, and primary interviews revenues are gathered. Further revenue from target product/service segment is assessed to avoid overshooting of market statistics. In case of heavy deviations between supply and demand side values, all thes steps are repeated to achieve synchronization.
We follow an iterative model, wherein we share our research findings with Subject Matter Experts (SME’s) and Key Opinion Leaders (KOLs) until consensus view of the market is not formulated – this model negates any drastic deviation in the opinions of experts. Only validated and universally acceptable research findings are quoted in our reports.
We have important check points that we use to validate our research findings – which we call – data triangulation, where we validate the information, we generate from secondary sources with primary interviews and then we re-validate with our internal data bases and Subject matter experts. This comprehensive model enables us to deliver high quality, reliable data in shortest possible time.
 احصل على عينة مجانية لهذا التقرير