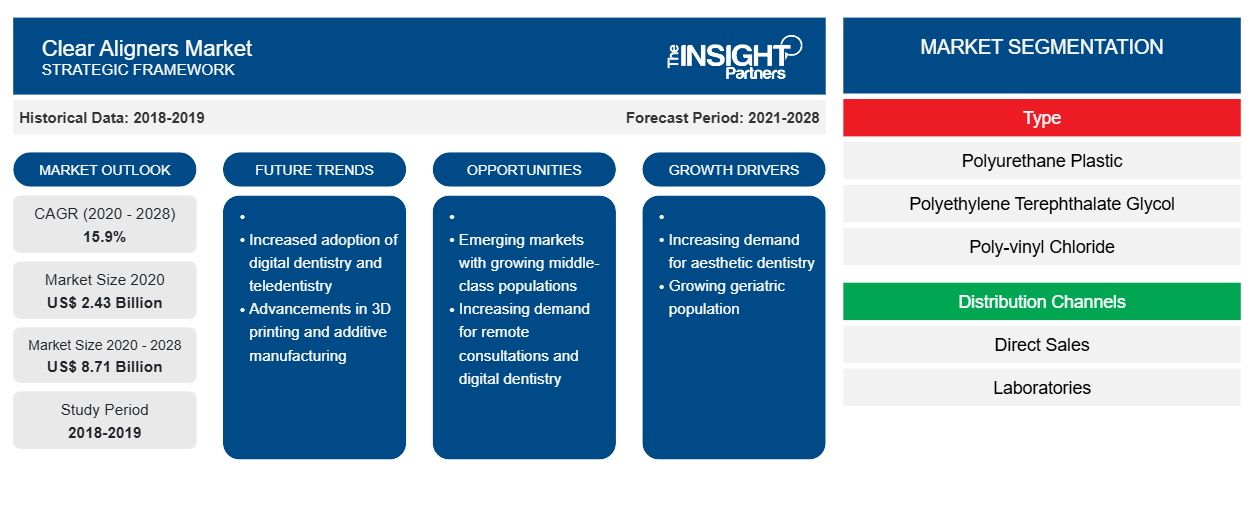
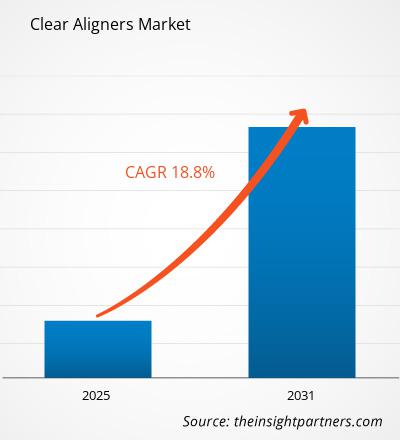
من المتوقع أن يصل حجم سوق أجهزة تقويم الأسنان الشفافة إلى 21,755.94 مليون دولار أمريكي بحلول عام 2031، مقارنةً بـ 6,600.00 مليون دولار أمريكي في عام 2024. ومن المتوقع أن يسجل السوق معدل نمو سنوي مركب قدره 18.8% خلال الفترة 2025-2031. ومن المرجح أن يُحدث تطوير الطعوم المُخصصة اتجاهات سوقية جديدة خلال الفترة المتوقعة.
تحليل سوق أجهزة تقويم الأسنان الشفافة
إن انتشار أمراض الأسنان والفم، مثل اعوجاج الأسنان، وتداخل الفكين، وتداخل الفك السفلي، والعضات المتقاطعة، والمسافات بين الأسنان، وازدحام الأسنان، واضطرابات المفصل الصدغي الفكي، يزيد من استخدام أجهزة التقويم الشفافة، مما يدفع عجلة نمو السوق. تشمل العوامل المسببة لمشاكل الأسنان أمراض اللثة والإصابات والحوادث. ووفقًا لمقال نُشر في رويترز عام 2022، يُعاني حوالي 3.5 مليار شخص حول العالم من أمراض الفم، حيث يُؤثر تسوس الأسنان غير المُعالج على ما يقرب من 2.5 مليار شخص. ووفقًا للجمعية الأمريكية لأطباء تقويم الأسنان، في عام 2022، كان حوالي 3.15 مليون مريض تتراوح أعمارهم بين 8 و17 عامًا يخضعون لعلاج تقويم الأسنان في الولايات المتحدة، وهو ما يُمثل حوالي 7.4% من سكان هذه الفئة العمرية. وفقًا لتقرير BMC Oral Health 2025، ارتفع عدد البالغين الذين يتلقون علاجًا تقويميًا في الولايات المتحدة من 1.55 مليون في عام 2016 إلى ما يقدر بنحو 1.61 مليون في عام 2018.
نظرة عامة على سوق أجهزة تقويم الأسنان الشفافة
يشهد سوق أجهزة تقويم الأسنان الشفافة نموًا ملحوظًا بفضل تزايد التفضيلات الجمالية، والتقدم التكنولوجي، وتنامي الوعي بصحة الفم، وزيادة الدخل المتاح، ودمج تقويم الأسنان عن بُعد والمراقبة عن بُعد. ويمكن أن تُمثل أجهزة تقويم الأسنان الشفافة القابلة للتخصيص، والتي تُلبي التفضيلات الفردية وحالات الأسنان، فرصةً واعدةً في المستقبل.
قم بتخصيص هذا التقرير ليناسب متطلباتك
ستحصل على تخصيص لأي تقرير - مجانًا - بما في ذلك أجزاء من هذا التقرير، أو تحليل على مستوى الدولة، وحزمة بيانات Excel، بالإضافة إلى الاستفادة من العروض والخصومات الرائعة للشركات الناشئة والجامعات
سوق أجهزة تقويم الأسنان الشفافة: رؤى استراتيجية

- احصل على أهم اتجاهات السوق الرئيسية لهذا التقرير.ستتضمن هذه العينة المجانية تحليل البيانات، بدءًا من اتجاهات السوق وحتى التقديرات والتوقعات.
محركات وفرص سوق أجهزة تقويم الأسنان الشفافة
تزايد انتشار سوء الإطباق بين الأطفال
يعاني الأشخاص الذين يعانون من سمات سوء الإطباق، بما في ذلك بروز الفك العلوي، وعدم انتظام الأسنان الأمامية، والتباعد الأمامي، من ضعف في مظهر الأسنان وأداء المضغ. ووفقًا لمجلة Dental Tribune International لعام 2025، يُعد سوء الإطباق من أكثر حالات طب الأسنان السريرية شيوعًا ، حيث يصيب ما يقرب من 60 إلى 75% من سكان العالم. ويلجأ حوالي 21 مليون شخص حول العالم سنويًا إلى أخصائيي تقويم الأسنان. ومن حيث الانتشار، يحتل سوء الإطباق المرتبة الثالثة بعد تسوس الأسنان وأمراض اللثة المسجلة عالميًا. ويُعد سوء الإطباق أكثر شيوعًا بين الأطفال المصابين باضطراب طيف التوحد (ASD). وكانت العضة المتصالبة الخلفية، وبروز الفك العلوي، وازدحام الفك العلوي غير الطبيعي أكثر سمات سوء الإطباق تشخيصًا لدى الأطفال.بروز الفك العلوي، وعدم انتظام الفك الأمامي، والتباعد الأمامي، كلها عوامل تُسبب ضعفًا في مظهر الأسنان وأداء المضغ. ووفقًا لمجلة Dental Tribune International لعام ٢٠٢٥، يُعد سوء الإطباق من أكثر اضطرابات طيف التوحد السريرية شيوعًا. وكانت العضة المتصالبة الخلفية، وبروز الفك العلوي المتزايد، وازدحام الفك العلوي غير الطبيعي من أكثر سمات سوء الإطباق تشخيصًا لدى الأطفال.
وفقًا لبيانات Elsevier BVdata، بلغ معدل انتشار بروز الفك العميق الشديد حوالي 8% في الولايات المتحدة، وتراوح متوسط بروز الفك من 36.5% إلى 39.2% لدى الأطفال الذين تتراوح أعمارهم بين 5 و6 سنوات. وفي دراسة نُشرت في المركز الوطني لمعلومات التكنولوجيا الحيوية (NCBI)، أُجري تحليل للإطباق لدى بعض مجموعات المراهقين الذين تتراوح أعمارهم بين 12 و18 عامًا. ووفقًا للدراسة، أكد أكثر من 93% من المشاركين وجود شكل من أشكال سوء الإطباق. وكان معدل انتشار سوء الإطباق أعلى لدى المراهقين الأوروبيين. ووفقًا لبيانات المركز الوطني لمعلومات التكنولوجيا الحيوية (NCBI) لعام 2021، كانت حالات سوء الإطباق من الفئة الأولى (34.9%) والفئة الثانية، القسم 1 (40.0%) أعلى. وتم الإبلاغ عن زيادة سوء الإطباق (18%) وانخفاض العضات (14%) وزيادة (25.1%) وانعكاس بروز الفك العلوي (10%) في السكان. وفقًا لبيانات مجلة PeerJ المنشورة عام ٢٠١٩، سُجِّلت نسبة انتشار عالية لمرض الزاوية من الفئة الثانية، أي ٣٨.٢٪، بين المراهقين الذين تتراوح أعمارهم بين ١٢ و١٥ عامًا في اليابان. وكان الازدحام الأمامي أكثر شيوعًا بين الفتيات منه بين الأولاد. وبالتالي، فإن ارتفاع معدل سوء الإطباق لدى المراهقين يزيد من استخدام أجهزة التقويم الشفافة، مما يعزز نمو السوق.وفقًا لبيانات Elsevier B.V.، كان معدل انتشار بروز الفك العميق الشديد حوالي 8% في الولايات المتحدة، مع متوسط يتراوح من 36.5% إلى 39.2% لدى الأطفال الذين تتراوح أعمارهم بين 5 و6 سنوات. وفي دراسة نُشرت في المركز الوطني لمعلومات التكنولوجيا الحيوية (NCBI)، تم إجراء تحليل للإطباق في بعض مجموعات المراهقين الذين تتراوح أعمارهم بين 12 و18 عامًا. ووفقًا للدراسة، أكد أكثر من 93% من المشاركين وجود شكل من أشكال سوء الإطباق. وكان معدل انتشار سوء الإطباق أعلى لدى المراهقين الأوروبيين. ووفقًا لبيانات المركز الوطني لمعلومات التكنولوجيا الحيوية (NCBI) لعام 2021، كانت حالات سوء الإطباق من الفئة الأولى (34.9%) والفئة الثانية، القسم 1 (40.0%) أعلى. وتم الإبلاغ عن زيادة سوء الإطباق (18%) وانخفاض العضات (14%) وزيادة (25.1%) وانعكاس بروز الفك العلوي (10%) في السكان. وفقًا لبيانات مجلة PeerJ المنشورة عام ٢٠١٩، سُجِّلت نسبة انتشار عالية لمرض الزاوية من الفئة الثانية، أي ٣٨.٢٪، بين المراهقين الذين تتراوح أعمارهم بين ١٢ و١٥ عامًا في اليابان. وكان الازدحام الأمامي أكثر شيوعًا بين الفتيات منه بين الأولاد. وبالتالي، فإن ارتفاع معدل سوء الإطباق لدى المراهقين يزيد من استخدام أجهزة التقويم الشفافة، مما يعزز نمو السوق.
تزايد الطلب على إجراءات طب الأسنان التجميلية
تُعد جراحة تجميل الأسنان من أكثر الإجراءات التجميلية شيوعًا في جميع أنحاء العالم. وتُعد الأكاديمية الأمريكية لطب الأسنان التجميلي (AACD) المرجع الرئيسي للمرضى في مجال طب الأسنان وهم يحاولون الحفاظ على وظائفهم الصحية والتطلع إلى مستقبل أفضل. ووفقًا للجمعية الأمريكية لجراحة التجميل (ASPS) لعام 2022، فقد شهد طب الأسنان التجميلي طفرة مؤخرًا، مع زيادة بنسبة 47% في الإجراءات التي يطلبها الأشخاص الذين تتراوح أعمارهم بين 51 و64 عامًا. ووفقًا لـ GlobeNewswire لعام 2025، يتم إجراء ما يقرب من 30 مليون إجراء تجميلي للأسنان سنويًا في جميع أنحاء العالم، وتشمل علاجات من تبييض الأسنان إلى عمليات إعادة بناء الفم الكاملة المعقدة. لم تعد الإجراءات التجميلية مقتصرة على الأغنياء والمشاهير فقط. يخضع سكان الطبقة المتوسطة في أمريكا الشمالية لهذه الإجراءات بسبب الرغبة المتزايدة في تحسين المظهر الجمالي. ويساهم سهولة الوصول إلى إجراءات طب الأسنان الجراحية في اعتماد أجهزة التقويم الشفافة.
تكلفة إجراءات تجميل الأسنان أقل في المكسيك. يتراوح الفرق بين سعر إجراء طبيب الأسنان التجميلي العادي وإجراء طبيب الأسنان التجميلي المتميز في البلاد بين 50 و150 دولارًا أمريكيًا للتاج أو القشرة. يوفر أطباء الأسنان في المكسيك تيجانًا أقل تكلفة، مصنوعة في مختبرات بمواد عالية الجودة. تسعى الدول الآسيوية نحو إجراءات تجميلية بتكاليف أقل وأساليب متطورة. تُعد تايلاند وسنغافورة والهند وماليزيا من بين أفضل الوجهات لإجراءات تجميل الأسنان. يأتي المرضى من دول متقدمة مثل الولايات المتحدة الأمريكية والمملكة المتحدة لاختيار سنغافورة لتلقي العلاج. توجد في هذه الدول منتجعات صحية للأسنان تقدم علاجات وإجراءات أسنان مبتكرة. على سبيل المثال، يقدم منتجع بانكوك للأسنان (الموجود في بانكوك، تايلاند) خدمات طب الأسنان للمرضى من الخارج. وبالتالي، فإن فعالية إجراءات تجميل الأسنان من حيث التكلفة تُعزز استخدام أجهزة التقويم الشفافة وتدفع عجلة نمو السوق.
تقرير تحليل تجزئة سوق أجهزة تقويم الأسنان الشفافة
إن القطاعات الرئيسية التي ساهمت في استنتاج تحليل سوق أجهزة تقويم الأسنان الشفافة هي النوع والفئة العمرية والمستخدم النهائي.
- يُقسّم سوق أجهزة التقويم الشفافة، حسب نوعها، إلى بلاستيك البولي يوريثان، وبولي إيثيلين تيريفثالات جليكول (PETG)، وكلوريد البولي فينيل (PVC)، وغيرها. وقد استحوذ قطاع بلاستيك البولي يوريثان على الحصة الأكبر من سوق أجهزة التقويم الشفافة في عام 2024.
- من حيث الفئة العمرية، ينقسم السوق إلى البالغين والأطفال. وقد استحوذت شريحة البالغين على الحصة الأكبر في سوق أجهزة التقويم الشفافة في عام ٢٠٢٤.
- بحسب المستخدم النهائي، يُقسّم السوق إلى مستشفيات وصيدليات، وقنوات إلكترونية، وغيرها. وقد استحوذ قطاع المستشفيات وصيدليات التجزئة على الحصة الأكبر من سوق أجهزة التقويم الشفافة في عام ٢٠٢٤.
تحليل حصة سوق أجهزة تقويم الأسنان الشفافة حسب المنطقة الجغرافية
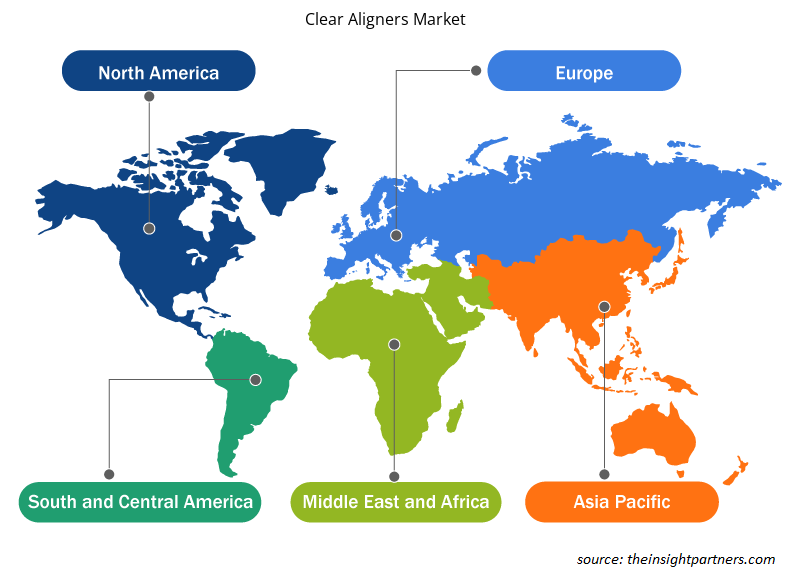
يركز النطاق الجغرافي لتقرير سوق أجهزة التقويم الشفافة بشكل أساسي على خمس مناطق: أمريكا الشمالية، وآسيا والمحيط الهادئ، وأوروبا، وأمريكا الجنوبية والوسطى، والشرق الأوسط وأفريقيا. من حيث الإيرادات، سيطرت أمريكا الشمالية على السوق في عام 2024. ومن المتوقع أن تستمر هيمنتها في السوق خلال فترة التوقعات. تمثل الولايات المتحدة جزءًا كبيرًا من سوق أجهزة التقويم الشفافة، مع إجراء عدد كبير من الإجراءات سنويًا. ووفقًا لدراسة طب الأسنان ورعاية صحة الفم المنشورة في مجلة Biores Scientia في عام 2023، فإن ما يقرب من 30٪ من الأشخاص في الولايات المتحدة لديهم إطباق طبيعي، وكان معدل انتشار سوء الإطباق من الدرجة الأولى بين 50-55٪. ويؤدي الانتشار المتزايد لسوء الإطباق إلى زيادة الطلب على أجهزة التقويم الشفافة نظرًا لجمالها وراحتها وسهولة استخدامها مقارنةً بتقويم الأسنان المعدني التقليدي. تكاد أجهزة التقويم الشفافة تكون غير مرئية وقابلة للإزالة، مما يجعلها خيارًا أكثر جاذبية للبالغين والمراهقين الذين يسعون إلى تقويم أسنانهم دون ظهور أو إزعاج تقويم الأسنان التقليدي. بالإضافة إلى ذلك، تُوفر هذه الأجهزة راحةً تتمثل في تقليل زيارات العيادة مقارنةً بأجهزة التقويم التقليدية التي تتطلب تعديلات منتظمة. ويساهم تنفيذ الجهات الفاعلة الرئيسية لمبادرات استراتيجية، مثل إطلاق المنتجات واعتمادها والتعاون معها، في تعزيز نمو السوق. في مايو 2024، أطلقت شركة OrthoFX جيلًا جديدًا من بوليمرات تقويم الأسنان الشفافة المتقدمة، وهو NiTime Clear Aligners. وهو أول نظام تقويم أسنان شفاف مصمم خصيصًا لوقت ارتداء أقصر، ومعتمد من إدارة الغذاء والدواء الأمريكية (FDA) بموجب المادة 510(k)، وهو متاح على مستوى البلاد للأطباء الذين يعالجون جميع أنواع سوء إطباق الأسنان.
رؤى إقليمية حول سوق أجهزة تقويم الأسنان الشفافة
قام محللو إنسايت بارتنرز بشرح شامل للاتجاهات الإقليمية والعوامل المؤثرة في سوق أجهزة تقويم الأسنان الشفافة خلال فترة التوقعات. ويناقش هذا القسم أيضًا قطاعات سوق أجهزة تقويم الأسنان الشفافة ومناطقها الجغرافية في أمريكا الشمالية، وأوروبا، وآسيا والمحيط الهادئ، والشرق الأوسط وأفريقيا، وأمريكا الجنوبية والوسطى.

- احصل على البيانات الإقليمية المحددة لسوق أجهزة تقويم الأسنان الشفافة
نطاق تقرير سوق أجهزة تقويم الأسنان الشفافة
| سمة التقرير | تفاصيل |
|---|---|
| حجم السوق في عام 2024 | 6,600.00 مليون دولار أمريكي |
| حجم السوق بحلول عام 2031 | 21,755.94 مليون دولار أمريكي |
| معدل النمو السنوي المركب العالمي (2025 - 2031) | 18.8% |
| البيانات التاريخية | 2021-2023 |
| فترة التنبؤ | 2025-2031 |
| القطاعات المغطاة | حسب النوع
|
| المناطق والدول المغطاة | أمريكا الشمالية
|
| قادة السوق وملفات تعريف الشركات الرئيسية |
|
كثافة اللاعبين في سوق أجهزة تقويم الأسنان الشفافة: فهم تأثيرها على ديناميكيات الأعمال
يشهد سوق أجهزة تقويم الأسنان الشفافة نموًا سريعًا، مدفوعًا بتزايد طلب المستخدمين النهائيين نتيجةً لعوامل مثل تفضيلات المستهلكين المتطورة، والتقدم التكنولوجي، وزيادة الوعي بفوائد المنتج. ومع تزايد الطلب، تعمل الشركات على توسيع عروضها، والابتكار لتلبية احتياجات المستهلكين، والاستفادة من الاتجاهات الناشئة، مما يعزز نمو السوق.
تشير كثافة اللاعبين في السوق إلى توزيع الشركات العاملة في سوق أو قطاع معين. وتشير إلى عدد المنافسين (اللاعبين في السوق) الموجودين في سوق معين نسبةً إلى حجمه أو قيمته السوقية الإجمالية.
الشركات الرئيسية العاملة في سوق أجهزة تقويم الأسنان الشفافة هي:
- شركة الاين للتكنولوجيا
- دنتسبلي سيرونا
- داناهر
- معهد سترومان إيه جي
- 3م
- شركة هنري شاين
إخلاء المسؤولية : الشركات المذكورة أعلاه ليست مرتبة بأي ترتيب معين.

- احصل على نظرة عامة على أهم اللاعبين الرئيسيين في سوق أجهزة تقويم الأسنان الشفافة
أخبار سوق أجهزة تقويم الأسنان الشفافة والتطورات الأخيرة
يُقيّم سوق أجهزة التقويم الشفافة بجمع بيانات نوعية وكمية بعد البحث الأولي والثانوي، والتي تشمل منشورات الشركات المهمة، وبيانات الجمعيات، وقواعد البيانات. فيما يلي بعض التطورات الرئيسية التي شهدها سوق أجهزة التقويم الشفافة:
- أطلقت شركة هنري شاين في المملكة المتحدة منتجَي "سمايلرز" و"سمايلرز إكسبيرت"، وهما حلان لتقويم الأسنان التوأميْن، يستهدفان أطباء الأسنان العامين وأخصائيي تقويم الأسنان. ووفقًا لهنري شاين، توفر هذه المنتجات علاجًا قابلًا للتخصيص لسوء الإطباق، مما يُمكّن أطباء الأسنان من تقديم رعاية تقويم أسنان متميزة. (المصدر: هنري شاين في المملكة المتحدة، فبراير ٢٠٢٥)
- أعلنت شركة Align Technology, Inc. عن حصولها على علامة CE في أوروبا بموجب لائحة الأجهزة الطبية (MDR 2017/745) لنظام Invisalign Palatal Expander من Align. وقد أكمل نظام Invisalign Palatal Expander تسجيله لدى وكالة تنظيم الأدوية ومنتجات الرعاية الصحية (MHRA) في المملكة المتحدة والأقاليم الخارجية. (المصدر: Align Technology, Inc.، بيان صحفي، نوفمبر 2024)
تقرير سوق أجهزة تقويم الأسنان الشفافة: التغطية والنتائج
يقدم تقرير "حجم سوق أجهزة تقويم الأسنان الشفافة والتوقعات (2021-2031)" تحليلاً مفصلاً للسوق يغطي المجالات التالية:
- حجم سوق أجهزة التقويم الشفافة وتوقعاته على المستويات العالمية والإقليمية والوطنية لجميع قطاعات السوق الرئيسية التي يغطيها النطاق
- اتجاهات سوق أجهزة التقويم الشفافة، بالإضافة إلى ديناميكيات السوق مثل العوامل المحركة والقيود والفرص الرئيسية
- تحليل مفصل لـ PEST و SWOT
- تحليل سوق أجهزة التقويم الشفافة يغطي اتجاهات السوق الرئيسية والإطار العالمي والإقليمي والجهات الفاعلة الرئيسية واللوائح والتطورات الأخيرة في السوق
- تحليل المشهد الصناعي والمنافسة الذي يغطي تركيز السوق، وتحليل خريطة الحرارة، واللاعبين البارزين، والتطورات الأخيرة لسوق التقويم الشفاف
- ملفات تعريف الشركة التفصيلية
- التحليل التاريخي (سنتان)، سنة الأساس، التوقعات (7 سنوات) مع معدل النمو السنوي المركب
- تحليل PEST و SWOT
- حجم السوق والقيمة / الحجم - عالمي، إقليمي، بلد
- الصناعة والمنافسة
- مجموعة بيانات إكسل
التقارير الحديثة
شهادات العملاء
سبب الشراء
- اتخاذ قرارات مدروسة
- فهم ديناميكيات السوق
- تحليل المنافسة
- رؤى العملاء
- توقعات السوق
- تخفيف المخاطر
- التخطيط الاستراتيجي
- مبررات الاستثمار
- تحديد الأسواق الناشئة
- تحسين استراتيجيات التسويق
- تعزيز الكفاءة التشغيلية
- مواكبة التوجهات التنظيمية


 احصل على عينة مجانية ل - سوق أجهزة تقويم الأسنان الشفافة