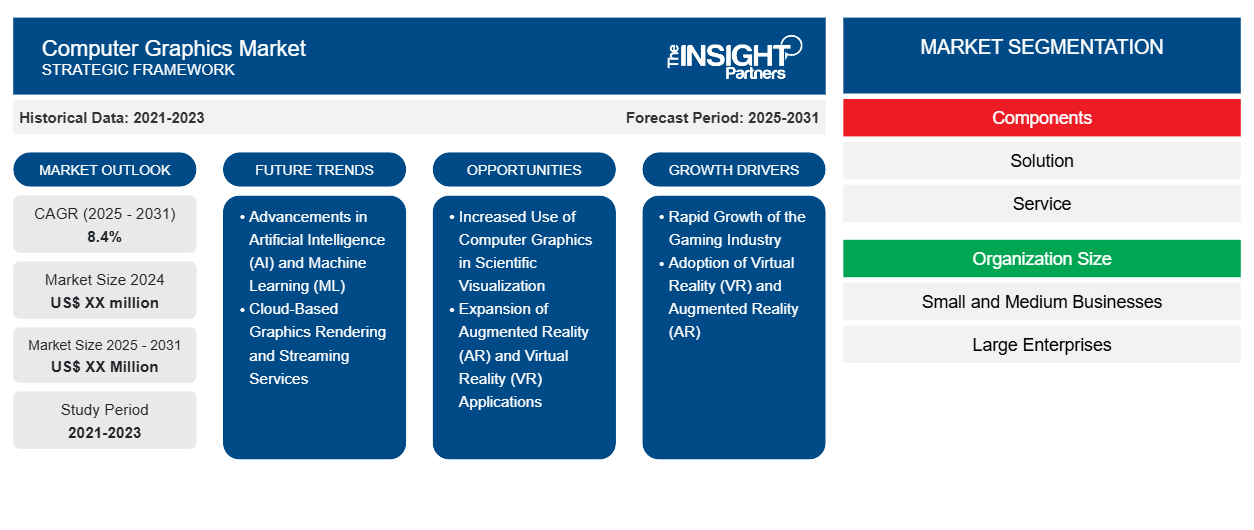
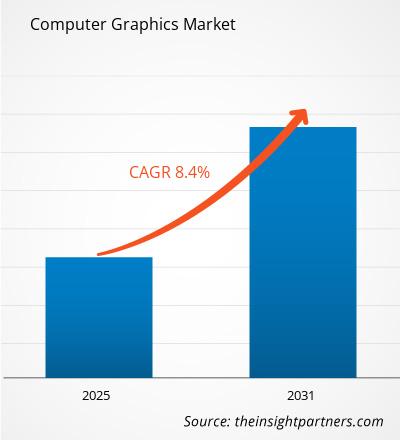
من المتوقع أن يسجل سوق الرسوميات الحاسوبية معدل نمو سنوي مركب بنسبة 8.4٪ من عام 2023 إلى عام 2031، مع توسع حجم السوق من XX مليون دولار أمريكي في عام 2023 إلى XX مليون دولار أمريكي بحلول عام 2031.
تم تقسيم التقرير حسب المكونات (الحل والخدمة)؛ حجم المنظمة (الشركات الصغيرة والمتوسطة ( SMBs )، الشركات الكبيرة)؛ القطاعات الرأسية (الفضاء والدفاع، السيارات، الترفيه والإعلان، الأوساط الأكاديمية والتعليم، الرعاية الصحية، التصنيع، أخرى). يتم تقسيم التحليل العالمي بشكل أكبر على المستوى الإقليمي والدول الرئيسية. يقدم التقرير القيمة بالدولار الأمريكي للتحليل والقطاعات المذكورة أعلاه.
غرض التقرير
يهدف تقرير سوق الرسوميات الحاسوبية الصادر عن The Insight Partners إلى وصف المشهد الحالي والنمو المستقبلي وأهم العوامل الدافعة والتحديات والفرص. وسيوفر هذا رؤى لمختلف أصحاب المصلحة في الأعمال التجارية، مثل:
- مزودي/مصنعي التكنولوجيا: لفهم ديناميكيات السوق المتطورة ومعرفة فرص النمو المحتملة، وتمكينهم من اتخاذ قرارات استراتيجية مستنيرة.
- المستثمرون: إجراء تحليل شامل للاتجاهات فيما يتعلق بمعدل نمو السوق، وتوقعات السوق المالية، والفرص المتاحة عبر سلسلة القيمة.
- الهيئات التنظيمية: لتنظيم السياسات ومراقبة الأنشطة في السوق بهدف تقليل الانتهاكات والحفاظ على ثقة المستثمرين ودعم سلامة السوق واستقرارها.
تجزئة سوق الرسوميات الحاسوبية
عناصر
- حل
- خدمة
حجم المنظمة
- الشركات الصغيرة والمتوسطة
- الشركات الكبيرة
عموديات
- الفضاء والدفاع
- السيارات
- الترفيه والإعلان
- الأكاديمية والتعليم
- الرعاية الصحية
- تصنيع
- آحرون
الجغرافيا
- أمريكا الشمالية
- أوروبا
- آسيا والمحيط الهادئ
- أمريكا الجنوبية والوسطى
- الشرق الأوسط وأفريقيا
الجغرافيا
- أمريكا الشمالية
- أوروبا
- آسيا والمحيط الهادئ
- أمريكا الجنوبية والوسطى
- الشرق الأوسط وأفريقيا
قم بتخصيص هذا التقرير ليناسب متطلباتك
ستحصل على تخصيص لأي تقرير - مجانًا - بما في ذلك أجزاء من هذا التقرير، أو تحليل على مستوى الدولة، وحزمة بيانات Excel، بالإضافة إلى الاستفادة من العروض والخصومات الرائعة للشركات الناشئة والجامعات
سوق الرسوميات الحاسوبية: رؤى استراتيجية
- احصل على أهم اتجاهات السوق الرئيسية لهذا التقرير.ستتضمن هذه العينة المجانية تحليلاً للبيانات، بدءًا من اتجاهات السوق وحتى التقديرات والتوقعات.
عوامل نمو سوق الرسوميات الحاسوبية
- النمو السريع لصناعة الألعاب: لا تزال التكنولوجيا المتقدمة في رسومات الكمبيوتر تشهد إقبالاً كبيرًا من قبل ألعاب الفيديو؛ وفي الوقت الحاضر، سوف تفعل كل شيء آخر مع القدرة على الرسومات بسبب متطلبات جميع أنواع المستخدمين لرسومات HD وغيرها من الجيل التالي مثل 4K والواقع الافتراضي وكذلك الواقع المعزز.
- اعتماد الواقع الافتراضي والواقع المعزز: لقد أصبحت الواقع الافتراضي والواقع المعزز الآن من التقنيات السائدة في قطاعات مختلفة من الاقتصاد، والتي تشمل الألعاب والتعليم والرعاية الصحية والعقارات. وقد تم اعتبار الرسومات الحاسوبية عالية الجودة واحدة من أكبر المحركات في السوق لتلبية تطبيقات الواقع الافتراضي والواقع المعزز. تتطلب كلتا التقنيتين عرضًا ثلاثي الأبعاد معقدًا ومعالجة في الوقت الفعلي لتكون قادرة على تقديم تجارب سلسة وغامرة.
الاتجاهات المستقبلية لسوق الرسوميات الحاسوبية
- التطورات في الذكاء الاصطناعي والتعلم الآلي: أصبح الذكاء الاصطناعي والتعلم الآلي أيضًا جزءًا لا يتجزأ من سير عمل الرسومات الحاسوبية من خلال تمكين التحسينات في كفاءة العرض وتحسين الجودة المرئية وتسريع خط الأنابيب للإنتاج. أصبح الذكاء الاصطناعي ذا صلة بترقية الصور ومقاطع الفيديو وتقليل الضوضاء وإنشاء نسيج أكثر واقعية. يجد التصميم التوليدي من خلال الذكاء الاصطناعي استخدامًا متزايدًا في صناعات مثل السيارات والفضاء والهندسة المعمارية. باستخدام خوارزميات الذكاء الاصطناعي، يمكن للمصممين تصميم أشكال وهياكل من المستحيل تصميمها يدويًا، مع محاكاة رسومية معقدة وعروض تقديمية.
- خدمات عرض الرسومات وبثها عبر السحابة: إن التحول نحو عرض الرسومات عبر السحابة هو اتجاه متنامٍ في سوق الرسومات الحاسوبية. تتيح خدمات العرض السحابي للمستخدمين تفريغ مهمة عرض الرسومات التي تتطلب الكثير من العمليات الحسابية إلى مراكز البيانات البعيدة، مما يقلل من الحاجة إلى أجهزة باهظة الثمن في الموقع. يكتسب هذا الاتجاه زخمًا في الصناعات مثل الألعاب والرسوم المتحركة والمؤثرات البصرية، حيث يعد عرض الرسومات عالية الجودة أمرًا ضروريًا ولكنه قد يتطلب الكثير من الموارد. بالإضافة إلى ذلك، فإن صعود خدمات الألعاب السحابية، مثل Google Stadia وNVIDIA GeForce Now، يدفع الطلب على حلول الرسومات القوية المستندة إلى السحابة. يعمل هذا الاتجاه على إضفاء الطابع الديمقراطي على الوصول إلى قدرات الرسومات المتقدمة، مما يتيح للاستوديوهات الأصغر والمطورين المستقلين إنشاء محتوى عالي الجودة دون الحاجة إلى بنية تحتية باهظة الثمن.
فرص سوق الرسوميات الحاسوبية
- الاستخدام المتزايد للرسومات الحاسوبية في التصور العلمي: تُستخدم الرسوميات الحاسوبية في مجال الرعاية الصحية. وفي التصوير الطبي، تُستخدم لتصور البيانات ثلاثية الأبعاد المعقدة مثل فحوصات التصوير المقطعي المحوسب، والتصوير بالرنين المغناطيسي، والمحاكاة الجزيئية. ويعتمد المتخصصون الطبيون والباحثون على التصوير عالي الدقة والنمذجة ثلاثية الأبعاد للتشخيص وتخطيط الجراحة ومحاكاة نتائج العلاج.
- التوسع في تطبيقات الواقع المعزز والواقع الافتراضي
يقدم التبني المتزايد لتقنيات الواقع المعزز والواقع الافتراضي فرصًا كبيرة لسوق الرسوميات الحاسوبية. يعتمد كل من الواقع المعزز والواقع الافتراضي بشكل كبير على الرسوميات الحاسوبية لإنشاء بيئات غامرة وتفاعلية. ومع تبني الصناعات مثل التعليم والرعاية الصحية وتجارة التجزئة والترفيه لهذه التقنيات للتدريب والتسويق والألعاب، هناك طلب متزايد على الرسوميات عالية الجودة لتقديم تجارب أكثر واقعية وجاذبية. أصبحت القدرة على تصميم وتقديم صور معقدة وعالية الجودة في الوقت الفعلي ميزة تنافسية، مما يفتح مصادر دخل جديدة للشركات التي تقدم حلول الرسوميات الحاسوبية المصممة خصيصًا لتطبيقات الواقع المعزز والواقع الافتراضي.
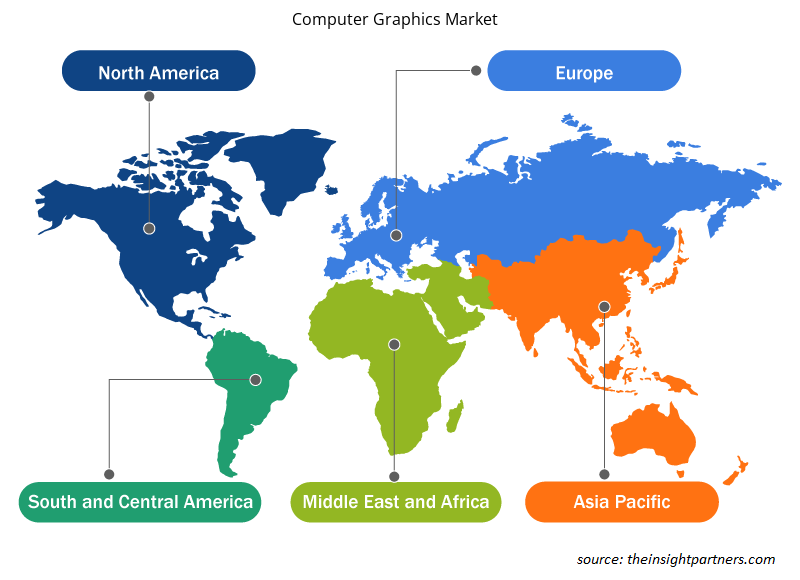
رؤى إقليمية حول سوق الرسوميات الحاسوبية
لقد قام المحللون في Insight Partners بشرح الاتجاهات والعوامل الإقليمية المؤثرة على سوق الرسوميات الحاسوبية طوال فترة التوقعات بشكل شامل. يناقش هذا القسم أيضًا قطاعات سوق الرسوميات الحاسوبية والجغرافيا في جميع أنحاء أمريكا الشمالية وأوروبا ومنطقة آسيا والمحيط الهادئ والشرق الأوسط وأفريقيا وأمريكا الجنوبية والوسطى.
- احصل على البيانات الإقليمية المحددة لسوق الرسوميات الحاسوبية
نطاق تقرير سوق الرسوميات الحاسوبية
| سمة التقرير | تفاصيل |
|---|---|
| حجم السوق في عام 2023 | XX مليون دولار أمريكي |
| حجم السوق بحلول عام 2031 | XX مليون دولار أمريكي |
| معدل النمو السنوي المركب العالمي (2023 - 2031) | 8.4% |
| البيانات التاريخية | 2021-2022 |
| فترة التنبؤ | 2024-2031 |
| القطاعات المغطاة | حسب المكونات
|
| المناطق والدول المغطاة | أمريكا الشمالية
|
| قادة السوق وملفات تعريف الشركات الرئيسية |
|
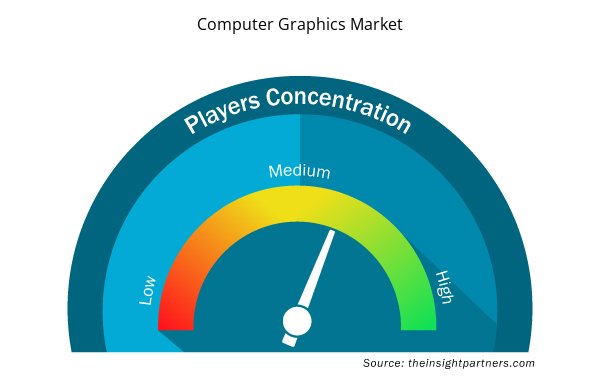
كثافة اللاعبين في سوق الرسوميات الحاسوبية: فهم تأثيرها على ديناميكيات الأعمال
يشهد سوق الرسوميات الحاسوبية نموًا سريعًا، مدفوعًا بالطلب المتزايد من المستخدم النهائي بسبب عوامل مثل تفضيلات المستهلك المتطورة والتقدم التكنولوجي والوعي المتزايد بفوائد المنتج. ومع ارتفاع الطلب، تعمل الشركات على توسيع عروضها والابتكار لتلبية احتياجات المستهلكين والاستفادة من الاتجاهات الناشئة، مما يؤدي إلى زيادة نمو السوق.
تشير كثافة اللاعبين في السوق إلى توزيع الشركات أو المؤسسات العاملة في سوق أو صناعة معينة. وهي تشير إلى عدد المنافسين (اللاعبين في السوق) الموجودين في مساحة سوق معينة نسبة إلى حجمها أو قيمتها السوقية الإجمالية.
الشركات الرئيسية العاملة في سوق الرسوميات الحاسوبية هي:
- شركة أدوبي
- شركة أدفانسد مايكرو ديفايسز (AMD)
- شركة أوتوديسك
- داسو سيستمز
- شركة إنتل
إخلاء المسؤولية : الشركات المذكورة أعلاه ليست مرتبة بأي ترتيب معين.
- احصل على نظرة عامة على أهم اللاعبين الرئيسيين في سوق الرسوميات الحاسوبية
نقاط البيع الرئيسية
- التغطية الشاملة: يغطي التقرير بشكل شامل تحليل المنتجات والخدمات والأنواع والمستخدمين النهائيين لسوق الرسوميات الحاسوبية، مما يوفر صورة شاملة.
- تحليل الخبراء: تم تجميع التقرير على أساس الفهم العميق لخبراء الصناعة والمحللين.
- معلومات محدثة: يضمن التقرير أهمية الأعمال التجارية بسبب تغطيته للمعلومات الحديثة واتجاهات البيانات.
- خيارات التخصيص: يمكن تخصيص هذا التقرير لتلبية متطلبات العملاء المحددة وبما يتناسب مع استراتيجيات العمل بشكل مناسب.
وبالتالي، يمكن أن يساعد تقرير البحث حول سوق الرسوميات الحاسوبية في تمهيد الطريق لفك شفرة وفهم سيناريو الصناعة وآفاق النمو. ورغم وجود بعض المخاوف المشروعة، فإن الفوائد الإجمالية لهذا التقرير تميل إلى التفوق على العيوب.
- التحليل التاريخي (سنتان)، السنة الأساسية، التوقعات (7 سنوات) مع معدل النمو السنوي المركب
- تحليل PEST و SWOT
- حجم السوق والقيمة / الحجم - عالميًا وإقليميًا وقطريًا
- الصناعة والمنافسة
- مجموعة بيانات Excel


Report Coverage
Revenue forecast, Company Analysis, Industry landscape, Growth factors, and Trends

Segment Covered
This text is related
to segments covered.

Regional Scope
North America, Europe, Asia Pacific, Middle East & Africa, South & Central America

Country Scope
This text is related
to country scope.
الأسئلة الشائعة
Some of the customization options available based on the request are an additional 3-5 company profiles and country-specific analysis of 3-5 countries of your choice. Customizations are to be requested/discussed before making final order confirmation# as our team would review the same and check the feasibility
The report can be delivered in PDF/PPT format; we can also share excel dataset based on the request
The major factors driving the Computer Graphics market are Rapid Growth of the Gaming Industry and Adoption of Virtual Reality (VR) and Augmented Reality (AR).
Advancements in Artificial Intelligence (AI) and Machine Learning (ML) is anticipated to play a significant role in the global Computer Graphics market in the coming years.
The Computer Graphics Market is estimated to witness a CAGR of 8.4% from 2023 to 2031
Trends and growth analysis reports related to Technology, Media and Telecommunications : READ MORE..
1. Adobe Inc.
2. Advanced Micro Devices (AMD)
3. Autodesk Inc.
4. Dassault Systemes
5. Intel Corporation
6. Mentor Graphics
7. Microsoft
8. Nvidia
9. Siemens Digital Industries Software
10. Sony Corporation
The Insight Partners performs research in 4 major stages: Data Collection & Secondary Research, Primary Research, Data Analysis and Data Triangulation & Final Review.
- Data Collection and Secondary Research:
As a market research and consulting firm operating from a decade, we have published and advised several client across the globe. First step for any study will start with an assessment of currently available data and insights from existing reports. Further, historical and current market information is collected from Investor Presentations, Annual Reports, SEC Filings, etc., and other information related to company’s performance and market positioning are gathered from Paid Databases (Factiva, Hoovers, and Reuters) and various other publications available in public domain.
Several associations trade associates, technical forums, institutes, societies and organization are accessed to gain technical as well as market related insights through their publications such as research papers, blogs and press releases related to the studies are referred to get cues about the market. Further, white papers, journals, magazines, and other news articles published in last 3 years are scrutinized and analyzed to understand the current market trends.
- Primary Research:
The primarily interview analysis comprise of data obtained from industry participants interview and answers to survey questions gathered by in-house primary team.
For primary research, interviews are conducted with industry experts/CEOs/Marketing Managers/VPs/Subject Matter Experts from both demand and supply side to get a 360-degree view of the market. The primary team conducts several interviews based on the complexity of the markets to understand the various market trends and dynamics which makes research more credible and precise.
A typical research interview fulfils the following functions:
- Provides first-hand information on the market size, market trends, growth trends, competitive landscape, and outlook
- Validates and strengthens in-house secondary research findings
- Develops the analysis team’s expertise and market understanding
Primary research involves email interactions and telephone interviews for each market, category, segment, and sub-segment across geographies. The participants who typically take part in such a process include, but are not limited to:
- Industry participants: VPs, business development managers, market intelligence managers and national sales managers
- Outside experts: Valuation experts, research analysts and key opinion leaders specializing in the electronics and semiconductor industry.
Below is the breakup of our primary respondents by company, designation, and region:

Once we receive the confirmation from primary research sources or primary respondents, we finalize the base year market estimation and forecast the data as per the macroeconomic and microeconomic factors assessed during data collection.
- Data Analysis:
Once data is validated through both secondary as well as primary respondents, we finalize the market estimations by hypothesis formulation and factor analysis at regional and country level.
- Macro-Economic Factor Analysis:
We analyse macroeconomic indicators such the gross domestic product (GDP), increase in the demand for goods and services across industries, technological advancement, regional economic growth, governmental policies, the influence of COVID-19, PEST analysis, and other aspects. This analysis aids in setting benchmarks for various nations/regions and approximating market splits. Additionally, the general trend of the aforementioned components aid in determining the market's development possibilities.
- Country Level Data:
Various factors that are especially aligned to the country are taken into account to determine the market size for a certain area and country, including the presence of vendors, such as headquarters and offices, the country's GDP, demand patterns, and industry growth. To comprehend the market dynamics for the nation, a number of growth variables, inhibitors, application areas, and current market trends are researched. The aforementioned elements aid in determining the country's overall market's growth potential.
- Company Profile:
The “Table of Contents” is formulated by listing and analyzing more than 25 - 30 companies operating in the market ecosystem across geographies. However, we profile only 10 companies as a standard practice in our syndicate reports. These 10 companies comprise leading, emerging, and regional players. Nonetheless, our analysis is not restricted to the 10 listed companies, we also analyze other companies present in the market to develop a holistic view and understand the prevailing trends. The “Company Profiles” section in the report covers key facts, business description, products & services, financial information, SWOT analysis, and key developments. The financial information presented is extracted from the annual reports and official documents of the publicly listed companies. Upon collecting the information for the sections of respective companies, we verify them via various primary sources and then compile the data in respective company profiles. The company level information helps us in deriving the base number as well as in forecasting the market size.
- Developing Base Number:
Aggregation of sales statistics (2020-2022) and macro-economic factor, and other secondary and primary research insights are utilized to arrive at base number and related market shares for 2022. The data gaps are identified in this step and relevant market data is analyzed, collected from paid primary interviews or databases. On finalizing the base year market size, forecasts are developed on the basis of macro-economic, industry and market growth factors and company level analysis.
- Data Triangulation and Final Review:
The market findings and base year market size calculations are validated from supply as well as demand side. Demand side validations are based on macro-economic factor analysis and benchmarks for respective regions and countries. In case of supply side validations, revenues of major companies are estimated (in case not available) based on industry benchmark, approximate number of employees, product portfolio, and primary interviews revenues are gathered. Further revenue from target product/service segment is assessed to avoid overshooting of market statistics. In case of heavy deviations between supply and demand side values, all thes steps are repeated to achieve synchronization.
We follow an iterative model, wherein we share our research findings with Subject Matter Experts (SME’s) and Key Opinion Leaders (KOLs) until consensus view of the market is not formulated – this model negates any drastic deviation in the opinions of experts. Only validated and universally acceptable research findings are quoted in our reports.
We have important check points that we use to validate our research findings – which we call – data triangulation, where we validate the information, we generate from secondary sources with primary interviews and then we re-validate with our internal data bases and Subject matter experts. This comprehensive model enables us to deliver high quality, reliable data in shortest possible time.
 احصل على عينة مجانية لهذا التقرير