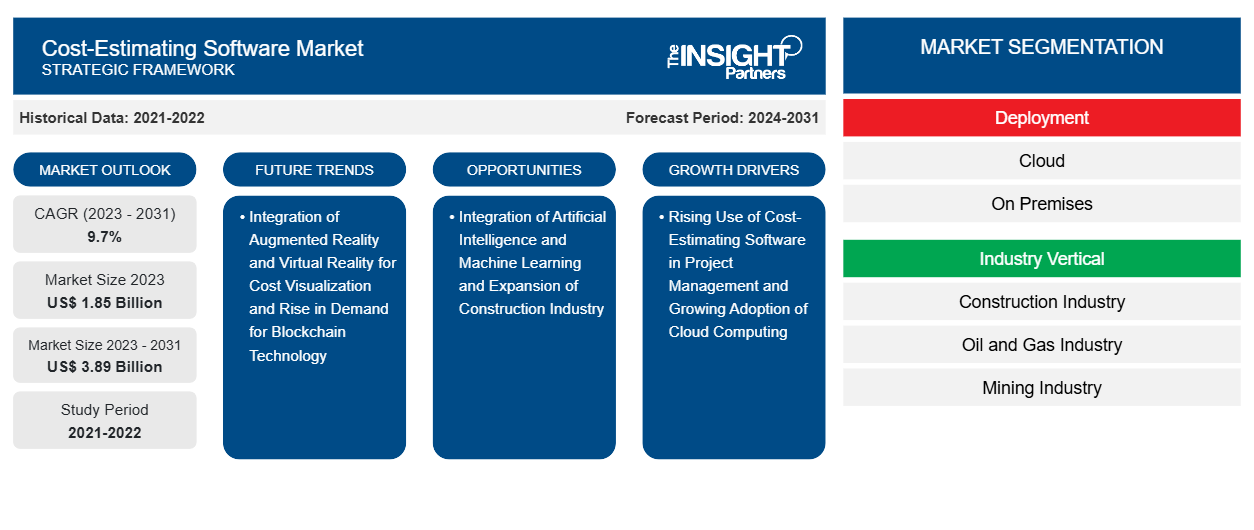
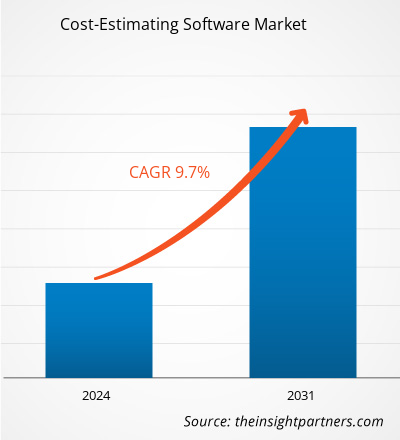
من المتوقع أن يصل حجم سوق برامج تقدير التكلفة إلى 3.89 مليار دولار أمريكي بحلول عام 2031 من 1.85 مليار دولار أمريكي في عام 2023. ومن المتوقع أن يسجل السوق معدل نمو سنوي مركب بنسبة 9.7٪ من عام 2023 إلى عام 2031. ومن المرجح أن يظل دمج الواقع المعزز والواقع الافتراضي لتصور التكلفة اتجاهًا رئيسيًا في السوق.
تحليل سوق برامج تقدير التكلفة
من المتوقع أن ينمو سوق برامج تقدير التكاليف بشكل كبير خلال فترة التنبؤ بسبب الاستخدام المتزايد للبرامج في إدارة المشاريع. يساعد البرنامج مديري المشاريع والمهندسين ومقدري التكاليف في تقدير الموارد المالية المطلوبة لإكمال المشروع ضمن معاييره. بالإضافة إلى ذلك، مع التبني المتزايد للحوسبة السحابية لتقدير التكاليف، يمكن للشركات الوصول بسرعة إلى البيانات ذات الصلة وإنشاء تقديرات دقيقة بسلاسة. علاوة على ذلك، فإن التبني المتزايد للتقنيات المتقدمة مثل الذكاء الاصطناعي (AI) والتعلم الآلي (ML) يمكن أن يحسن بشكل كبير من دقة تقديرات التكاليف من خلال توفير توقعات أكثر دقة. كما من المتوقع أن يؤدي زيادة أنشطة البناء إلى دفع الطلب على برامج تقدير التكاليف لأنها يمكن أن تساعد بسرعة ودقة في تقدير نفقات المشروع. علاوة على ذلك، من المتوقع أن يؤدي الطلب المتزايد على تصور التكاليف من خلال الواقع الافتراضي والواقع المعزز ودمج تقنية blockchain لتقدير التكاليف الشفاف إلى دفع نمو سوق برامج تقدير التكاليف خلال الفترة المتوقعة.
نظرة عامة على سوق برامج تقدير التكاليف
يجمع برنامج تقدير التكاليف بين عدة مناهج وموارد لتوفير تقديرات دقيقة للتكاليف. ويساعد المؤسسات على اتخاذ قرارات مالية أكثر استنارة من خلال الجمع بين البيانات التاريخية واتجاهات السوق الحالية. يحتوي البرنامج على مجموعة متنوعة من الوظائف المضمنة التي تتيح للمستخدمين إجراء تحليل متعمق للميزانية والنفقات. تعمل أتمتة العمليات الحسابية الصعبة على تقليل احتمالية الخطأ البشري إلى حد كبير. علاوة على ذلك، فهو يتيح مراجعة البيانات في الوقت الفعلي، مما يضمن أن تكون التقديرات ذات صلة طوال دورة حياة المشروع.
قم بتخصيص هذا التقرير ليناسب متطلباتك
ستحصل على تخصيص لأي تقرير - مجانًا - بما في ذلك أجزاء من هذا التقرير، أو تحليل على مستوى الدولة، وحزمة بيانات Excel، بالإضافة إلى الاستفادة من العروض والخصومات الرائعة للشركات الناشئة والجامعات
- احصل على أهم اتجاهات السوق الرئيسية لهذا التقرير.ستتضمن هذه العينة المجانية تحليلاً للبيانات، بدءًا من اتجاهات السوق وحتى التقديرات والتوقعات.
محركات وفرص سوق برمجيات تقدير التكلفة
الاستخدام المتزايد لبرامج تقدير التكاليف في إدارة المشاريع
الكفاءة والدقة أمران بالغي الأهمية في مجال إدارة المشاريع المتغير باستمرار . إن استخدام برنامج تقدير التكاليف يحسن هذه المجالات بشكل كبير ويقدم العديد من المزايا. فهو يحسن الدقة بشكل كبير من خلال تقليل الأخطاء من خلال استخدام خوارزميات متطورة، مما يضمن تقديرات ميزانية أكثر دقة. بالإضافة إلى ذلك، يعمل البرنامج على تسريع إجراءات التقدير. يمكن إكمال المهام التي كانت تستغرق ساعات أو أيامًا في دقائق باستخدام البرنامج. بالإضافة إلى توفير الوقت، تمكن هذه الفعالية مديري المشاريع من الاستجابة للتغييرات بشكل أسرع، وتجنب التأخير.
توفر برامج تقدير التكاليف اتساقًا استثنائيًا لأنها تستخدم طريقة حسابية موحدة، مما يضمن التوحيد عبر جميع تقديرات المشروع. هذا التوحيد مطلوب للمقارنة الدقيقة وتحليل المشاريع أو المقترحات المختلفة. كما تعمل البرامج على تحسين عملية اتخاذ القرار. عندما يكون لدى المديرين بيانات دقيقة وجديرة بالثقة تحت تصرفهم، يمكنهم اتخاذ قرارات أفضل بشأن جدوى المشروع وتخصيص الميزانية. ونتيجة لذلك، يتم التخطيط للمشاريع وتنفيذها بشكل أكثر استراتيجية، مما يزيد من الموارد ويقلل من الهدر. تشجع برامج تقدير التكاليف أيضًا المساءلة والانفتاح بين أعضاء فريق المشروع. تجعل تفاصيل التكلفة التي يمكن الوصول إليها من السهل تتبع النفقات والدفاع عن الخيارات الميزانية، وبناء الثقة بين الأطراف المهتمة وتسهيل إكمال المشاريع بنجاح. وبالتالي، نظرًا لأن برامج تقدير التكاليف تساعد في تعزيز الدقة والكفاءة لتعزيز المساءلة واتخاذ القرارات الاستراتيجية، فإن الطلب عليها يتزايد، مما يعزز نمو سوق برامج تقدير التكاليف على مستوى العالم.
دمج الذكاء الاصطناعي والتعلم الآلي
تعتمد نماذج تقدير التكلفة التقليدية في كثير من الأحيان على خصائص مختارة يدويًا، وهي تستغرق وقتًا طويلاً وعرضة للتحيز. ومع ذلك، فإن استخدام تقنيات مثل الذكاء الاصطناعي والتعلم الآلي يمكن أن يحسن بشكل كبير من دقة تقديرات التكلفة من خلال توفير توقعات أكثر دقة. يمكن تحليل مجموعات البيانات الكبيرة بسرعة بواسطة خوارزميات الذكاء الاصطناعي. ونتيجة لذلك، فإنها تكتشف الاتجاهات والأنماط التي قد يغفلها المحللون البشريون. تمكن هذه الميزة من إنشاء توقعات تكلفة معقدة تأخذ في الاعتبار مجموعة واسعة من المتغيرات. تتعلم أنظمة الذكاء الاصطناعي أيضًا باستمرار من البيانات الجديدة. وهذا يعني أنه نتيجة لتحسين دقتها بمرور الوقت، تصبح التقديرات أكثر دقة.
وعلى نحو مماثل، يساعد التعلم الآلي في تحسين التوقعات. فمن خلال استخدام نماذج متطورة، يصبح التعلم الآلي قادراً على التنبؤ بالنفقات في العديد من السيناريوهات. ويأخذ في الاعتبار مجموعة واسعة من العوامل التي قد تؤثر على تكاليف المشروع. على سبيل المثال، يدمج التحليل تلقائياً التغييرات في أسعار العمالة أو تكاليف المواد. ونظراً لمرونتها، فإن التقديرات مضمونة للبقاء دقيقة وذات صلة حتى عندما تتغير ظروف المشروع. وعلاوة على ذلك، تستغرق التقديرات وقتاً أقل كثيراً بسبب الذكاء الاصطناعي والتعلم الآلي، مما يسرع مرحلة التخطيط ويمكِّن من ردود الفعل الأكثر استجابة لتغيرات السوق. وبالتالي، من المتوقع أن يؤدي دمج التقنيات المتقدمة مثل الذكاء الاصطناعي والتعلم الآلي إلى تغذية نمو سوق برامج تقدير التكاليف خلال فترة التنبؤ.
تقرير تحليل تجزئة سوق برامج تقدير التكلفة
إن القطاعات الرئيسية التي ساهمت في استخلاص تحليل سوق برمجيات تقدير التكلفة هي قطاعات النشر والقطاع الرأسي.
- من خلال النشر، ينقسم السوق إلى السحابة والمحلية. يهيمن قطاع السحابة على السوق في عام 2023.
- بناءً على القطاع الصناعي، يتم تقسيم السوق إلى صناعة البناء وصناعة النفط والغاز وصناعة التعدين وصناعة الطاقة وغيرها. هيمن قطاع صناعة البناء على السوق في عام 2023.
تحليل حصة سوق برامج تقدير التكلفة حسب المنطقة الجغرافية
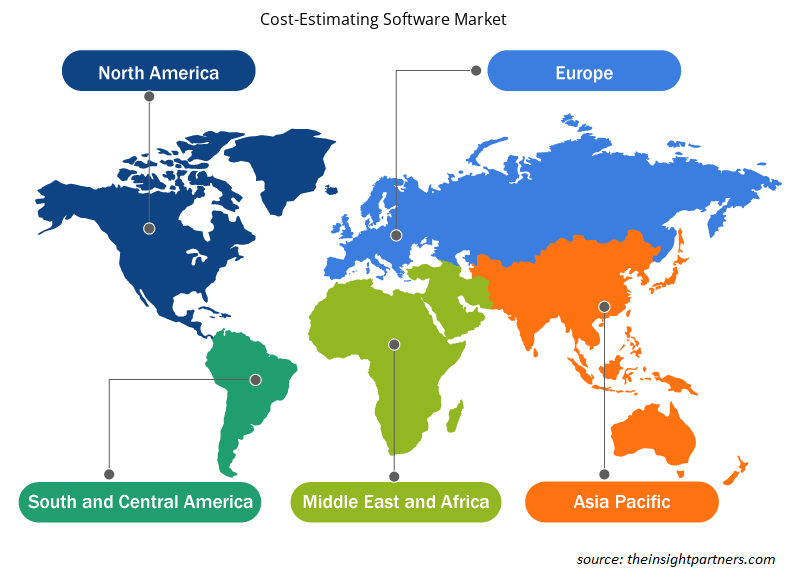
- تم تقسيم سوق برامج تقدير التكلفة إلى خمس مناطق رئيسية: أمريكا الشمالية وأوروبا وآسيا والمحيط الهادئ والشرق الأوسط وأفريقيا وأمريكا الجنوبية والوسطى. سيطرت أمريكا الشمالية على السوق في عام 2023، تليها أوروبا ومنطقة آسيا والمحيط الهادئ.
- تشهد سوق برامج تقدير التكاليف في أمريكا الشمالية نموًا كبيرًا بسبب الاستثمارات المتزايدة في صناعة البناء. وقد تولت الولايات المتحدة زمام المبادرة في سوق أمريكا الشمالية، بينما تتخلف عنها كندا والمكسيك عن كثب من حيث حصة السوق. وعلاوة على ذلك، تقدم العديد من الشركات برامج تقدير التكاليف في أمريكا الشمالية. على سبيل المثال، يعتبر RSMeans Data Online أفضل برنامج لتقدير تكاليف البناء في أمريكا الشمالية. إنه خيار شائع للشركات التي تحتاج إلى وصول تعاوني ويأتي في ثلاثة مستويات مصممة لتلبية متطلبات تقدير البناء. تقدم الشركة قاعدة بيانات كاملة لتكاليف البناء في أمريكا الشمالية، بما في ذلك التفاصيل المتعلقة بالمواد والمعدات والعمالة والإنتاجية.
رؤى إقليمية حول سوق برامج تقدير التكاليف
لقد قام المحللون في Insight Partners بشرح الاتجاهات والعوامل الإقليمية المؤثرة على سوق برامج تقدير التكاليف طوال فترة التوقعات بشكل شامل. يناقش هذا القسم أيضًا قطاعات سوق برامج تقدير التكاليف والجغرافيا في جميع أنحاء أمريكا الشمالية وأوروبا ومنطقة آسيا والمحيط الهادئ والشرق الأوسط وأفريقيا وأمريكا الجنوبية والوسطى.

- احصل على البيانات الإقليمية المحددة لسوق برامج تقدير التكلفة
نطاق تقرير سوق برامج تقدير التكلفة
| سمة التقرير | تفاصيل |
|---|---|
| حجم السوق في عام 2023 | 1.85 مليار دولار أمريكي |
| حجم السوق بحلول عام 2031 | 3.89 مليار دولار أمريكي |
| معدل النمو السنوي المركب العالمي (2023 - 2031) | 9.7% |
| البيانات التاريخية | 2021-2022 |
| فترة التنبؤ | 2024-2031 |
| القطاعات المغطاة | حسب النشر
|
| المناطق والدول المغطاة | أمريكا الشمالية
|
| قادة السوق وملفات تعريف الشركات الرئيسية |
|
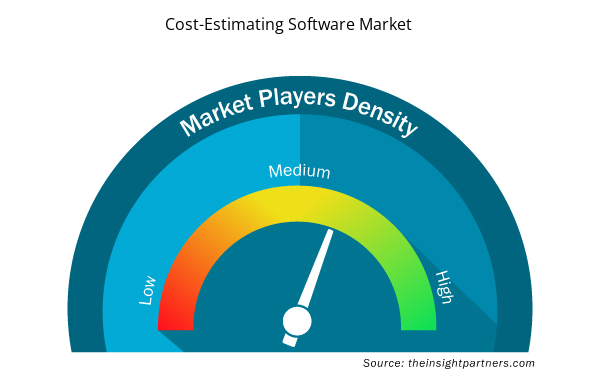
كثافة اللاعبين في سوق برمجيات تقدير التكلفة: فهم تأثيرها على ديناميكيات الأعمال
يشهد سوق برامج تقدير التكاليف نموًا سريعًا، مدفوعًا بالطلب المتزايد من المستخدم النهائي بسبب عوامل مثل تفضيلات المستهلكين المتطورة والتقدم التكنولوجي والوعي المتزايد بفوائد المنتج. ومع ارتفاع الطلب، تعمل الشركات على توسيع عروضها والابتكار لتلبية احتياجات المستهلكين والاستفادة من الاتجاهات الناشئة، مما يؤدي إلى زيادة نمو السوق.
تشير كثافة اللاعبين في السوق إلى توزيع الشركات أو المؤسسات العاملة في سوق أو صناعة معينة. وهي تشير إلى عدد المنافسين (اللاعبين في السوق) الموجودين في مساحة سوق معينة نسبة إلى حجمها أو قيمتها السوقية الإجمالية.
الشركات الرئيسية العاملة في سوق برمجيات تقدير التكلفة هي:
- شركة سيلزفورس
- شركة أوراكل
- مجموعة سيج المحدودة
- شركة تريمبل
- شركة بروكور للتكنولوجيا
- شركة أوتوديسك
إخلاء المسؤولية : الشركات المذكورة أعلاه ليست مرتبة بأي ترتيب معين.

- احصل على نظرة عامة على أهم اللاعبين الرئيسيين في سوق برامج تقدير التكاليف
أخبار سوق برامج تقدير التكلفة والتطورات الأخيرة
يتم تقييم سوق برامج تقدير التكاليف من خلال جمع البيانات النوعية والكمية بعد البحث الأولي والثانوي، والذي يتضمن منشورات الشركات المهمة وبيانات الجمعيات وقواعد البيانات. فيما يلي بعض التطورات في سوق برامج تقدير التكاليف:
- أعلنت شركة Salesforce، الشركة العالمية الرائدة في مجال إدارة علاقات العملاء، عن توسيع مركز التميز في حيدر أباد، مما يعزز بشكل كبير من حضور الشركة في الهند. وقد استثمرت شركة Salesforce في الهند على مدار العقد الماضي. وقد افتُتح مركز التميز في حيدر أباد في عام 2016، مما رسخ مكانة الهند كمركز رائد للمواهب والابتكار العالمي للشركة. تضم شركة Salesforce أكثر من 9000 موظف في الهند عبر مكاتب في بنغالورو ومومباي ودلهي وحيدر أباد وبوني وجايبور.
(المصدر: Salesforce، بيان صحفي، مارس 2023)
- أعلنت شركة Oracle عن خدمة Oracle Construction Intelligence Cloud Service، وهي مجموعة جديدة من تطبيقات الذكاء الاصطناعي والتحليلات لصناعات الهندسة والبناء. غالبًا ما تواجه مشاريع البناء مشكلات تؤثر على الإنتاجية والسلامة والربحية. تستخدم المجموعة الجديدة التعلم الآلي لتحليل بيانات المشروع المُدارة في حلول Oracle Construction and Engineering بشكل مستمر لتحديد هذه المخاطر المحتملة وانعدام الكفاءة في وقت مبكر، مما يساعد المؤسسات على اتخاذ قرارات أفضل.
(المصدر: Oracle، بيان صحفي، فبراير 2021)
تغطية تقرير سوق برامج تقدير التكلفة والمنتجات النهائية
يوفر "حجم سوق برمجيات تقدير التكلفة والتوقعات (2021-2031)" تحليلاً مفصلاً للسوق يغطي المجالات المذكورة أدناه:
- حجم سوق برامج تقدير التكلفة والتنبؤ به على المستويات العالمية والإقليمية والوطنية لجميع قطاعات السوق الرئيسية التي يغطيها النطاق
- اتجاهات سوق برامج تقدير التكلفة بالإضافة إلى ديناميكيات السوق مثل المحركات والقيود والفرص الرئيسية
- تحليل مفصل لـ PEST و SWOT
- تحليل سوق برامج تقدير التكلفة الذي يغطي اتجاهات السوق الرئيسية والإطار العالمي والإقليمي والجهات الفاعلة الرئيسية واللوائح والتطورات الأخيرة في السوق
- تحليل المشهد الصناعي والمنافسة الذي يغطي تركيز السوق، وتحليل خريطة الحرارة، واللاعبين البارزين، والتطورات الأخيرة لسوق برامج تقدير التكلفة
- ملفات تعريف الشركة التفصيلية
- التحليل التاريخي (سنتان)، السنة الأساسية، التوقعات (7 سنوات) مع معدل النمو السنوي المركب
- تحليل PEST و SWOT
- حجم السوق والقيمة / الحجم - عالميًا وإقليميًا وقطريًا
- الصناعة والمنافسة
- مجموعة بيانات Excel


Report Coverage
Revenue forecast, Company Analysis, Industry landscape, Growth factors, and Trends

Segment Covered
This text is related
to segments covered.

Regional Scope
North America, Europe, Asia Pacific, Middle East & Africa, South & Central America

Country Scope
This text is related
to country scope.
الأسئلة الشائعة
Asia Pacific is anticipated to grow at the fastest CAGR over the forecast period.
The key players operating in the cost-estimating software market include Salesforce Inc, Oracle Corp, Sage Group Plc, Trimble Inc, Procore Technologies Inc, Autodesk Inc, RIB Software, Elecosoft, ConstructConnect, and MTI Systems, Inc.
The cloud segment led the cost-estimating software market with a significant share in 2023.
Integration of augmented reality and virtual reality for cost visualization is expected to drive the growth of the cost-estimating software market in the coming years.
The cost-estimating software market is expected to reach US$ 3.89 Billion by 2031.
The rising use of cost-estimating software in project management and the growing adoption of cloud computing are driving factors in the cost-estimating software market.
The cost-estimating software market was estimated to be valued at US$ 1.85 billion in 2023 and is anticipated to grow at a CAGR of 9.7% over the forecast period.
Trends and growth analysis reports related to Technology, Media and Telecommunications : READ MORE..
The List of Companies - Cost-Estimating Software Market
- Salesforce Inc
- Oracle Corp
- Sage Group Plc
- Trimble Inc
- Procore Technologies Inc
- Autodesk Inc
- RIB Software
- Elecosoft
- ConstructConnect
- MTI Systems, Inc
The Insight Partners performs research in 4 major stages: Data Collection & Secondary Research, Primary Research, Data Analysis and Data Triangulation & Final Review.
- Data Collection and Secondary Research:
As a market research and consulting firm operating from a decade, we have published and advised several client across the globe. First step for any study will start with an assessment of currently available data and insights from existing reports. Further, historical and current market information is collected from Investor Presentations, Annual Reports, SEC Filings, etc., and other information related to company’s performance and market positioning are gathered from Paid Databases (Factiva, Hoovers, and Reuters) and various other publications available in public domain.
Several associations trade associates, technical forums, institutes, societies and organization are accessed to gain technical as well as market related insights through their publications such as research papers, blogs and press releases related to the studies are referred to get cues about the market. Further, white papers, journals, magazines, and other news articles published in last 3 years are scrutinized and analyzed to understand the current market trends.
- Primary Research:
The primarily interview analysis comprise of data obtained from industry participants interview and answers to survey questions gathered by in-house primary team.
For primary research, interviews are conducted with industry experts/CEOs/Marketing Managers/VPs/Subject Matter Experts from both demand and supply side to get a 360-degree view of the market. The primary team conducts several interviews based on the complexity of the markets to understand the various market trends and dynamics which makes research more credible and precise.
A typical research interview fulfils the following functions:
- Provides first-hand information on the market size, market trends, growth trends, competitive landscape, and outlook
- Validates and strengthens in-house secondary research findings
- Develops the analysis team’s expertise and market understanding
Primary research involves email interactions and telephone interviews for each market, category, segment, and sub-segment across geographies. The participants who typically take part in such a process include, but are not limited to:
- Industry participants: VPs, business development managers, market intelligence managers and national sales managers
- Outside experts: Valuation experts, research analysts and key opinion leaders specializing in the electronics and semiconductor industry.
Below is the breakup of our primary respondents by company, designation, and region:

Once we receive the confirmation from primary research sources or primary respondents, we finalize the base year market estimation and forecast the data as per the macroeconomic and microeconomic factors assessed during data collection.
- Data Analysis:
Once data is validated through both secondary as well as primary respondents, we finalize the market estimations by hypothesis formulation and factor analysis at regional and country level.
- Macro-Economic Factor Analysis:
We analyse macroeconomic indicators such the gross domestic product (GDP), increase in the demand for goods and services across industries, technological advancement, regional economic growth, governmental policies, the influence of COVID-19, PEST analysis, and other aspects. This analysis aids in setting benchmarks for various nations/regions and approximating market splits. Additionally, the general trend of the aforementioned components aid in determining the market's development possibilities.
- Country Level Data:
Various factors that are especially aligned to the country are taken into account to determine the market size for a certain area and country, including the presence of vendors, such as headquarters and offices, the country's GDP, demand patterns, and industry growth. To comprehend the market dynamics for the nation, a number of growth variables, inhibitors, application areas, and current market trends are researched. The aforementioned elements aid in determining the country's overall market's growth potential.
- Company Profile:
The “Table of Contents” is formulated by listing and analyzing more than 25 - 30 companies operating in the market ecosystem across geographies. However, we profile only 10 companies as a standard practice in our syndicate reports. These 10 companies comprise leading, emerging, and regional players. Nonetheless, our analysis is not restricted to the 10 listed companies, we also analyze other companies present in the market to develop a holistic view and understand the prevailing trends. The “Company Profiles” section in the report covers key facts, business description, products & services, financial information, SWOT analysis, and key developments. The financial information presented is extracted from the annual reports and official documents of the publicly listed companies. Upon collecting the information for the sections of respective companies, we verify them via various primary sources and then compile the data in respective company profiles. The company level information helps us in deriving the base number as well as in forecasting the market size.
- Developing Base Number:
Aggregation of sales statistics (2020-2022) and macro-economic factor, and other secondary and primary research insights are utilized to arrive at base number and related market shares for 2022. The data gaps are identified in this step and relevant market data is analyzed, collected from paid primary interviews or databases. On finalizing the base year market size, forecasts are developed on the basis of macro-economic, industry and market growth factors and company level analysis.
- Data Triangulation and Final Review:
The market findings and base year market size calculations are validated from supply as well as demand side. Demand side validations are based on macro-economic factor analysis and benchmarks for respective regions and countries. In case of supply side validations, revenues of major companies are estimated (in case not available) based on industry benchmark, approximate number of employees, product portfolio, and primary interviews revenues are gathered. Further revenue from target product/service segment is assessed to avoid overshooting of market statistics. In case of heavy deviations between supply and demand side values, all thes steps are repeated to achieve synchronization.
We follow an iterative model, wherein we share our research findings with Subject Matter Experts (SME’s) and Key Opinion Leaders (KOLs) until consensus view of the market is not formulated – this model negates any drastic deviation in the opinions of experts. Only validated and universally acceptable research findings are quoted in our reports.
We have important check points that we use to validate our research findings – which we call – data triangulation, where we validate the information, we generate from secondary sources with primary interviews and then we re-validate with our internal data bases and Subject matter experts. This comprehensive model enables us to deliver high quality, reliable data in shortest possible time.


 احصل على عينة مجانية لهذا التقرير