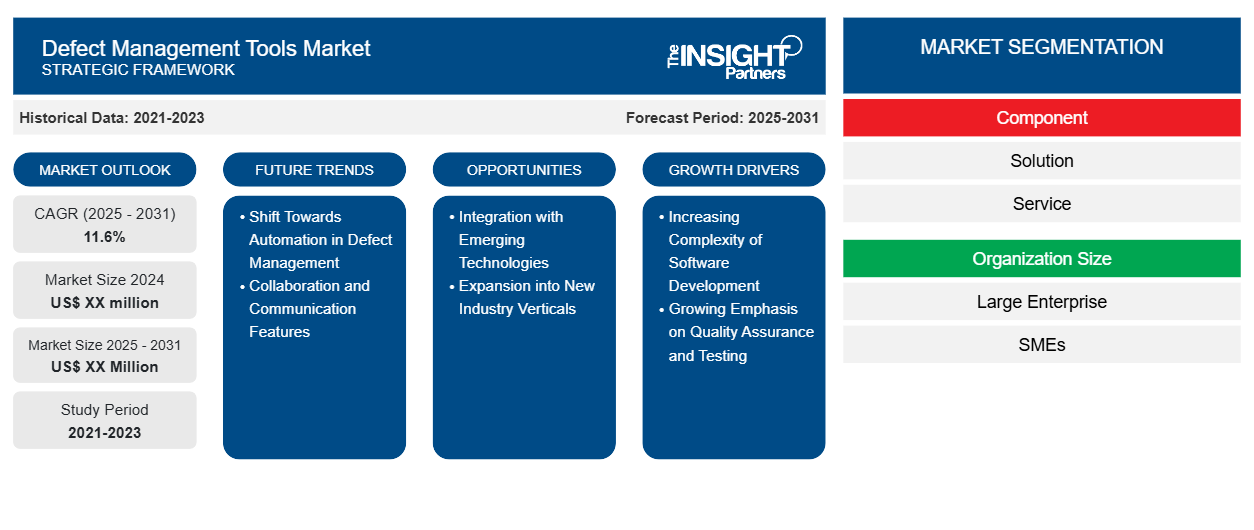
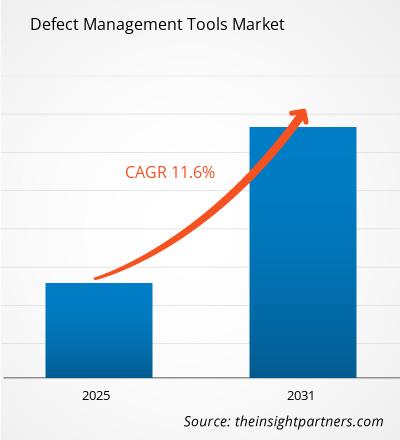
من المتوقع أن يسجل سوق أدوات إدارة العيوب معدل نمو سنوي مركب بنسبة 11.6٪ من عام 2025 إلى عام 2031، مع توسع حجم السوق من XX مليون دولار أمريكي في عام 2024 إلى XX مليون دولار أمريكي بحلول عام 2031.
يُقسّم التقرير حسب المكونات (الحلول، الخدمات)؛ وحجم المؤسسة (الشركات الكبيرة، الشركات الصغيرة والمتوسطة)؛ والقطاعات الرأسية (قطاعات الخدمات المصرفية والمالية والتأمين، والرعاية الصحية، والإعلام والترفيه، والاتصالات وتكنولوجيا المعلومات، والطاقة والمرافق، والضيافة، وتجارة التجزئة والتجارة الإلكترونية، والسيارات، وغيرها)؛ والجغرافيا (أمريكا الشمالية، وأوروبا، وآسيا والمحيط الهادئ، والشرق الأوسط وأفريقيا، وأمريكا الجنوبية والوسطى).
ويُفصّل التحليل العالمي بشكل أكبر على المستوى الإقليمي والدول الرئيسية. ويُقدّم التقرير القيمة بالدولار الأمريكي للتحليل والقطاعات المذكورة أعلاه.
غرض التقرير
يهدف تقرير "سوق أدوات إدارة العيوب" الصادر عن شركة "إنسايت بارتنرز" إلى وصف المشهد الحالي والنمو المستقبلي، وأهم العوامل المحفزة، والتحديات، والفرص المتاحة. وسيوفر هذا التقرير رؤى ثاقبة لمختلف أصحاب المصلحة في قطاع الأعمال، مثل:
- مزودي التكنولوجيا/المصنعين: لفهم ديناميكيات السوق المتطورة ومعرفة فرص النمو المحتملة، وتمكينهم من اتخاذ قرارات استراتيجية مستنيرة.
- المستثمرون: إجراء تحليل شامل للاتجاهات فيما يتعلق بمعدل نمو السوق، والتوقعات المالية للسوق، والفرص المتاحة عبر سلسلة القيمة.
- الهيئات التنظيمية: لتنظيم السياسات ومراقبة الأنشطة في السوق بهدف تقليل الانتهاكات والحفاظ على ثقة المستثمرين ودعم سلامة السوق واستقرارها.
تجزئة سوق أدوات إدارة العيوب
عنصر
- حل
- خدمة
حجم المنظمة
- الشركات الكبيرة
- الشركات الصغيرة والمتوسطة
رَأسِيّ
- الخدمات المصرفية والمالية والتأمين
- الرعاية الصحية
- الإعلام والترفيه
- الاتصالات وتكنولوجيا المعلومات
- الطاقة والمرافق
- ضيافة
- تجارة التجزئة والتجارة الإلكترونية
- السيارات
- آحرون
الجغرافيا
- أمريكا الشمالية
- أوروبا
- آسيا والمحيط الهادئ
- أمريكا الجنوبية والوسطى
- الشرق الأوسط وأفريقيا
قم بتخصيص هذا التقرير ليناسب متطلباتك
ستحصل على تخصيص لأي تقرير - مجانًا - بما في ذلك أجزاء من هذا التقرير، أو تحليل على مستوى الدولة، وحزمة بيانات Excel، بالإضافة إلى الاستفادة من العروض والخصومات الرائعة للشركات الناشئة والجامعات
سوق أدوات إدارة العيوب: رؤى استراتيجية
- احصل على أهم اتجاهات السوق الرئيسية لهذا التقرير.ستتضمن هذه العينة المجانية تحليل البيانات، بدءًا من اتجاهات السوق وحتى التقديرات والتوقعات.
عوامل نمو سوق أدوات إدارة العيوب
- تزايد تعقيد تطوير البرمجيات: مع تزايد تعقيد تطوير البرمجيات، واعتماد منهجيات أجايل وممارسات DevOps، ازدادت الحاجة إلى أدوات فعّالة لإدارة العيوب بشكل ملحوظ. غالبًا ما تتضمن مشاريع البرمجيات الحديثة فرقًا متعددة تعمل في وقت واحد، مما يزيد من احتمالية ظهور العيوب والمشاكل أثناء التطوير. توفر أدوات إدارة العيوب منصة مركزية لتتبع العيوب والإبلاغ عنها وحلّها، مما يضمن تعاون الفرق بفعالية والحفاظ على معايير جودة عالية طوال دورة حياة التطوير. هذا التعقيد يدفع الطلب على حلول فعّالة لإدارة العيوب تُبسّط العمليات وتُحسّن التواصل بين أصحاب المصلحة.
- تزايد التركيز على ضمان الجودة والاختبار: تولي المؤسسات أولوية متزايدة لضمان الجودة والاختبار كعنصرين أساسيين في عمليات تطوير البرمجيات. وقد أدى تنامي مبادرات التحول الرقمي إلى زيادة الحاجة إلى تطبيقات برمجية موثوقة وعالية الأداء. وتلعب أدوات إدارة العيوب دورًا حيويًا في ضمان تحديد العيوب ومعالجتها بسرعة، مما يُحسّن الجودة العامة لمنتجات البرمجيات. ومع إدراك الشركات لأهمية تقديم تجارب مستخدم مثالية، من المتوقع أن يزداد الطلب على أدوات إدارة العيوب التي تُسهّل إجراء اختبارات شاملة وضمان الجودة.
اتجاهات مستقبل سوق أدوات إدارة العيوب
- التحول نحو الأتمتة في إدارة العيوب: يتزايد التوجه نحو الأتمتة في عمليات إدارة العيوب. وتسعى المؤسسات بشكل متزايد إلى أدوات تُمكّن من أتمتة المهام المتكررة، مثل تسجيل العيوب وتحديثات الحالة وإعداد التقارير. لا تُحسّن الأتمتة الكفاءة فحسب، بل تُقلل أيضًا من خطر الخطأ البشري في إدارة العيوب. ونتيجةً لذلك، تزداد شعبية أدوات إدارة العيوب التي تتضمن ميزات الأتمتة، مما يُمكّن الفرق من التركيز على الأنشطة ذات القيمة الأعلى، مثل التحليل والحل.
- ميزات التعاون والتواصل: تُركز أدوات إدارة العيوب الحديثة على تحسين التعاون والتواصل بين فرق التطوير والاختبار والعمليات. وتزداد شيوع ميزات مثل الإشعارات الفورية، وسير العمل القابلة للتخصيص، والتكامل المباشر مع منصات المراسلة (مثل Slack وMicrosoft Teams). تضمن هذه الميزات توافق جميع المشاركين في حل العيوب، مما يؤدي إلى تسريع حل المشكلات، وتحسين تتبع التقدم، وزيادة كفاءة العمل الجماعي طوال دورة تطوير البرمجيات.
فرص سوق أدوات إدارة العيوب
- التكامل مع التقنيات الناشئة: ثمة فرصة كبيرة لتكامل أدوات إدارة العيوب مع التقنيات الناشئة، مثل الذكاء الاصطناعي والتعلم الآلي. فمن خلال الاستفادة من الذكاء الاصطناعي والتعلم الآلي، يمكن لأدوات إدارة العيوب تعزيز قدراتها في مجالات مثل التحليلات التنبؤية، والكشف الآلي عن العيوب، وإعداد التقارير الذكية. وتساعد هذه التطورات المؤسسات على تحديد العيوب المحتملة بشكل استباقي قبل حدوثها، مما يُحسّن جودة البرامج بشكل عام، ويُقلل الوقت المُستغرق في الاختبار اليدوي. ويمكن للموردين الذين يُدمجون هذه التقنيات في حلول إدارة العيوب الخاصة بهم اكتساب ميزة تنافسية في السوق.
- التوسع في قطاعات صناعية جديدة: بينما تُستخدم أدوات إدارة العيوب بشكل رئيسي في تطوير البرمجيات، تُتاح للموردين فرصة توسيع نطاق عروضهم لتشمل قطاعات صناعية جديدة، مثل الرعاية الصحية، والتمويل، والتصنيع. تعتمد هذه القطاعات بشكل متزايد على حلول البرمجيات في العمليات الحيوية، وتُعد إدارة العيوب الفعّالة أمرًا بالغ الأهمية لضمان الامتثال والسلامة والموثوقية. ومن خلال تصميم أدوات إدارة العيوب لتلبية الاحتياجات المحددة لهذه القطاعات، يمكن للموردين الاستفادة من أسواق جديدة ودفع عجلة النمو.
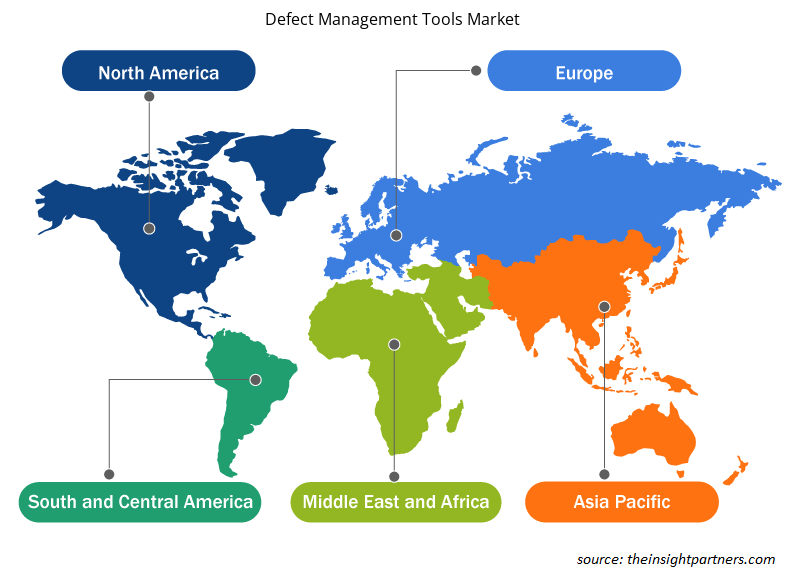
رؤى إقليمية حول سوق أدوات إدارة العيوب
قام محللو إنسايت بارتنرز بشرح شامل للاتجاهات والعوامل الإقليمية المؤثرة في سوق أدوات إدارة العيوب خلال فترة التوقعات. ويناقش هذا القسم أيضًا قطاعات سوق أدوات إدارة العيوب ونطاقها الجغرافي في أمريكا الشمالية، وأوروبا، وآسيا والمحيط الهادئ، والشرق الأوسط وأفريقيا، وأمريكا الجنوبية والوسطى.
- احصل على البيانات الإقليمية المحددة لسوق أدوات إدارة العيوب
نطاق تقرير سوق أدوات إدارة العيوب
| سمة التقرير | تفاصيل |
|---|---|
| حجم السوق في عام 2024 | XX مليون دولار أمريكي |
| حجم السوق بحلول عام 2031 | XX مليون دولار أمريكي |
| معدل النمو السنوي المركب العالمي (2025 - 2031) | 11.6% |
| البيانات التاريخية | 2021-2023 |
| فترة التنبؤ | 2025-2031 |
| القطاعات المغطاة | حسب المكون
|
| المناطق والدول المغطاة | أمريكا الشمالية
|
| قادة السوق وملفات تعريف الشركات الرئيسية |
|
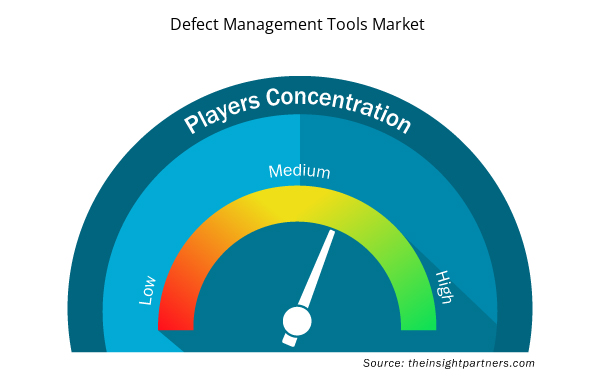
كثافة اللاعبين في سوق أدوات إدارة العيوب: فهم تأثيرها على ديناميكيات الأعمال
يشهد سوق أدوات إدارة العيوب نموًا سريعًا، مدفوعًا بتزايد طلب المستخدم النهائي نتيجةً لعوامل مثل تطور تفضيلات المستهلكين، والتقدم التكنولوجي، وزيادة الوعي بمزايا المنتج. ومع تزايد الطلب، تعمل الشركات على توسيع عروضها، والابتكار لتلبية احتياجات المستهلكين، والاستفادة من الاتجاهات الناشئة، مما يُعزز نمو السوق.
تشير كثافة اللاعبين في السوق إلى توزيع الشركات العاملة في سوق أو قطاع معين. وتشير إلى عدد المنافسين (اللاعبين في السوق) الموجودين في سوق معين نسبةً إلى حجمه أو قيمته السوقية الإجمالية.
الشركات الرئيسية العاملة في سوق أدوات إدارة العيوب هي:
- شركة آي بي إم
- شركة مايكروسوفت
- التركيز الدقيق
- تقنيات سي ايه
- زوهو
إخلاء المسؤولية : الشركات المذكورة أعلاه ليست مرتبة بأي ترتيب معين.
- احصل على نظرة عامة على أهم اللاعبين الرئيسيين في سوق أدوات إدارة العيوب
نقاط البيع الرئيسية
- التغطية الشاملة: يغطي التقرير بشكل شامل تحليل المنتجات والخدمات والأنواع والمستخدمين النهائيين لسوق أدوات إدارة العيوب، مما يوفر مشهدًا شاملاً.
- تحليل الخبراء: تم تجميع التقرير على أساس الفهم العميق لخبراء الصناعة والمحللين.
- المعلومات الحديثة: يضمن التقرير أهمية الأعمال التجارية بسبب تغطيته للمعلومات الحديثة واتجاهات البيانات.
- خيارات التخصيص: يمكن تخصيص هذا التقرير لتلبية متطلبات العملاء المحددة وتلبية استراتيجيات العمل بشكل مناسب.
لذا، يُمكن أن يُساعد تقرير البحث حول سوق أدوات إدارة العيوب في تمهيد الطريق لفهم سيناريوهات الصناعة وآفاق نموها. ورغم وجود بعض المخاوف المُبررة، إلا أن فوائد هذا التقرير الإجمالية تفوق عيوبه.
- التحليل التاريخي (سنتان)، السنة الأساسية، التوقعات (7 سنوات) مع معدل النمو السنوي المركب
- تحليل PEST و SWOT
- حجم السوق والقيمة / الحجم - عالميًا وإقليميًا وقطريًا
- الصناعة والمنافسة
- مجموعة بيانات Excel


Report Coverage
Revenue forecast, Company Analysis, Industry landscape, Growth factors, and Trends

Segment Covered
This text is related
to segments covered.

Regional Scope
North America, Europe, Asia Pacific, Middle East & Africa, South & Central America

Country Scope
This text is related
to country scope.
الأسئلة الشائعة
Some of the customization options available based on the request are an additional 3-5 company profiles and country-specific analysis of 3-5 countries of your choice. Customizations are to be requested/discussed before making final order confirmation# as our team would review the same and check the feasibility
The report can be delivered in PDF/PPT format; we can also share excel dataset based on the request
Shift Towards Automation in Defect Management is anticipated to play a significant role in the global Defect Management Tools Market in the coming years
Increasing Complexity of Software Development and Growing Emphasis on Quality Assurance and Testing are the major factors driving the Defect Management Tools Market
The Defect Management Tools Market is estimated to witness a CAGR of 11.6% from 2023 to 2031
Trends and growth analysis reports related to Technology, Media and Telecommunications : READ MORE..
1. IBM Corporation
2. Microsoft Corporation
3. Micro Focus
4. CA Technologies
5. ZOHO
6. Nulab
7. Wrike
8. Atlassian
9. Jama Software
10. Perforce Software, Inc
The Insight Partners performs research in 4 major stages: Data Collection & Secondary Research, Primary Research, Data Analysis and Data Triangulation & Final Review.
- Data Collection and Secondary Research:
As a market research and consulting firm operating from a decade, we have published and advised several client across the globe. First step for any study will start with an assessment of currently available data and insights from existing reports. Further, historical and current market information is collected from Investor Presentations, Annual Reports, SEC Filings, etc., and other information related to company’s performance and market positioning are gathered from Paid Databases (Factiva, Hoovers, and Reuters) and various other publications available in public domain.
Several associations trade associates, technical forums, institutes, societies and organization are accessed to gain technical as well as market related insights through their publications such as research papers, blogs and press releases related to the studies are referred to get cues about the market. Further, white papers, journals, magazines, and other news articles published in last 3 years are scrutinized and analyzed to understand the current market trends.
- Primary Research:
The primarily interview analysis comprise of data obtained from industry participants interview and answers to survey questions gathered by in-house primary team.
For primary research, interviews are conducted with industry experts/CEOs/Marketing Managers/VPs/Subject Matter Experts from both demand and supply side to get a 360-degree view of the market. The primary team conducts several interviews based on the complexity of the markets to understand the various market trends and dynamics which makes research more credible and precise.
A typical research interview fulfils the following functions:
- Provides first-hand information on the market size, market trends, growth trends, competitive landscape, and outlook
- Validates and strengthens in-house secondary research findings
- Develops the analysis team’s expertise and market understanding
Primary research involves email interactions and telephone interviews for each market, category, segment, and sub-segment across geographies. The participants who typically take part in such a process include, but are not limited to:
- Industry participants: VPs, business development managers, market intelligence managers and national sales managers
- Outside experts: Valuation experts, research analysts and key opinion leaders specializing in the electronics and semiconductor industry.
Below is the breakup of our primary respondents by company, designation, and region:

Once we receive the confirmation from primary research sources or primary respondents, we finalize the base year market estimation and forecast the data as per the macroeconomic and microeconomic factors assessed during data collection.
- Data Analysis:
Once data is validated through both secondary as well as primary respondents, we finalize the market estimations by hypothesis formulation and factor analysis at regional and country level.
- Macro-Economic Factor Analysis:
We analyse macroeconomic indicators such the gross domestic product (GDP), increase in the demand for goods and services across industries, technological advancement, regional economic growth, governmental policies, the influence of COVID-19, PEST analysis, and other aspects. This analysis aids in setting benchmarks for various nations/regions and approximating market splits. Additionally, the general trend of the aforementioned components aid in determining the market's development possibilities.
- Country Level Data:
Various factors that are especially aligned to the country are taken into account to determine the market size for a certain area and country, including the presence of vendors, such as headquarters and offices, the country's GDP, demand patterns, and industry growth. To comprehend the market dynamics for the nation, a number of growth variables, inhibitors, application areas, and current market trends are researched. The aforementioned elements aid in determining the country's overall market's growth potential.
- Company Profile:
The “Table of Contents” is formulated by listing and analyzing more than 25 - 30 companies operating in the market ecosystem across geographies. However, we profile only 10 companies as a standard practice in our syndicate reports. These 10 companies comprise leading, emerging, and regional players. Nonetheless, our analysis is not restricted to the 10 listed companies, we also analyze other companies present in the market to develop a holistic view and understand the prevailing trends. The “Company Profiles” section in the report covers key facts, business description, products & services, financial information, SWOT analysis, and key developments. The financial information presented is extracted from the annual reports and official documents of the publicly listed companies. Upon collecting the information for the sections of respective companies, we verify them via various primary sources and then compile the data in respective company profiles. The company level information helps us in deriving the base number as well as in forecasting the market size.
- Developing Base Number:
Aggregation of sales statistics (2020-2022) and macro-economic factor, and other secondary and primary research insights are utilized to arrive at base number and related market shares for 2022. The data gaps are identified in this step and relevant market data is analyzed, collected from paid primary interviews or databases. On finalizing the base year market size, forecasts are developed on the basis of macro-economic, industry and market growth factors and company level analysis.
- Data Triangulation and Final Review:
The market findings and base year market size calculations are validated from supply as well as demand side. Demand side validations are based on macro-economic factor analysis and benchmarks for respective regions and countries. In case of supply side validations, revenues of major companies are estimated (in case not available) based on industry benchmark, approximate number of employees, product portfolio, and primary interviews revenues are gathered. Further revenue from target product/service segment is assessed to avoid overshooting of market statistics. In case of heavy deviations between supply and demand side values, all thes steps are repeated to achieve synchronization.
We follow an iterative model, wherein we share our research findings with Subject Matter Experts (SME’s) and Key Opinion Leaders (KOLs) until consensus view of the market is not formulated – this model negates any drastic deviation in the opinions of experts. Only validated and universally acceptable research findings are quoted in our reports.
We have important check points that we use to validate our research findings – which we call – data triangulation, where we validate the information, we generate from secondary sources with primary interviews and then we re-validate with our internal data bases and Subject matter experts. This comprehensive model enables us to deliver high quality, reliable data in shortest possible time.
 احصل على عينة مجانية لهذا التقرير