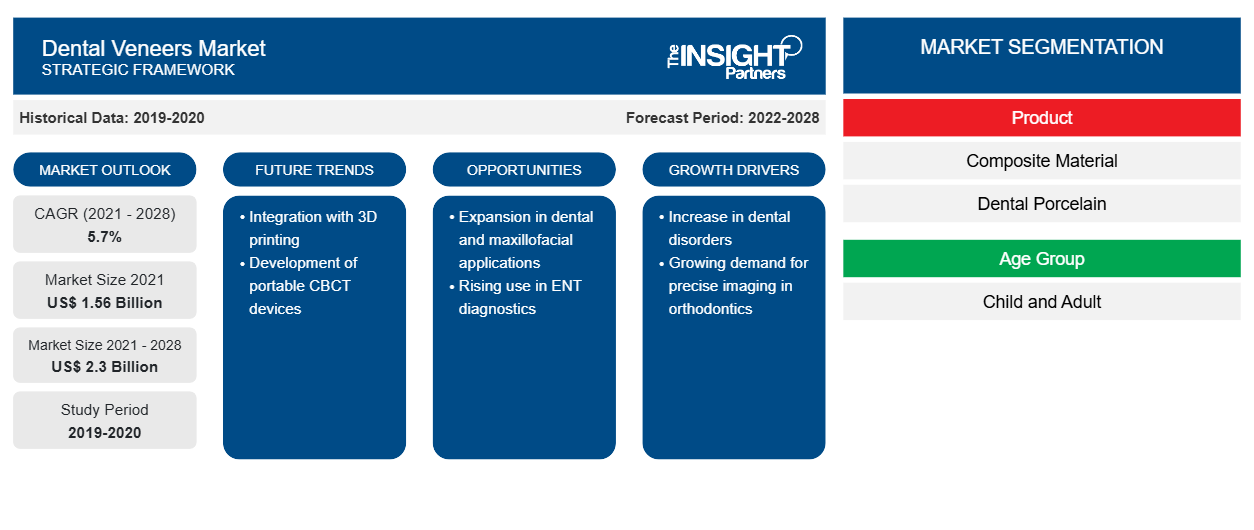
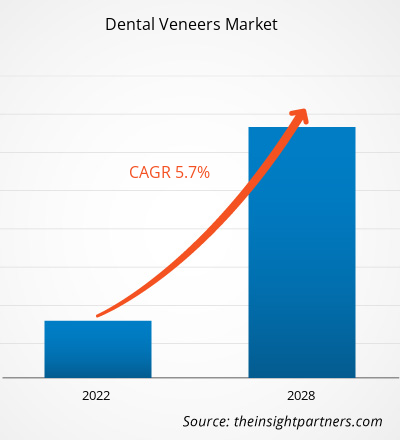
من المتوقع أن ينمو سوق قشور الأسنان من 1,559.28 مليون دولار أمريكي في عام 2021 إلى 2,302.60 مليون دولار أمريكي بحلول عام 2028؛ ومن المتوقع أن ينمو بمعدل نمو سنوي مركب قدره 5.7٪ خلال الفترة 2021-2028.CAGR of 5.7% during 2021–2028.
قشور الأسنان، والتي تسمى أيضًا قشور البورسلين أو صفائح البورسلين للأسنان ، هي قشور رقيقة مصنوعة حسب الطلب من مواد بلون الأسنان تهدف إلى تغطية السطح الأمامي للأسنان لتحسين المظهر. توضع هذه القشور أمام الأسنان لتغيير لونها أو شكلها أو حجمها أو طولها. يتم تخصيص العلاج لكل مريض وفقًا لاحتياجاته. يتم ربط قشور الأسنان باستخدام أسمنت الراتينج.
يعود نمو سوق قشور الأسنان إلى زيادة حالات اضطرابات الأسنان، ووعي المستهلكين المتزايد بشأن رعاية الأسنان، والتركيز المتزايد على الجماليات. ومع ذلك، فإن التكلفة العالية لإجراءات طب الأسنان التجميلية تعيق نمو السوق.
قم بتخصيص هذا التقرير ليناسب متطلباتك
ستحصل على تخصيص لأي تقرير - مجانًا - بما في ذلك أجزاء من هذا التقرير، أو تحليل على مستوى الدولة، وحزمة بيانات Excel، بالإضافة إلى الاستفادة من العروض والخصومات الرائعة للشركات الناشئة والجامعات
- احصل على أهم اتجاهات السوق الرئيسية لهذا التقرير.ستتضمن هذه العينة المجانية تحليلاً للبيانات، بدءًا من اتجاهات السوق وحتى التقديرات والتوقعات.
رؤى السوق:
زيادة حالات اضطرابات الأسنان
تتزايد الحاجة العالمية إلى قشور الأسنان بسبب زيادة مشاكل الأسنان مثل تغير اللون والتشوهات والأسنان المكسورة والمسافات غير المتساوية بين الأسنان. تُستخدم قشور الأسنان في أماكن مختلفة، مثل مؤسسات طب الأسنان والمستشفيات والعيادات السنية، مما يؤدي إلى إحصائيات نمو إيجابية لسوق قشور الأسنان. قد تكتسب قشور البورسلين حصة سوقية كبيرة بسبب الفوائد مثل المادة المتينة والقدرة على تحسين مظهر الأسنان. علاوة على ذلك، لا تفرض قشور الأسنان أي صيانة محددة؛ فهي تتطلب نظافة الفم الأساسية للحفاظ عليها في حالة جيدة. ونتيجة لذلك، قد تساهم هذه المتغيرات في زيادة معدل نمو السوق. وفقًا لبحث حديث من الأكاديمية الأمريكية لطب الأسنان التجميلي (AACD)، زاد الطلب على قشور البورسلين أكثر من أي وقت مضى. في الواقع، من حيث الشعبية في الولايات المتحدة، فإن إجراء طب الأسنان التجميلي هذا مخصص فقط لتبييض الأسنان. وفقًا لمنظمة الصحة العالمية في عام 2019، أثرت أمراض الفم على ما يقرب من 3.5 مليار شخص. وفقًا لمسح الجمعية الدولية لجراحة التجميل (ISAPS) لعام 2018، فإن أفضل 5 دول تجري معظم جراحات التجميل هي الولايات المتحدة والبرازيل والمكسيك وألمانيا والهند. شكلت الولايات المتحدة والبرازيل 28.4٪ من جميع الإجراءات التجميلية - الجراحية وغير الجراحية - في العالم في عام 2018. وفقًا لشركة Cosmetic Surgery Solicitors، وهي شركة رائدة في جراحة التجميل، أجرت البرازيل والولايات المتحدة جراحات تجميلية متساوية (1.5 مليون إجراء لكل منهما). خضع أكثر من ثلاثة أضعاف عدد الأشخاص في الولايات المتحدة لإجراءات غير جراحية مقارنة بالبرازيل - تم إجراء 2.8 مليون علاج تجميلي في الولايات المتحدة مقارنة بـ 769000 في البرازيل. وجد المسح السنوي من ISAPS أن العلاجات غير الجراحية زادت بنسبة 10.2٪ في جميع أنحاء العالم في عام 2020. قد تساعد العروض والخصومات المتنوعة لأطباء الأسنان في نمو سوق قشور الأسنان.AACD), demand for porcelain veneers has increased more than ever before. In fact, in terms of popularity in the US, this cosmetic dentistry procedure is only for teeth whitening. According to the World Health Organization in 2019, oral diseases affected nearly 3.5 billion people. According to the International Society of Aesthetic Plastic Surgery (ISAPS) survey of 2018, the top 5 countries that perform the most cosmetic surgeries are the US, Brazil, Mexico, Germany, and India. The US and Brazil accounted for 28.4% of all cosmetic procedures - surgical and nonsurgical - in the world in 2018. According to Cosmetic Surgery Solicitors, a leading cosmetic surgery company, Brazil and the US performed equal cosmetic surgeries (1.5 million procedures each). More than three times the number of people in the US underwent nonsurgical procedures than in Brazil - 2.8 million cosmetic treatments were carried out in US compared to 769,000 in Brazil. The annual survey from ISAPS found that noninvasive treatments increased by 10.2% worldwide in 2020. Dentists' various offers and discounts may assist the dental veneers market to grow.
رؤى قائمة على المنتج
يتم تقسيم سوق قشور الأسنان العالمية، بناءً على المنتج، إلى مواد مركبة ، وخزف الأسنان، وغيرها. استحوذ قطاع المواد المركبة على أكبر حصة من السوق في عام 2021. ومع ذلك، من المتوقع أن يسجل قطاع خزف الأسنان معدل نمو سنوي مركب بنسبة 6.4٪ في السوق خلال الفترة المتوقعة. CAGR of 6.4% in the market during the forecast period.
رؤى تعتمد على المستخدم النهائي
بناءً على المستخدم النهائي، يتم تقسيم سوق قشور الأسنان العالمية إلى مستشفيات وعيادات أسنان وغيرها. احتل قطاع عيادات الأسنان الحصة الأكبر من السوق في عام 2021 بسبب العدد المتزايد من مرافق عيادات الأسنان في جميع أنحاء العالم. وفقًا لمراكز السيطرة على الأمراض والوقاية منها (CDC)، في عام 2020، زار حوالي 63.0٪ من البالغين الذين تبلغ أعمارهم 18 عامًا أو أكثر عيادات الأسنان. علاوة على ذلك، من المتوقع أن يسجل نفس القطاع معدل نمو سنوي مركب بنسبة 5.8٪ في السوق خلال الفترة المتوقعة.CAGR of 5.8% in the market during the forecast period.
إن إطلاق المنتجات والحصول على الموافقات عليها هي استراتيجيات تتبناها الشركات عادة لتوسيع نطاق وجودها العالمي ومحافظ منتجاتها للهيمنة على سوق قشور الأسنان. وعلاوة على ذلك، يركز اللاعبون في السوق على استراتيجية الشراكة لتوسيع قاعدة عملائهم، الأمر الذي يسمح لهم بدوره بالحفاظ على اسم علامتهم التجارية عالميًا. ومن المتوقع أن يزدهر سوق قشور الأسنان في السنوات القادمة بسبب تطوير المنتجات المبتكرة من قبل اللاعبين في السوق.
نظرة إقليمية على سوق قشور الأسنان
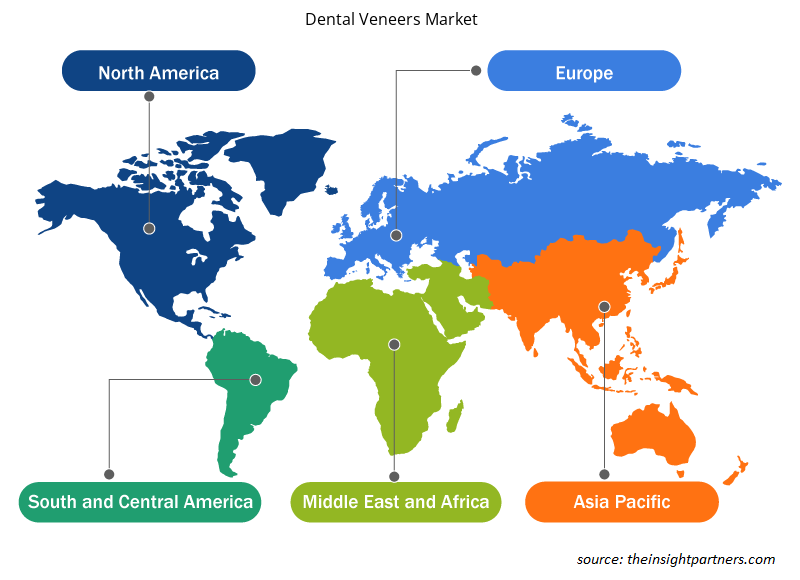
لقد قام المحللون في Insight Partners بشرح الاتجاهات والعوامل الإقليمية المؤثرة على سوق قشور الأسنان طوال فترة التوقعات بشكل شامل. يناقش هذا القسم أيضًا قطاعات سوق قشور الأسنان والجغرافيا في جميع أنحاء أمريكا الشمالية وأوروبا ومنطقة آسيا والمحيط الهادئ والشرق الأوسط وأفريقيا وأمريكا الجنوبية والوسطى.

- احصل على البيانات الإقليمية المحددة لسوق قشور الأسنان
نطاق تقرير سوق قشور الأسنان
| سمة التقرير | تفاصيل |
|---|---|
| حجم السوق في عام 2021 | 1.56 مليار دولار أمريكي |
| حجم السوق بحلول عام 2028 | 2.3 مليار دولار أمريكي |
| معدل النمو السنوي المركب العالمي (2021 - 2028) | 5.7% |
| البيانات التاريخية | 2019-2020 |
| فترة التنبؤ | 2022-2028 |
| القطاعات المغطاة | حسب المنتج
|
| المناطق والدول المغطاة | أمريكا الشمالية
|
| قادة السوق وملفات تعريف الشركات الرئيسية |
|
كثافة اللاعبين في سوق قشور الأسنان: فهم تأثيرها على ديناميكيات الأعمال
يشهد سوق قشور الأسنان نموًا سريعًا، مدفوعًا بالطلب المتزايد من المستخدم النهائي بسبب عوامل مثل تفضيلات المستهلكين المتطورة والتقدم التكنولوجي والوعي المتزايد بفوائد المنتج. ومع ارتفاع الطلب، تعمل الشركات على توسيع عروضها والابتكار لتلبية احتياجات المستهلكين والاستفادة من الاتجاهات الناشئة، مما يؤدي إلى زيادة نمو السوق.
تشير كثافة اللاعبين في السوق إلى توزيع الشركات أو المؤسسات العاملة في سوق أو صناعة معينة. وهي تشير إلى عدد المنافسين (اللاعبين في السوق) الموجودين في مساحة سوق معينة نسبة إلى حجمها أو قيمتها السوقية الإجمالية.
الشركات الرئيسية العاملة في سوق قشور الأسنان هي:
- جليدويل
- شركة أمان جيرباخ
- 3م
- فلادميفا
- سيراميك الزركون
إخلاء المسؤولية : الشركات المذكورة أعلاه ليست مرتبة بأي ترتيب معين.

- احصل على نظرة عامة على أهم اللاعبين الرئيسيين في سوق قشور الأسنان
نبذة عن الشركة
- دنتسبلاي سيرونا
- جليدويل
- منتجات أولترادنت، المحدودة
- شركة أمان جيرباخ
- 3م
- فلادميفا
- سيراميك الزركون
- شركة دن مات القابضة المحدودة
- بلانميكا أوي
- عيادة ليون للعناية بالأسنان
- شركة بيوليز
- شركة إيفوكلار فيفادنت ايه جي
- شركة هنكل ايه جي وشركاه، كيه جي ايه ايه
- محاذاة التكنولوجيا
- شركة كولجيت بالموليف
- شركة فيليبس الملكية
- التحليل التاريخي (سنتان)، السنة الأساسية، التوقعات (7 سنوات) مع معدل النمو السنوي المركب
- تحليل PEST و SWOT
- حجم السوق والقيمة / الحجم - عالميًا وإقليميًا وقطريًا
- الصناعة والمنافسة
- مجموعة بيانات Excel


- Batter and Breader Premixes Market
- Bioremediation Technology and Services Market
- Cling Films Market
- Personality Assessment Solution Market
- Machine Condition Monitoring Market
- Data Center Cooling Market
- Malaria Treatment Market
- Sports Technology Market
- Railway Braking System Market
- Clinical Trial Supplies Market

Report Coverage
Revenue forecast, Company Analysis, Industry landscape, Growth factors, and Trends

Segment Covered
This text is related
to segments covered.

Regional Scope
North America, Europe, Asia Pacific, Middle East & Africa, South & Central America

Country Scope
This text is related
to country scope.
الأسئلة الشائعة
Dental surgeons, along with paramedics, nurses, and other healthcare staff, are at the greatest risk of contracting and transmitting COVID-19. Dental clinics across the world have been shut down during the lockdown. The pandemic has changed the way the population has been accessing healthcare, and dental care is no exception. Also, as per the research article published in the British Dental Journal 2020, good oral hygiene is considered the best way to avoid airway infections in patients, especially among COVID-19 patients. The study suggested that the connection between oral microbiomes and COVID-19 complications should be further studied, as most of the comorbidities related to increased risk of complications in COVID-19 are also associated with oral biofilms and periodontal disease. Thus, because of the aforementioned factors, the studied market is expected to be significantly impacted during the pandemic.
North America held the largest share of the dental veneers market and is expected to continue its position over the coming years. The factors that have enabled North America region to be the largest market include the rising prevalence of dental diseases & traumatic injuries and technological advancements in the dental veneers that have significantly improved their efficiency and duration in the region. Moreover, in Canada, the market is expected to grow due to rising advancements in dental care services. In Mexico, the market is expected to grow due to increasing medical tourism.
Dentaply Sirona Inc. and Glidewell are the top two companies that hold huge market shares in the dental veneers market.
The Dental Veneers market majorly consists of players such as Dentaply Sirona Inc.; Glidewell; Amann Girrbach AG; 3M; VladMiVa, Zircon Ceramics; Den-Mat Holdings, LLC; Ultradent Products, Inc; PLANMECA OY; Lion Dental Care; Biolase, Inc.; Ivoclar Vivadent AG; Henkel AG & Company, KGAA; Align Technology; Colgate-Palmolive Company; Koninklijke Philips N.V. amongst others.
The composite material segment held the largest share of the market in the global dental veneers market and held the largest market share of 47.59% in 2021.
The adult segment dominated the global dental veneers market and accounted for the largest market share of 84.96% in 2021.
The dental clinics segment dominated the global dental veneers market and accounted for the largest market share of 71.31% in 2021.
Dental veneers also called porcelain veneers or dental porcelain laminates that are custom-made, wafer-thin shells of tooth-colored materials intended to cover the front surface of teeth to improve the appearance. These shells are used in front of the teeth changing their color, shape, size, or length. The treatment for every patient is customized for their unique needs. The bonding of dental veneers is done with resin cement.
Key factors that are driving the growth of this market are the increasing cases of dental disorders and growing consumer awareness and rising focus on aesthetics are expected to boost the market growth for dental veneers over the years.
The CAGR value of the dental veneers market during the forecasted period of 2021–2028 is 5.7%.
Trends and growth analysis reports related to Life Sciences : READ MORE..
The List of Companies - Dental Veneers Market
- Glidewell
- Amann Girrbach AG
- 3M
- VladMiVa
- Zircon Ceramics
- DEN-MAT Holdings, LLC
- ULTRADENT PRODUCTS Inc.
- PLANMECA OY
- Lion Dental Centre
- Biolase, Inc.
- Ivoclar Vivadent AG
- Henkel AG & COMPANY, KGAA
- Align Technology, Inc.
- Colgate-Palmolive Company
- Koninklijke Philips N.V.
- Dentsply SIRONA Inc.
The Insight Partners performs research in 4 major stages: Data Collection & Secondary Research, Primary Research, Data Analysis and Data Triangulation & Final Review.
- Data Collection and Secondary Research:
As a market research and consulting firm operating from a decade, we have published and advised several client across the globe. First step for any study will start with an assessment of currently available data and insights from existing reports. Further, historical and current market information is collected from Investor Presentations, Annual Reports, SEC Filings, etc., and other information related to company’s performance and market positioning are gathered from Paid Databases (Factiva, Hoovers, and Reuters) and various other publications available in public domain.
Several associations trade associates, technical forums, institutes, societies and organization are accessed to gain technical as well as market related insights through their publications such as research papers, blogs and press releases related to the studies are referred to get cues about the market. Further, white papers, journals, magazines, and other news articles published in last 3 years are scrutinized and analyzed to understand the current market trends.
- Primary Research:
The primarily interview analysis comprise of data obtained from industry participants interview and answers to survey questions gathered by in-house primary team.
For primary research, interviews are conducted with industry experts/CEOs/Marketing Managers/VPs/Subject Matter Experts from both demand and supply side to get a 360-degree view of the market. The primary team conducts several interviews based on the complexity of the markets to understand the various market trends and dynamics which makes research more credible and precise.
A typical research interview fulfils the following functions:
- Provides first-hand information on the market size, market trends, growth trends, competitive landscape, and outlook
- Validates and strengthens in-house secondary research findings
- Develops the analysis team’s expertise and market understanding
Primary research involves email interactions and telephone interviews for each market, category, segment, and sub-segment across geographies. The participants who typically take part in such a process include, but are not limited to:
- Industry participants: VPs, business development managers, market intelligence managers and national sales managers
- Outside experts: Valuation experts, research analysts and key opinion leaders specializing in the electronics and semiconductor industry.
Below is the breakup of our primary respondents by company, designation, and region:

Once we receive the confirmation from primary research sources or primary respondents, we finalize the base year market estimation and forecast the data as per the macroeconomic and microeconomic factors assessed during data collection.
- Data Analysis:
Once data is validated through both secondary as well as primary respondents, we finalize the market estimations by hypothesis formulation and factor analysis at regional and country level.
- Macro-Economic Factor Analysis:
We analyse macroeconomic indicators such the gross domestic product (GDP), increase in the demand for goods and services across industries, technological advancement, regional economic growth, governmental policies, the influence of COVID-19, PEST analysis, and other aspects. This analysis aids in setting benchmarks for various nations/regions and approximating market splits. Additionally, the general trend of the aforementioned components aid in determining the market's development possibilities.
- Country Level Data:
Various factors that are especially aligned to the country are taken into account to determine the market size for a certain area and country, including the presence of vendors, such as headquarters and offices, the country's GDP, demand patterns, and industry growth. To comprehend the market dynamics for the nation, a number of growth variables, inhibitors, application areas, and current market trends are researched. The aforementioned elements aid in determining the country's overall market's growth potential.
- Company Profile:
The “Table of Contents” is formulated by listing and analyzing more than 25 - 30 companies operating in the market ecosystem across geographies. However, we profile only 10 companies as a standard practice in our syndicate reports. These 10 companies comprise leading, emerging, and regional players. Nonetheless, our analysis is not restricted to the 10 listed companies, we also analyze other companies present in the market to develop a holistic view and understand the prevailing trends. The “Company Profiles” section in the report covers key facts, business description, products & services, financial information, SWOT analysis, and key developments. The financial information presented is extracted from the annual reports and official documents of the publicly listed companies. Upon collecting the information for the sections of respective companies, we verify them via various primary sources and then compile the data in respective company profiles. The company level information helps us in deriving the base number as well as in forecasting the market size.
- Developing Base Number:
Aggregation of sales statistics (2020-2022) and macro-economic factor, and other secondary and primary research insights are utilized to arrive at base number and related market shares for 2022. The data gaps are identified in this step and relevant market data is analyzed, collected from paid primary interviews or databases. On finalizing the base year market size, forecasts are developed on the basis of macro-economic, industry and market growth factors and company level analysis.
- Data Triangulation and Final Review:
The market findings and base year market size calculations are validated from supply as well as demand side. Demand side validations are based on macro-economic factor analysis and benchmarks for respective regions and countries. In case of supply side validations, revenues of major companies are estimated (in case not available) based on industry benchmark, approximate number of employees, product portfolio, and primary interviews revenues are gathered. Further revenue from target product/service segment is assessed to avoid overshooting of market statistics. In case of heavy deviations between supply and demand side values, all thes steps are repeated to achieve synchronization.
We follow an iterative model, wherein we share our research findings with Subject Matter Experts (SME’s) and Key Opinion Leaders (KOLs) until consensus view of the market is not formulated – this model negates any drastic deviation in the opinions of experts. Only validated and universally acceptable research findings are quoted in our reports.
We have important check points that we use to validate our research findings – which we call – data triangulation, where we validate the information, we generate from secondary sources with primary interviews and then we re-validate with our internal data bases and Subject matter experts. This comprehensive model enables us to deliver high quality, reliable data in shortest possible time.


 احصل على عينة مجانية لهذا التقرير