نظرة عامة على سوق مراقبة التجربة الرقمية والنمو والاتجاهات والتحليل وتقرير البحث (2021-2028)

  • Report Code : TIPRE00023414
  • Category : Technology, Media and Telecommunications
  • Status : Published
  • No. of Pages : 180
Buy Now


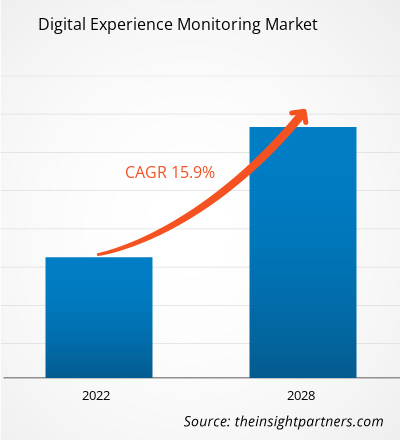
من المتوقع أن ينمو حجم سوق مراقبة التجربة الرقمية من 2,156.71 مليون دولار أمريكي في عام 2021 إلى 5,960.87 مليون دولار أمريكي بحلول عام 2028. ومن المتوقع أن ينمو حجم سوق مراقبة التجربة الرقمية بمعدل نمو سنوي مركب قدره 15.9% من عام 2022 إلى عام 2028.

تعد مراقبة التجربة الرقمية (DEM) تقنية جديدة تنظر إليها المؤسسات كوسيلة لتبسيط مخاوف أداء المستخدم مع اكتساب نظرة ثاقبة لمجموعة من تقنيات الشبكات باستخدام حل واحد. إن تطور مراقبة أداء التطبيقات (APM) ومراقبة تجربة المستخدم النهائي (EUEM) إلى حل شامل يقيم فعالية تطبيقات المؤسسة وخدماتها هو DEM. DEM هو حل مراقبة في الوقت الفعلي يساعد فرق عمليات تكنولوجيا المعلومات في حل مخاوف المستخدمين على الفور مع ضمان عدم إزعاج الشبكة. يمكن استكمال تقنيات مراقبة أداء التطبيقات (APM) الحالية ومراقبة أداء الشبكة وتشخيصها (NPMD) بحلول DEM. عند استخدامها معًا، فإنها توفر رؤية شاملة، مع توفير DEM نظرة ثاقبة لتجربة المستخدم. تلك هي التجارب التي لها التأثير المباشر الأكبر على نتائج الشركة. DEM هي أداة مراقبة في الوقت الفعلي تساعد "الجهاز" الخاص بشركتك على العمل بسلاسة من خلال اكتشاف الثغرات الأمنية التي تسبب توقفًا أو اضطرابات في تجربة المستخدم، مثل أوقات تحميل الصفحات الضعيفة، وتحديد السبب الأساسي للأداء. يقوم برنامج DEM بمراقبة سلوك المستخدم وحركة المرور والعوامل الإضافية لمساعدة الشركات على فهم سهولة استخدام المنتج وأدائه. تدمج منتجات DEM حركة المرور النشطة أو المحاكية ومراقبة المستخدم الحقيقي لتحليل الأداء النظري وتجربة المستخدم الحقيقي. توفر هذه الأدوات أدوات تحليلية لفحص أداء التطبيق والموقع وتحسينه. كما أنها تساعد الشركات على فهم كيفية تنقل الزائرين عبر مواقعهم واكتشاف المشاكل التي تعاني منها تجربة المستخدم النهائي.

يُعرف فحص بيانات الأداء عبر الأجهزة والتطبيقات والبنية التحتية والخدمات لفهم كيفية تأثير تفاعلات المستخدمين النهائيين مع التكنولوجيا على جودة تجربتهم الرقمية باسم DEM. قد يقوم قسم تكنولوجيا المعلومات بتتبع وتقييم المعلمات المختلفة التي تؤثر على المستخدمين، بما في ذلك وحدة المعالجة المركزية والذاكرة واستخدام الأجهزة وزمن الوصول وأداء البرامج والمزيد، وذلك باستخدام مراقبة التجربة الرقمية. قد تساعد هذه القياسات، التي يتم جمعها باستمرار من نقطة النهاية وإقرانها بالتحليل المعرفي والأتمتة، تكنولوجيا المعلومات في تشخيص المشكلات ومعالجتها وحتى التنبؤ بها على الفور دون علم المستخدم. يمكن أن تشير التعليقات والآراء أيضًا إلى العناصر التي لا يمكن لإحصائيات نقطة النهاية التقاطها. تتجاوز حلول مراقبة التجربة الرقمية مراقبة أداء الشبكة والتطبيقات النموذجية للكشف عن مشكلات الشبكة، والتي قد تؤثر على أداء الخدمة المستندة إلى السحابة. يؤثر هذا العامل على التجربة الرقمية التي تراقب نمو السوق .


تخصيص البحث ليناسب متطلباتك

يمكننا تحسين وتخصيص التحليل والنطاق الذي لم يتم تلبيته من خلال عروضنا القياسية. ستساعدك هذه المرونة في الحصول على المعلومات الدقيقة اللازمة لتخطيط أعمالك واتخاذ القرارات.

سوق مراقبة التجربة الرقمية:

سوق مراقبة التجربة الرقمية
  • Digital Experience Monitoring Market
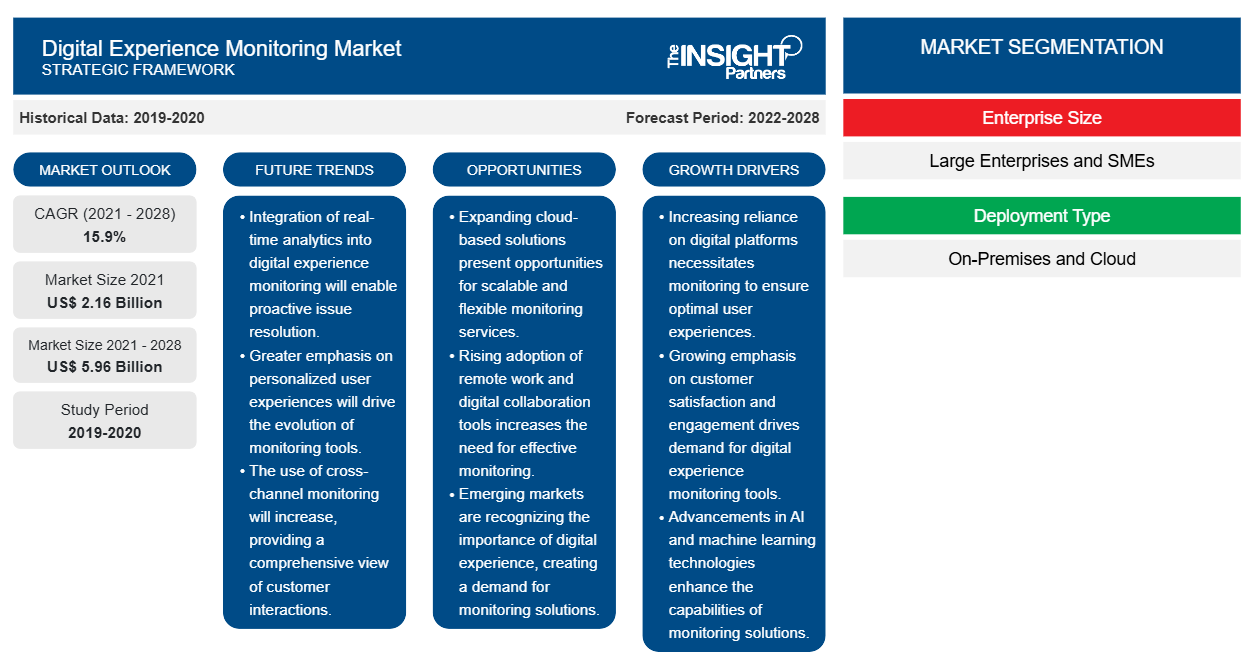
    معدل النمو السنوي المركب (2021 - 2028)
    15.9%
  • حجم السوق 2021
    2.16 مليار دولار أمريكي
  • حجم السوق 2028
    5.96 مليار دولار أمريكي

ديناميات السوق

محركات النمو
  • XXXXXXX
  • XXXXXXX
  • XXXXXXX
الاتجاهات المستقبلية
  • XXXXXXX
  • XXXXXXX
  • XXXXXXX
فرص
  • XXXXXXX
  • XXXXXXX
  • XXXXXXX

اللاعبين الرئيسيين

  •  
  • أب دايناميكس ذ.م.م
  • شركة بي إم سي للبرمجيات
  • شركة برودكوم
  • أنظمة كاتشبوينت، وشركة.
  • ديناتريس ذ.م.م
  • شركة آي بي إم
  • التركيز الجزئي
  • شركة أوراكل
  • شركة ريفربيد للتكنولوجيا

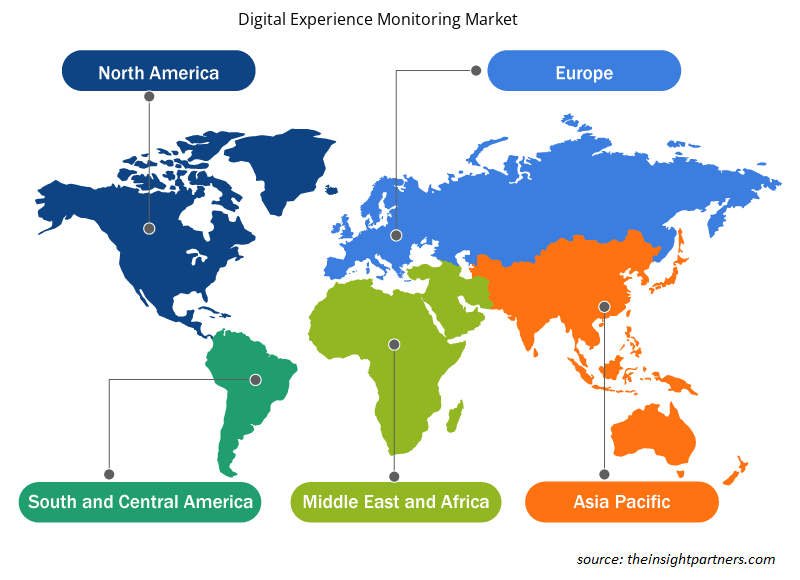
نظرة عامة إقليمية

Digital Experience Monitoring Market
  • أمريكا الشمالية
  • أوروبا
  • آسيا والمحيط الهادئ
  • أمريكا الجنوبية والوسطى
  • الشرق الأوسط وأفريقيا

تجزئة السوق

Digital Experience Monitoring Marketحجم الشركة
  • الشركات الكبيرة والصغيرة والمتوسطة
Digital Experience Monitoring Marketنوع النشر
  • محليًا وسحابيًا
Digital Experience Monitoring Marketالمستخدم النهائي
  • بفسي
  • تكنولوجيا المعلومات والاتصالات
  • التجزئة والسلع الاستهلاكية
  • الرعاية الصحية وعلوم الحياة
  • آحرون
  • يعرض نموذج PDF بنية المحتوى وطبيعة المعلومات من خلال التحليل النوعي والكمي.


تأثير جائحة كوفيد-19 على سوق مراقبة التجربة الرقمية

مع ظهور جائحة كوفيد-19، توقفت صناعة الطيران بأكملها بشكل غير متوقع. أبلغت تركيا وإيران وجنوب أفريقيا والعراق وإسرائيل والمملكة العربية السعودية والإمارات العربية المتحدة عن عدد كبير من حالات الإصابة والوفيات المؤكدة بفيروس كورونا. يضم سوق مراقبة التجربة الرقمية اقتصادات كبرى، مثل الإمارات العربية المتحدة والمملكة العربية السعودية، وهما من المزودين المحتملين في صناعة مراقبة التجربة الرقمية نظرًا للوجود الكبير لقاعدة عملاء متنوعة. قبل الوباء، كانت دول الخليج على وشك اعتماد التقنيات الرقمية التحويلية في مختلف القطاعات لتحسين الظروف الاجتماعية والاقتصادية للبلدان. ومع ذلك، بسبب تفشي فيروس كورونا (COVID-19)، أدى تنفيذ التدابير الصارمة مثل إغلاق المصانع وإغلاق الأعمال وقيود السفر إلى تفاقم المشاكل الاقتصادية في البلدان، مثل منطقة الشرق الأوسط وأفريقيا. ومن ثم، فإن الوضع الاقتصادي لمنطقة الشرق الأوسط وأفريقيا وتأثير جائحة كوفيد-19 على نمو مختلف الصناعات في المنطقة أثر بشكل طفيف على التجربة الرقمية التي تراقب نمو السوق في عام 2020.


رؤى السوق لرصد التجربة الرقمية

تم تعزيز نظام تعليقات العملاء المهم لأي صناعة مراقبة تجربة رقمية وظيفية ومربحة بفضل التحسينات التكنولوجية في سوق مراقبة التجربة الرقمية. على سبيل المثال، تقوم الشركات بتنفيذ نظام ردود الفعل عبر الإنترنت باستخدام نظام إدارة علاقات العملاء (CRM) المتطور . ونتيجة لذلك، تساعد مدخلات العميل بشكل مباشر في إجراء تعديلات في الوقت الفعلي وتحديث برامج الشركة لإجراء تقييم في الوقت الفعلي للجودة وضبطها أو تغييرها حسب الحاجة. يجب على أي شركة تشهد تحولًا رقميًا أن تطبق أنظمة مراقبة الخبرة. إن تبسيط الإجراءات الرقمية المتضمنة في إدارة الشركة يضع أساسًا قويًا لتغييرات النظام المستقبلية أو الابتكار المستمر. وهذا يقود سوق مراقبة التجربة الرقمية.


رؤى السوق القائمة على حجم المؤسسة

تحليل السوق بمراقبة الخبرة الرقمية حسب حجم المؤسسة، وينقسم السوق إلى مؤسسات كبيرة وشركات صغيرة ومتوسطة. في عام 2021، استحوذ قطاع المؤسسات الكبيرة على حصة سوقية أكبر في مراقبة الخبرة الرقمية.


رؤى السوق المستندة إلى نوع النشر

تحليل سوق مراقبة التجربة الرقمية حسب نوع النشر، يتم تقسيم السوق إلى محلي وسحابي. في عام 2021، استحوذ قطاع السحابة على حصة سوقية أكبر في مراقبة التجربة الرقمية.


يتبنى اللاعبون استراتيجيات، مثل عمليات الدمج والاستحواذ ومبادرات السوق، للحفاظ على مراكزهم في السوق. فيما يلي بعض التطورات التي قام بها اللاعبون الرئيسيون في السوق:

  • في عام 2022، أعلنت BMC عن إمكانات وعمليات تكامل جديدة عبر محافظ BMC AMI (ذكاء الحاسوب المركزي الآلي) وحافظات BMC Compuware. تساعد الابتكارات العملاء على تحسين جودة الخدمة وتسريع تسليم البرامج من خلال توفير رؤية أكبر للبيانات ورؤى قائمة على السياق عبر بيئات تكنولوجيا المعلومات الخاصة بهم.
  • في عام 2021، استحوذت شركة Broadcom Inc. على AppNeta لتعزيز مراقبة أداء الشبكة عبر الإنترنت والتطبيقات المستندة إلى السحابة المختلطة. من خلال الجمع بين رؤية AppNeta الشاملة مع البنية التحتية وقدرات AIOps الحائزة على جوائز والمثبتة من Broadcom، ستتمكن الآن أكبر المؤسسات في العالم التي تدير الشبكات الأكثر تعقيدًا من الوصول إلى مصدر واحد للحقيقة لدعم رحلتها السحابية.


نطاق تقرير سوق مراقبة التجربة الرقمية

سمة التقريرتفاصيل
حجم السوق في عام 20212.16 مليار دولار أمريكي
حجم السوق بحلول عام 20285.96 مليار دولار أمريكي
معدل النمو السنوي المركب العالمي (2021 - 2028)15.9%
البيانات التاريخية2019-2020
فترة التنبؤ2022-2028
القطاعات المغطاةحسب حجم المؤسسة
  • الشركات الكبيرة والصغيرة والمتوسطة
حسب نوع النشر
  • محليًا وسحابيًا
بواسطة المستخدم النهائي
  • بفسي
  • تكنولوجيا المعلومات والاتصالات
  • التجزئة والسلع الاستهلاكية
  • الرعاية الصحية وعلوم الحياة
  • آحرون
المناطق والبلدان المشمولةأمريكا الشمالية
  • نحن
  • كندا
  • المكسيك
أوروبا
  • المملكة المتحدة
  • ألمانيا
  • فرنسا
  • روسيا
  • إيطاليا
  • بقية أوروبا
آسيا والمحيط الهادئ
  • الصين
  • الهند
  • اليابان
  • أستراليا
  • بقية منطقة آسيا والمحيط الهادئ
أمريكا الجنوبية والوسطى
  • البرازيل
  • الأرجنتين
  • بقية أمريكا الجنوبية والوسطى
الشرق الأوسط وأفريقيا
  • جنوب أفريقيا
  • المملكة العربية السعودية
  • الإمارات العربية المتحدة
  • بقية دول الشرق الأوسط وأفريقيا
قادة السوق وملفات تعريف الشركة الرئيسية
  •  
  • أب دايناميكس ذ.م.م
  • شركة بي إم سي للبرمجيات
  • شركة برودكوم
  • أنظمة كاتشبوينت، وشركة.
  • ديناتريس ذ.م.م
  • شركة آي بي إم
  • التركيز الجزئي
  • شركة أوراكل
  • شركة ريفربيد للتكنولوجيا
  • يعرض نموذج PDF بنية المحتوى وطبيعة المعلومات من خلال التحليل النوعي والكمي.


ملفات تعريف الشركة في تقرير سوق مراقبة التجربة الرقمية

  • شركة بي إم سي للبرمجيات
  • شركة برودكوم
  • شركة كونترول أب تكنولوجيز المحدودة
  • ليكسايد للبرمجيات، ذ.م.م
  • اتيرنيتي ذ.م.م
  • Nextthink SA
  • أب دايناميكس ذ.م.م
  • أنظمة كاتشبوينت، وشركة.
  • ديناتريس ذ.م.م
  • شركة آي بي إم
  • التركيز الجزئي
  • شركة أوراكل
  • شركة ريفربيد للتكنولوجيا
  • ساب سي
  • Historical Analysis (2 Years), Base Year, Forecast (7 Years) with CAGR
  • PEST and SWOT Analysis
  • Market Size Value / Volume - Global, Regional, Country
  • Industry and Competitive Landscape
  • Excel Dataset
Report Coverage
Report Coverage

Revenue forecast, Company Analysis, Industry landscape, Growth factors, and Trends

Segment Covered
Segment Covered

This text is related
to segments covered.

Regional Scope
Regional Scope

North America, Europe, Asia Pacific, Middle East & Africa, South & Central America

Country Scope
Country Scope

This text is related
to country scope.

Frequently Asked Questions


Which are the major five companies in the digital experience monitoring market?

The major five companies in the digital experience monitoring market include BMC Software, Inc.; Broadcom Inc.; AppDynamics LLC; Dynatrace LLC; and IBM Corporation.

Which end user segment is expected to dominate the market in terms of 2021 market share?

On the basis of end user, the digital experience monitoring market is segmented into BFSI, IT and telecommunications, retail and consumer goods, healthcare and life sciences and life sciences, and others. In 2021, the BFSI segment led the digital experience monitoring market, accounting for the largest share in the market.

Which region has dominated the digital experience monitoring market?

In 2021, North America led the market with a substantial revenue share, followed by Europe and APAC. North America is a prospective market for digital experience monitoring developers.

Which enterprise size segment is expected to dominate the market in terms of 2021 market share?

Based on enterprise size, the digital experience monitoring market is bifurcated into large enterprises and SMEs. In 2021, the large enterprises segment led the digital experience monitoring market, accounting for the largest share in the market. Further, small and medium enterprises (SMEs) are companies with revenues, assets, or personnel that fall below a particular threshold. A small and medium enterprises (SME) is defined differently in each country. Small and medium enterprises (SMEs) play a vital role in the economy, despite their small size. They outnumber major corporations by a substantial margin, employ a huge workforce, and are entrepreneurial in nature, contributing to the shaping of innovation.

What are the reasons behind digital experience monitoring market growth?

Demand for better end-user experience and adoption of cutting-edge technologies are driving the growth of the digital experience monitoring market.

What are market opportunities for digital experience monitoring market?

The market opportunity lies in developing countries. Developing countries have become a hub of opportunity for various markets, including the digital experience monitoring market. Further, adoption of AI & IoT in fintech business is presenting significant potential for the future growth of the digital experience monitoring market players.

Trends and growth analysis reports related to Technology, Media and Telecommunications : READ MORE..   
Your data will never be shared with third parties, however, we may send you information from time to time about our products that may be of interest to you. By submitting your details, you agree to be contacted by us. You may contact us at any time to opt-out.

The List of Companies - Digital Experience Monitoring Market 

  1. AppDynamics LLC
  2. BMC Software, Inc.
  3. Broadcom Inc.
  4. Catchpoint Systems, inc.
  5. Dynatrace LLC
  6. IBM Corporation
  7. Micro Focus
  8. Oracle Corporation
  9. Riverbed Technology, Inc.
  10. SAP SE
  11. ControlUp Technologies LTD
  12. Lakeside Software, LLC
  13. Aternity LLC
  14. Nexthink SA

Buy Now  

The Insight Partners performs research in 4 major stages: Data Collection & Secondary Research, Primary Research, Data Analysis and Data Triangulation & Final Review.

  1. Data Collection and Secondary Research:

As a market research and consulting firm operating from a decade, we have published and advised several client across the globe. First step for any study will start with an assessment of currently available data and insights from existing reports. Further, historical and current market information is collected from Investor Presentations, Annual Reports, SEC Filings, etc., and other information related to company’s performance and market positioning are gathered from Paid Databases (Factiva, Hoovers, and Reuters) and various other publications available in public domain.

Several associations trade associates, technical forums, institutes, societies and organization are accessed to gain technical as well as market related insights through their publications such as research papers, blogs and press releases related to the studies are referred to get cues about the market. Further, white papers, journals, magazines, and other news articles published in last 3 years are scrutinized and analyzed to understand the current market trends.

  1. Primary Research:

The primarily interview analysis comprise of data obtained from industry participants interview and answers to survey questions gathered by in-house primary team.

For primary research, interviews are conducted with industry experts/CEOs/Marketing Managers/VPs/Subject Matter Experts from both demand and supply side to get a 360-degree view of the market. The primary team conducts several interviews based on the complexity of the markets to understand the various market trends and dynamics which makes research more credible and precise.

A typical research interview fulfils the following functions:

  • Provides first-hand information on the market size, market trends, growth trends, competitive landscape, and outlook
  • Validates and strengthens in-house secondary research findings
  • Develops the analysis team’s expertise and market understanding

Primary research involves email interactions and telephone interviews for each market, category, segment, and sub-segment across geographies. The participants who typically take part in such a process include, but are not limited to:

  • Industry participants: VPs, business development managers, market intelligence managers and national sales managers
  • Outside experts: Valuation experts, research analysts and key opinion leaders specializing in the electronics and semiconductor industry.

Below is the breakup of our primary respondents by company, designation, and region:

Research Methodology

Once we receive the confirmation from primary research sources or primary respondents, we finalize the base year market estimation and forecast the data as per the macroeconomic and microeconomic factors assessed during data collection.

  1. Data Analysis:

Once data is validated through both secondary as well as primary respondents, we finalize the market estimations by hypothesis formulation and factor analysis at regional and country level.

  • Macro-Economic Factor Analysis:

We analyse macroeconomic indicators such the gross domestic product (GDP), increase in the demand for goods and services across industries, technological advancement, regional economic growth, governmental policies, the influence of COVID-19, PEST analysis, and other aspects. This analysis aids in setting benchmarks for various nations/regions and approximating market splits. Additionally, the general trend of the aforementioned components aid in determining the market's development possibilities.

  • Country Level Data:

Various factors that are especially aligned to the country are taken into account to determine the market size for a certain area and country, including the presence of vendors, such as headquarters and offices, the country's GDP, demand patterns, and industry growth. To comprehend the market dynamics for the nation, a number of growth variables, inhibitors, application areas, and current market trends are researched. The aforementioned elements aid in determining the country's overall market's growth potential.

  • Company Profile:

The “Table of Contents” is formulated by listing and analyzing more than 25 - 30 companies operating in the market ecosystem across geographies. However, we profile only 10 companies as a standard practice in our syndicate reports. These 10 companies comprise leading, emerging, and regional players. Nonetheless, our analysis is not restricted to the 10 listed companies, we also analyze other companies present in the market to develop a holistic view and understand the prevailing trends. The “Company Profiles” section in the report covers key facts, business description, products & services, financial information, SWOT analysis, and key developments. The financial information presented is extracted from the annual reports and official documents of the publicly listed companies. Upon collecting the information for the sections of respective companies, we verify them via various primary sources and then compile the data in respective company profiles. The company level information helps us in deriving the base number as well as in forecasting the market size.

  • Developing Base Number:

Aggregation of sales statistics (2020-2022) and macro-economic factor, and other secondary and primary research insights are utilized to arrive at base number and related market shares for 2022. The data gaps are identified in this step and relevant market data is analyzed, collected from paid primary interviews or databases. On finalizing the base year market size, forecasts are developed on the basis of macro-economic, industry and market growth factors and company level analysis.

  1. Data Triangulation and Final Review:

The market findings and base year market size calculations are validated from supply as well as demand side. Demand side validations are based on macro-economic factor analysis and benchmarks for respective regions and countries. In case of supply side validations, revenues of major companies are estimated (in case not available) based on industry benchmark, approximate number of employees, product portfolio, and primary interviews revenues are gathered. Further revenue from target product/service segment is assessed to avoid overshooting of market statistics. In case of heavy deviations between supply and demand side values, all thes steps are repeated to achieve synchronization.

We follow an iterative model, wherein we share our research findings with Subject Matter Experts (SME’s) and Key Opinion Leaders (KOLs) until consensus view of the market is not formulated – this model negates any drastic deviation in the opinions of experts. Only validated and universally acceptable research findings are quoted in our reports.

We have important check points that we use to validate our research findings – which we call – data triangulation, where we validate the information, we generate from secondary sources with primary interviews and then we re-validate with our internal data bases and Subject matter experts. This comprehensive model enables us to deliver high quality, reliable data in shortest possible time.