سوق فواتير الناقل المباشر – المحركات والاتجاهات والفرص وإحصاءات النمو | 2031
البيانات التاريخية : 2021-2022 | سنة الأساس : 2023 | فترة التنبؤ : 2024-2031حجم سوق الفوترة المباشرة للناقل وتوقعاته (2021-2031)، والحصة العالمية والإقليمية، والاتجاه، وفرص النمو، وتغطية تقرير تحليل: حسب النوع (DCB محدود، DCB خالص، إعادة توجيه MSISDN، ونافذة PIN أو MO الأساسية)، والمنصة (iOS وAndroid ومنصات أخرى)، والمستخدم النهائي (التطبيقات والألعاب، ووسائل الإعلام عبر الإنترنت، والمستخدمين النهائيين الآخرين)، والجغرافيا
- تاريخ التقرير : Mar 2026
- رمز التقرير : TIPRE00004643
- الفئة : التكنولوجيا والإعلام والاتصالات
- الحالة : البيانات الصادرة
- تنسيقات التقارير المتاحة :


- عدد الصفحات : 150
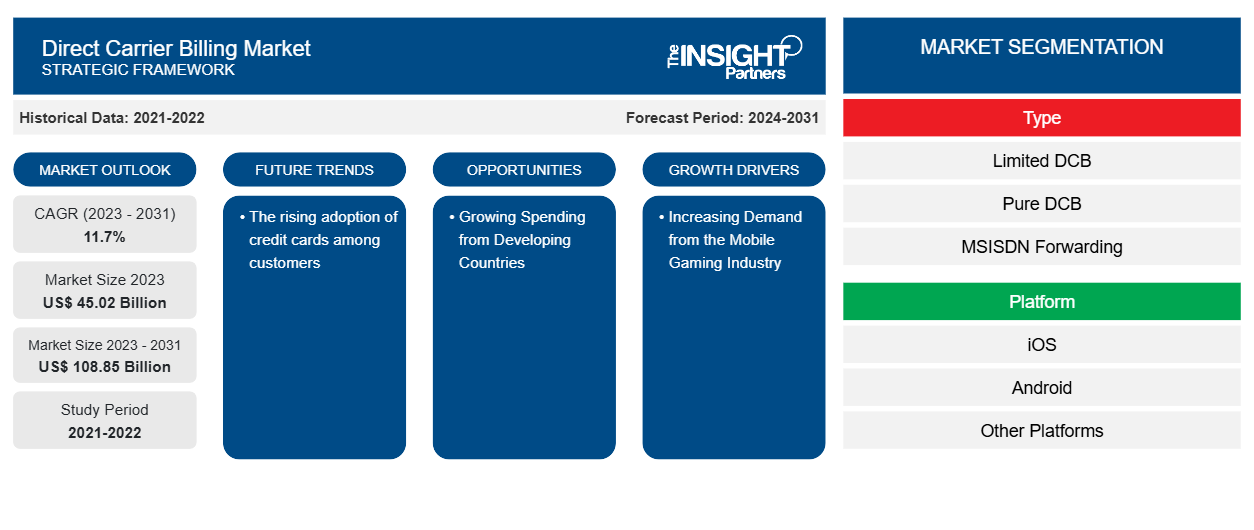
من المتوقع أن يصل حجم سوق الفوترة المباشرة لشركات النقل إلى 108.85 مليار دولار أمريكي بحلول عام 2031 من 45.02 مليار دولار أمريكي في عام 2023. ومن المتوقع أن يسجل السوق معدل نمو سنوي مركب بنسبة 11.7٪ في الفترة 2023-2031. ومن المرجح أن يظل التبني المتزايد لبطاقات الائتمان بين العملاء اتجاهًا رئيسيًا في سوق الفوترة المباشرة لشركات النقل.
تحليل سوق الفواتير المباشرة
يشهد سوق الفوترة المباشرة نموًا سريعًا بسبب الطلب المتزايد من صناعة الألعاب المحمولة والمتطلبات المتزايدة لمنصات المحتوى الرقمي مثل YouTube وNetflix وHotstar وغيرها بين المستهلكين. يتوسع السوق بشكل مطرد، مدفوعًا بتزايد انتشار الهواتف الذكية والقبول الكبير لخدمات OTT. علاوة على ذلك، يوفر الإنفاق المتزايد من البلدان النامية فرصًا مربحة لنمو السوق.
نظرة عامة على سوق الفوترة المباشرة
الفوترة المباشرة من شركة الاتصالات (DCB)، والمعروفة أيضًا باسم الفوترة المباشرة من شركة الاتصالات، هي طريقة دفع عبر الهاتف المحمول تتيح للعملاء دفع ثمن السلع باستخدام هواتفهم الذكية. يقوم العملاء بإجراء عمليات الشراء عن طريق تحصيل المدفوعات من فواتير شركات الاتصالات الخاصة بهم. تتوفر طرق الدفع هذه لجميع الهواتف الذكية والهواتف الذكية. يتعين على المستخدم التحقق من صحة الدفع من هاتف محمول باستخدام بطاقة SIM. تتيح هذه التقنية للعملاء شراء السلع والخدمات من المتاجر عبر الإنترنت التي تقبل طريقة الفوترة المباشرة من شركة الاتصالات. ومع ذلك، فإن توافر مجموعة واسعة من منصات الفوترة المباشرة من شركة الاتصالات يساعد شركات الاتصالات في تحقيق إيرادات كبيرة من خلال توفير محتوى محدث للعملاء، مما يعزز السوق.
قم بتخصيص هذا التقرير ليناسب متطلباتك
ستحصل على تخصيص لأي تقرير - مجانًا - بما في ذلك أجزاء من هذا التقرير، أو تحليل على مستوى الدولة، وحزمة بيانات Excel، بالإضافة إلى الاستفادة من العروض والخصومات الرائعة للشركات الناشئة والجامعات
سوق الفوترة المباشرة لشركات الاتصالات: رؤى استراتيجية
-
احصل على أهم اتجاهات السوق الرئيسية لهذا التقرير.ستتضمن هذه العينة المجانية تحليلاً للبيانات، بدءًا من اتجاهات السوق وحتى التقديرات والتوقعات.
محركات وفرص سوق الفوترة المباشرة
تزايد الطلب من صناعة الألعاب المحمولة
إن الفوترة المباشرة من شركات الاتصالات تعمل على تحويل صناعة الألعاب المحمولة التي تشهد نموًا سريعًا، وخاصة فيما يتعلق بالمبيعات داخل اللعبة. حيث يشتري اللاعبون في جميع أنحاء العالم أشياء الألعاب ويقومون بترقيتها وإيداعها في فواتير هواتفهم بدلاً من استخدام بطاقات الدفع أو حسابات متجر التطبيقات. وتعمل آلية الدفع السلسة هذه على إزالة الحاجة إلى البحث عن معلومات بطاقات الائتمان أو الخصم وإدخالها والتحقق منها، مما يدعم بشكل أكبر منتجي الألعاب لتحسين معدلات التحويل والدخل الذي يقود السوق.
الإنفاق المتزايد من الدول النامية – فرصة في سوق الفوترة المباشرة
تلعب الفواتير المباشرة دورًا حاسمًا في توزيع المحتوى الرقمي مثل الكتب الإلكترونية والموسيقى والأفلام والتطبيقات. إن زيادة استخدام الفواتير المباشرة تدعم الشركات في توفير حل دفع بسيط، وجذب المستخدمين غير الراغبين أو غير القادرين على استخدام طرق الدفع التقليدية. الفواتير المباشرة مهمة للغاية للشركات التي تعمل في بلدان أو مناطق بها عدد كبير من العملاء المحتملين غير المصرفيين. علاوة على ذلك، فإن التبني المتزايد للهواتف الذكية بين المستهلكين في جميع أنحاء العالم يزيد من الطلب على المحتوى الرقمي، مما يخلق فرصًا للفوترة المباشرة لتقديم المحتوى أو الوصول إليه. بالإضافة إلى ذلك، فإن الإنفاق المتزايد من البلدان النامية مثل فرنسا والهند وكوريا الجنوبية والمكسيك والبرازيل وجنوب إفريقيا، من بين دول أخرى، يخلق فرصًا في السوق. على سبيل المثال، وفقًا لبيانات TELECOMING SA المنشورة في يوليو 2022، أنفق جنوب إفريقيا 89 مليون دولار أمريكي على المحتوى والخدمات الرقمية عبر الفواتير المباشرة في عام 2022 ومن المتوقع أن يزيدوا إنفاقهم إلى 159 مليون دولار أمريكي بحلول عام 2026.
تقرير تحليل تجزئة سوق الفوترة المباشرة للناقل
إن القطاعات الرئيسية التي ساهمت في استخلاص تحليل سوق الفوترة المباشرة هي النوع والمنصة والمستخدم النهائي.
- بناءً على النوع، ينقسم السوق إلى DCB محدود، وDCB نقي، وإعادة توجيه MSISDN، ونافذة قاعدة PIN أو MO. احتفظ قطاع DCB النقي بحصة سوقية أكبر في عام 2023.
- من حيث المنصة، ينقسم السوق إلى iOS وAndroid ومنصات أخرى. احتلت شريحة Android حصة سوقية أكبر في عام 2023.
- بناءً على المستخدمين النهائيين، يتم تقسيم السوق إلى تطبيقات وألعاب ووسائط عبر الإنترنت ومستخدمين نهائيين آخرين. احتل قطاع التطبيقات والألعاب الحصة الأكبر من السوق في عام 2023.
تحليل حصة سوق الفوترة المباشرة حسب المنطقة الجغرافية
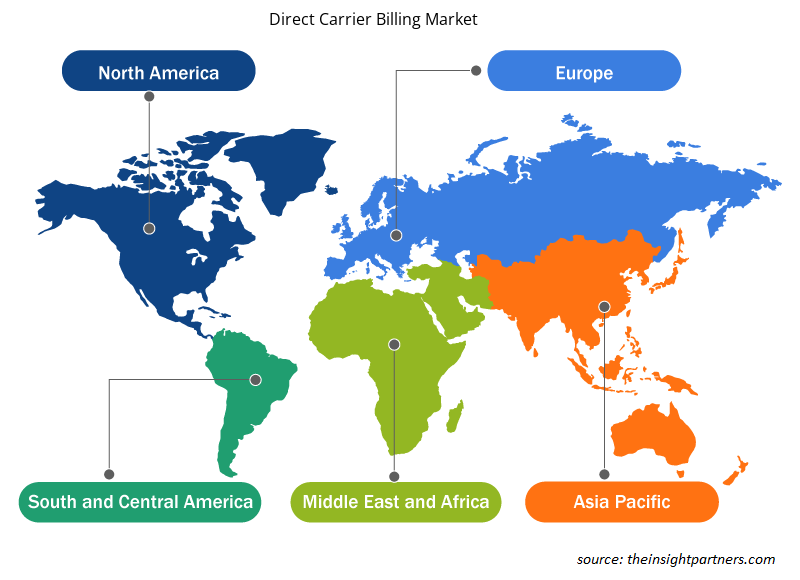
ينقسم النطاق الجغرافي لتقرير سوق الفواتير المباشرة بشكل أساسي إلى خمس مناطق: أمريكا الشمالية، ومنطقة آسيا والمحيط الهادئ، وأوروبا، والشرق الأوسط وأفريقيا، وأمريكا الجنوبية/أمريكا الجنوبية والوسطى.
من حيث الإيرادات، استحوذت أمريكا الشمالية على أكبر حصة في سوق الفوترة المباشرة، وذلك بفضل التقدم التكنولوجي ودمج تقنية blockchain لأغراض أمنية. علاوة على ذلك، فإن تحول حضور المستهلكين نحو تبني منصات المحتوى الرقمي يقود السوق. ومع ذلك، فإن الطلب المتزايد على منصات الوسائط الرقمية مثل YouTube وNetflix وHotstar وغيرها بين المستهلكين يغذي السوق في أمريكا الشمالية.
رؤى إقليمية حول سوق الفوترة المباشرة لشركات الاتصالات
لقد قام المحللون في Insight Partners بشرح الاتجاهات والعوامل الإقليمية المؤثرة على سوق الفوترة المباشرة لشركات الاتصالات طوال فترة التوقعات بشكل شامل. يناقش هذا القسم أيضًا قطاعات سوق الفوترة المباشرة لشركات الاتصالات ومناطقها الجغرافية في أمريكا الشمالية وأوروبا ومنطقة آسيا والمحيط الهادئ والشرق الأوسط وأفريقيا وأمريكا الجنوبية والوسطى.
- احصل على البيانات الإقليمية المحددة لسوق الفوترة المباشرة للناقل
نطاق تقرير سوق الفوترة المباشرة للناقل
| سمة التقرير | تفاصيل |
|---|---|
| حجم السوق في عام 2023 | 45.02 مليار دولار أمريكي |
| حجم السوق بحلول عام 2031 | 108.85 مليار دولار أمريكي |
| معدل النمو السنوي المركب العالمي (2023 - 2031) | 11.7% |
| البيانات التاريخية | 2021-2022 |
| فترة التنبؤ | 2024-2031 |
| القطاعات المغطاة |
حسب النوع
|
| المناطق والدول المغطاة |
أمريكا الشمالية
|
| قادة السوق وملفات تعريف الشركات الرئيسية |
|
كثافة اللاعبين في سوق الفوترة المباشرة: فهم تأثيرها على ديناميكيات الأعمال
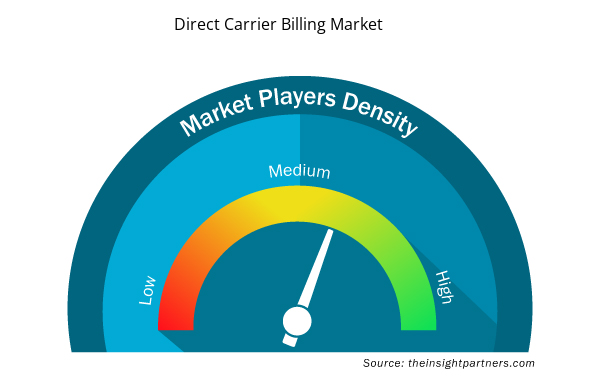
يشهد سوق الفوترة المباشرة لشركات الاتصالات نموًا سريعًا، مدفوعًا بالطلب المتزايد من المستخدم النهائي بسبب عوامل مثل تفضيلات المستهلكين المتطورة والتقدم التكنولوجي والوعي المتزايد بفوائد المنتج. ومع ارتفاع الطلب، تعمل الشركات على توسيع عروضها والابتكار لتلبية احتياجات المستهلكين والاستفادة من الاتجاهات الناشئة، مما يؤدي إلى زيادة نمو السوق.
تشير كثافة اللاعبين في السوق إلى توزيع الشركات أو المؤسسات العاملة في سوق أو صناعة معينة. وهي تشير إلى عدد المنافسين (اللاعبين في السوق) الموجودين في مساحة سوق معينة نسبة إلى حجمها أو قيمتها السوقية الإجمالية.
الشركات الرئيسية العاملة في سوق الفواتير المباشرة هي:
- بانجو PLC
- بوكو
- شركة.
- سنتلي
- شركة كومفيفا للتكنولوجيا المحدودة
- ديموكو
إخلاء المسؤولية : الشركات المذكورة أعلاه ليست مرتبة بأي ترتيب معين.
- احصل على نظرة عامة على أهم اللاعبين الرئيسيين في سوق الفوترة المباشرة لشركات النقل
أخبار سوق الفوترة المباشرة والتطورات الأخيرة
يتم تقييم سوق الفوترة المباشرة لشركات النقل من خلال جمع البيانات النوعية والكمية بعد البحث الأولي والثانوي، والتي تتضمن منشورات الشركات المهمة وبيانات الجمعيات وقواعد البيانات. فيما يلي قائمة بالتطورات في سوق الفوترة المباشرة لشركات النقل والاستراتيجيات:
- في سبتمبر 2023، نظمت Informa Tech قمة Global Carrier Billing and Mobile Payments 2023 التي أقيمت يومي 19 و20 سبتمبر في فندق Novotel Amsterdam City، الواقع في عاصمة هولندا. وقد جمع المعرض شركات الاتصالات والتجار وغيرهم من اللاعبين الرئيسيين في صناعة الفوترة والمدفوعات تحت سقف واحد لمعالجة الحالة الحالية للسوق والخطوات المستقبلية للنظام البيئي المتنامي باستمرار. كما تتناول القمة طرق الدفع البديلة والتقدم التكنولوجي لتطوير الشراكات وزيادة الوعي بالفرص التي تقدمها الفوترة والمدفوعات عبر الهاتف المحمول. (المصدر: Informa Tech، بيان صحفي، 2023)
تقرير سوق الفوترة المباشرة للناقلين - التغطية والنتائج المتوقعة
يوفر تقرير "حجم سوق الفوترة المباشرة للناقل والتوقعات (2021-2031)" تحليلاً مفصلاً للسوق يغطي المجالات التالية:
- حجم السوق والتوقعات على المستويات العالمية والإقليمية والوطنية لجميع قطاعات السوق الرئيسية التي يغطيها النطاق
- ديناميكيات السوق مثل المحركات والقيود والفرص الرئيسية
- الاتجاهات المستقبلية الرئيسية
- تحليل مفصل لقوى PEST/Porter الخمس وSWOT
- تحليل السوق العالمي والإقليمي الذي يغطي اتجاهات السوق الرئيسية واللاعبين الرئيسيين واللوائح والتطورات الأخيرة في السوق
- تحليل المشهد الصناعي والمنافسة الذي يغطي تركيز السوق، وتحليل خريطة الحرارة، واللاعبين البارزين، والتطورات الأخيرة
- ملفات تعريف الشركة التفصيلية

أنكيتا خبيرة ديناميكية في أبحاث السوق والاستشارات، تتمتع بخبرة تزيد عن 8 سنوات في قطاعات التكنولوجيا والإعلام وتكنولوجيا المعلومات والاتصالات والإلكترونيات وأشباه الموصلات. وقد قادت ونفذت بنجاح أكثر من 100 مهمة استشارية وبحثية لعملاء عالميين مثل مايكروسوفت وأوراكل وشركة NEC وSAP وKPMG وExpeditors International. تشمل كفاءاتها الأساسية تقييم السوق، وتحليل البيانات، والتنبؤ، وصياغة الاستراتيجيات، والاستخبارات التنافسية، وكتابة التقارير.
أنكيتا بارعة في إدارة دورات المشاريع الكاملة، بدءًا من تصميم عروض ما قبل البيع ومناقشات العملاء، وصولًا إلى تقديم رؤى عملية بعد البيع. كما أنها ماهرة في إدارة فرق متعددة الوظائف، وهيكلة وحدات بحثية معقدة، ومواءمة الحلول مع أهداف العمل الخاصة بالعملاء. وقد مكنتها مهاراتها الممتازة في التواصل والقيادة والعرض التقديمي من تحقيق نتائج قيّمة باستمرار في بيئات سوقية سريعة التطور.
- التحليل التاريخي (سنتان)، سنة الأساس، التوقعات (7 سنوات) مع معدل النمو السنوي المركب
- تحليل PEST و SWOT
- حجم السوق والقيمة / الحجم - عالمي، إقليمي، بلد
- الصناعة والمنافسة
- مجموعة بيانات إكسل
التقارير الحديثة
شهادات العملاء
تقرير سوق أنظمة SCADA من Insight Partners شامل، ويقدم رؤى قيّمة حول الاتجاهات الحالية والتوقعات المستقبلية. تميّز الفريق باحترافية عالية وسرعة في الاستجابة ودعم مستمر طوال الوقت. نحن راضون جدًا ونوصي بشدة بخدماتهم.
ران كيديم شريك, شركة ريالي تكنولوجيز المحدودةطلبتُ تقريرًا عن سوق برمجيات محدد، وأعدّه الفريق في غضون أيام قليلة. كانت المعلومات ذات صلة وثيقة وعرضها جيد. ثم طلبتُ بعض التعديلات والإضافات على التقرير. وكان الفريق متجاوبًا للغاية، وحصلتُ على التقرير النهائي في أقل من أسبوع.
جان هيرفيه جين رئيس مجلس الإدارة, فيوتشر أناليتيكاعملنا مع شركة "إنسايت بارتنرز" لإجراء دراسة سوقية وتوقعات مهمة. زودونا برؤى واضحة حول الفرص والمخاطر، مما ساعدنا في صياغة خططنا. كانت أبحاثهم سهلة الاستخدام ومبنية على بيانات دقيقة، مما ساعدنا على اتخاذ قرارات ذكية وواثقة. نوصي بهم بشدة.
بيوش ناجبال نائب الرئيس الأول, شعاع عالي عالميقدّمت شركة Insight Partners أبحاثًا سوقية ثاقبة ومنظمة جيدًا بخبرة واسعة في هذا المجال. تميّز فريقهم بالاحترافية وسرعة الاستجابة طوال الوقت. وسهّل موقعهم الإلكتروني سهل الاستخدام الوصول إلى تقارير القطاع. نوصي بهم بشدة لخدمات بحثية موثوقة وعالية الجودة.
يوكيهيكو أداتشي المدير التنفيذي, ديب بلو، ذ.م.م.هذه أول مرة أشتري فيها تقرير سوق من The Insight Partners. رغم أنني كنت مترددًا في البداية، إلا أنني زرت موقعهم الإلكتروني وشعرت براحة أكبر للمخاطرة وشراء تقرير السوق. أنا راضٍ تمامًا عن جودة التقرير وخدمة العملاء. كانت لديّ عدة أسئلة وتعليقات حول التقرير الأولي، ولكن بعد بضع محادثات عبر البريد الإلكتروني مع محللهم، أعتقد أن لديّ تقريرًا يمكنني استخدامه كمدخل لعملية التخطيط الاستراتيجي لدينا. شكرًا جزيلاً لكم على تخصيص وقتكم الإضافي وجعل هذه التجربة إيجابية. سأوصي بخدماتكم للآخرين بالتأكيد، وستكونون أول من ألجأ إليه عندما نحتاج إلى المزيد من بيانات السوق.
جون سوزوكي الرئيس والرئيس التنفيذي وعضو مجلس الإدارة, بي كيه تكنولوجيزأود أن أقدّر دعمكم واحترافيتكم في الاستجابة لطلبي للحصول على معلومات بشأن سوق التشخيص المخبري للأمراض المعدية في نيجيريا. كما أُقدّر صبركم وتوجيهكم، واستعدادكم لتقديم خصم، مما مكّننا في النهاية من إتمام الصفقة. أتطلع إلى التعامل مع "ذا إنسايت بارتنرز" مستقبلًا، كل ذلك بفضل الانطباع الذي تركتموه لديّ نتيجةً لهذا اللقاء الأول.
الدكتور تشيجيوك أونيا المدير الإداري, شركة باينكريست للرعاية الصحية المحدودةسبب الشراء
- اتخاذ قرارات مدروسة
- فهم ديناميكيات السوق
- تحليل المنافسة
- رؤى العملاء
- توقعات السوق
- تخفيف المخاطر
- التخطيط الاستراتيجي
- مبررات الاستثمار
- تحديد الأسواق الناشئة
- تحسين استراتيجيات التسويق
- تعزيز الكفاءة التشغيلية
- مواكبة التوجهات التنظيمية


 احصل على عينة مجانية ل - سوق الفواتير المباشرة لشركات الاتصالات