نمو سوق الثلج الجاف وحجمه ومشاركته واتجاهاته وتحليل اللاعبين الرئيسيين والتوقعات حتى عام 2030

  • Report Code : TIPRE00019661
  • Category : Chemicals and Materials
  • Status : Published
  • No. of Pages : 177
Buy Now


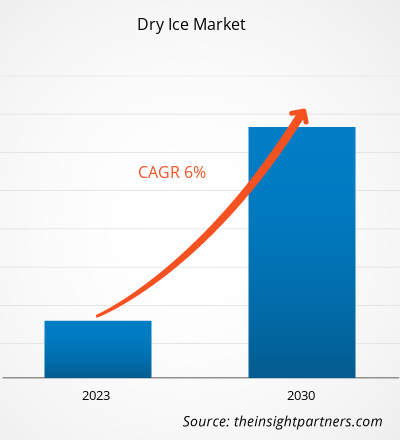
[تقرير بحثي] قدرت قيمة سوق الثلج الجاف بـ 587.68 مليون دولار أمريكي في عام 2022 ومن المتوقع أن تصل إلى 936.90 مليون دولار أمريكي بحلول عام 2030؛ ومن المتوقع أن يسجل معدل نمو سنوي مركب قدره 6.0٪ من عام 2022 إلى عام 2030.CAGR of 6.0% from 2022 to 2030.


تحليل السوق

في السنوات الأخيرة، أصبح المستهلكون يفضلون بشكل متزايد الثلج الجاف على الثلج المائي. أدت الفوائد التي يوفرها الثلج الجاف في الصناعات الدوائية، وتنظيف الماكينات، وحفظ الأغذية، والصناعات الترفيهية إلى زيادة الطلب على الثلج الجاف بدلاً من الثلج المائي الذي يدفع نمو سوق الثلج الجاف .

يتمتع الثلج الجاف بدرجات حرارة أقل من الثلج المائي، مما أدى إلى زيادة الطلب على الثلج الجاف لتطبيقات التخزين والنقل. أدنى درجة حرارة يقدمها الثلج الجاف هي -78 درجة مئوية، في حين أن أدنى درجة حرارة يقدمها الجليد المائي العادي هي -18 درجة مئوية. يستمر الثلج الجاف لفترة أطول من الثلج المائي، في حين يذوب الثلج المائي بشكل أسرع بكثير ويجب استبداله للحفاظ على برودة العناصر بشكل متكرر. يعتبر الثلج الجاف على نحو متزايد خيارًا أفضل بكثير من الثلج المائي. عند تسخينه، لا يترك الثلج الجاف أي بقايا ويستخدم أيضًا في إنتاج الصودا والمشروبات. علاوة على ذلك، يتم استخدام الثلج الجاف بشكل متزايد في وسائل النقل في الصناعة الطبية، بما في ذلك نقل أجزاء الجسم والأعضاء والدم. وبالتالي، فإن التفضيل المتزايد للثلج الجاف على الجليد المائي يدفع نمو سوق الثلج الجاف.

الثلج الجاف لديه درجة حرارة أقل من الجليد المائي. على عكس الجليد المائي التقليدي، الذي يذوب ويحدث فوضى أثناء تحوله إلى الشكل السائل، يخضع الثلج الجاف للتسامي - ويتحول مباشرة من الحالة الصلبة إلى الغاز. تلغي هذه الخاصية الحاجة إلى الصرف وتقلل بشكل كبير من خطر تلف المنتج أو التلوث أثناء النقل والتخزين، مما يجعل الثلج الجاف خيارًا مفضلاً لمختلف الصناعات. في صناعات مثل الرعاية الصحية والأدوية، حيث يعد التحكم الدقيق في درجة الحرارة أمرًا بالغ الأهمية، تعد قدرة الثلج الجاف على الحفاظ على درجات حرارة شديدة البرودة عاملاً رئيسيًا في زيادة الطلب. يعتمد التوزيع العالمي للقاحات والأدوية والعينات البيولوجية بشكل كبير على الثلج الجاف لقدرته على توفير بيئة ثابتة وباردة للغاية، مما يضمن الحفاظ على المواد الحساسة أثناء النقل. بالإضافة إلى ذلك، من المرجح أن يرتفع حجم سوق الثلج الجاف بحلول عام 2030 بسبب الطلب المتزايد بسرعة على الأطعمة المجمدة


محركات النمو والتحديات

يرجع نمو سوق الثلج الجاف إلى ارتفاع الطلب على الثلج الجاف في التخزين والنقل والتفضيل المتزايد للثلج الجاف على الجليد المائي. وفقًا لمنظمة الأغذية والزراعة (الفاو)، يتسبب فقد الأغذية وهدرها في خسائر اقتصادية تصل إلى 940 مليار دولار أمريكي سنويًا. في حين يتم هدر 17% من الغذاء في العالم في مرحلة الاستهلاك، يتم فقدان 14% أثناء مراحل التوزيع والتداول والتخزين. وتشير تقديرات منظمة الأغذية والزراعة إلى أن ما قيمته 400 مليار دولار أمريكي من الأغذية القابلة للتلف يتم إهدارها سنويًا، نصفها يُفقد بسبب التغيرات في درجات الحرارة. يُستخدم الثلج الجاف، وهو ثاني أكسيد الكربون الصلب (CO2) في درجات حرارة منخفضة للغاية، على نطاق واسع كمبرد وعامل تبريد في قطاع التخزين والنقل. خصائصه الفريدة تجعله أداة لا غنى عنها للحفاظ على جودة وسلامة العناصر القابلة للتلف أثناء التخزين والنقل. يستخدم الثلج الجاف في قطاع التخزين والنقل في حفظ المنتجات المجمدة والمبردة.FAO), food loss and waste cause ~US$ 940 billion per year in economic losses. While 17% of the world's food is wasted at the consumption stage, 14% is lost during the distribution, handling, and storage stages. The FAO estimates that US$ 400 billion of perishable food is wasted annually, of which half is lost due to temperature changes. Dry ice, solid

علاوة على ذلك، فإن درجة حرارة الثلج الجاف أقل من درجة حرارة الثلج المائي. على عكس الجليد المائي التقليدي، الذي يذوب ويحدث فوضى أثناء تحوله إلى الشكل السائل، يخضع الثلج الجاف للتسامي - ويتحول مباشرة من الحالة الصلبة إلى الغاز. تلغي هذه الخاصية الحاجة إلى الصرف وتقلل بشكل كبير من خطر تلف المنتج أو التلوث أثناء النقل والتخزين، مما يجعل الثلج الجاف خيارًا مفضلاً لمختلف الصناعات. في صناعات مثل الرعاية الصحية والأدوية ، حيث يعد التحكم الدقيق في درجة الحرارة أمرًا بالغ الأهمية، تعد قدرة الثلج الجاف على الحفاظ على درجات حرارة شديدة البرودة عاملاً رئيسيًا في زيادة الطلب. ومع ذلك، فإن الثلج الجاف هو ثاني أكسيد الكربون المتجمد (CO2). في عملية تصنيع الثلج الجاف، يتم أولاً ضغط غاز ثاني أكسيد الكربون النقي وتبريده لتحويله إلى سائل. يتم بعد ذلك تغذية ثاني أكسيد الكربون المسال إلى آلة إنتاج الثلج الجاف، حيث يتم تحرير الضغط، وهي عملية تنتج ثلج ثاني أكسيد الكربون الذي يتم بعد ذلك ضغطه إلى كريات أو كتل من الثلج الجاف. درجة حرارة سطح الجليد الجاف هي -109.3 درجة فهرنهايت (-57 درجة مئوية). وفوق درجة الحرارة هذه، يتسامى الثلج الجاف، أي أنه يتحول مباشرة إلى غاز دون أن يصبح سائلاً في البداية. لا يمكن تخزين الثلج الجاف لفترة طويلة لأنه يتبخر خلال 18 إلى 24 ساعة.


تخصيص البحث ليناسب متطلباتك

يمكننا تحسين وتخصيص التحليل والنطاق الذي لم يتم تلبيته من خلال عروضنا القياسية. ستساعدك هذه المرونة في الحصول على المعلومات الدقيقة اللازمة لتخطيط أعمالك واتخاذ القرارات.

سوق الثلج الجاف:

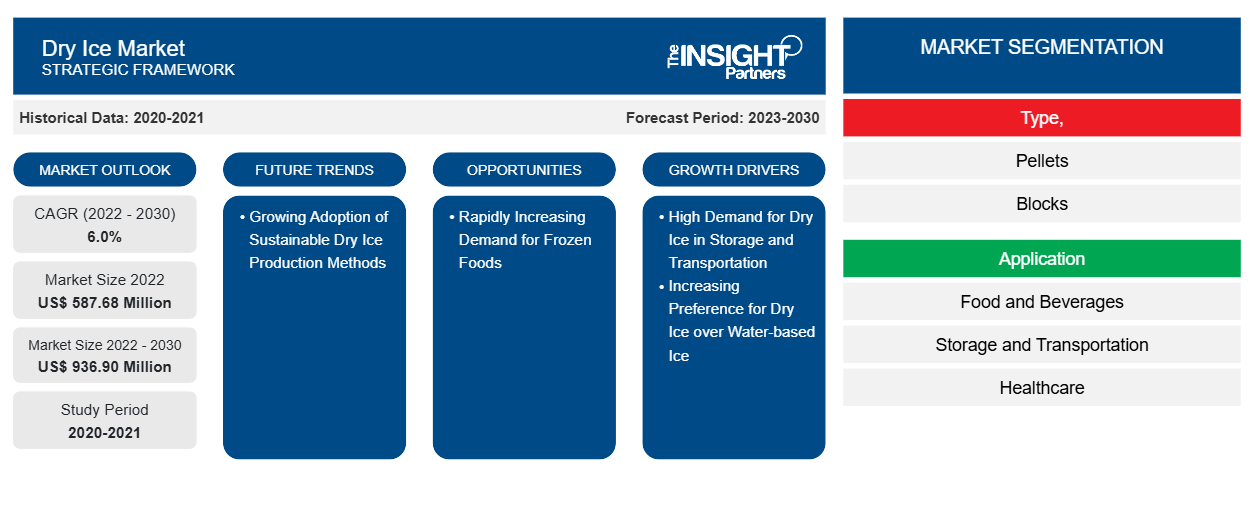
سوق الثلج الجاف
  • Dry Ice Market
    معدل النمو السنوي المركب (2022 - 2030)
    6.0%
  • حجم السوق 2022
    587.68 مليون دولار أمريكي
  • حجم السوق 2030
    936.90 مليون دولار أمريكي

ديناميات السوق

محركات النمو
  • ارتفاع الطلب على الثلج الجاف في التخزين والنقل
  • زيادة تفضيل الثلج الجاف على الثلج المائي
الاتجاهات المستقبلية
  • تزايد اعتماد أساليب إنتاج الثلج الجاف المستدامة
فرص
  • الطلب المتزايد بسرعة على الأطعمة المجمدة

اللاعبين الرئيسيين

  •  
  • الجليد القطبي
  • شركة كونتيننتال للمنتجات الكربونية
  • سيكجيل الهند المحدودة
  • ليند بي إل سي
  • الثلج الجاف في المملكة المتحدة المحدودة.
  • شركة الثلج الجاف
  • يعتمد على الثلج الجاف
  • كريوكاب
  • شركة براكساير تكنولوجي

نظرة عامة إقليمية

Dry Ice Market
  • أمريكا الشمالية
  • أوروبا
  • آسيا والمحيط الهادئ
  • أمريكا الجنوبية والوسطى
  • الشرق الأوسط وأفريقيا

تجزئة السوق

Dry Ice Marketيكتب،
  • الكريات
  • كتل
  • آحرون
Dry Ice Marketطلب
  • طعام و مشروبات
  • التخزين والنقل
  • الرعاىة الصحية
  • تطبيقات صناعية
  • آحرون
  • يعرض نموذج PDF بنية المحتوى وطبيعة المعلومات من خلال التحليل النوعي والكمي.


تقسيم التقرير ونطاقه

يعد "تحليل وتوقعات سوق الثلج الجاف العالمي حتى عام 2030" دراسة متخصصة ومتعمقة تركز بشكل كبير على اتجاهات السوق العالمية وفرص النمو. ويهدف التقرير إلى تقديم لمحة عامة عن السوق العالمية مع تجزئة السوق التفصيلية بناءً على النوع والتطبيق والجغرافيا. ويقدم التقرير إحصائيات أساسية حول استخدام الثلج الجاف في جميع أنحاء العالم، إلى جانب الطلب عليه في المناطق والبلدان الرئيسية. بالإضافة إلى ذلك، يقدم التقرير تقييمًا نوعيًا للعوامل المختلفة التي تؤثر على أداء سوق الثلج الجاف في المناطق والبلدان الرئيسية. كما يتضمن تحليلاً شاملاً للاعبين الرائدين في سوق الثلج الجاف وتطوراتهم الاستراتيجية الرئيسية. يتم أيضًا تضمين تحليل ديناميكيات السوق للمساعدة في تحديد العوامل الدافعة الرئيسية، واتجاهات سوق الثلج الجاف، والفرص المربحة التي من شأنها أن تساعد بدورها في تحديد جيوب الإيرادات الرئيسية.

يوفر تحليل النظام البيئي وتحليل القوى الخمس لبورتر رؤية 360 درجة لسوق الثلج الجاف العالمي، مما يساعد على فهم سلسلة التوريد بأكملها والعوامل المختلفة التي تؤثر على نمو السوق.  


التحليل القطاعي

يتم تقسيم سوق الثلج الجاف العالمي على أساس النوع والتطبيق. بناءً على النوع، يتم تقسيم سوق الثلج الجاف إلى كريات وكتل وغيرها. في عام 2022، استحوذ قطاع الكتل على أكبر حصة سوقية للثلج الجاف. تُستخدم الكتل الصلبة من الثلج الجاف بشكل شائع للتبريد المؤقت حيث لا يكون لثاني أكسيد الكربون حالة سائلة عند الضغط الجوي العادي ويتصاعد مباشرة من الحالة الصلبة إلى الحالة الغازية. يتم إنتاج كتل الثلج الجاف في مكبس الكتل. تستخدم كتل الثلج الجاف في تنظيف المعدات الصناعية. يساعد في التعامل مع المواد مثل الغراء والحبر والمطاط والطلاء والزيت وما إلى ذلك. القياس القياسي للكتل هو 10 × 10 × 12 بوصة ويزن حوالي 60 رطلاً. بالمقارنة مع الكريات والشرائح التي لها نفس الوزن، فإن كتلة الثلج الجاف لها مساحة سطح أقل، وتستغرق وقتًا أطول للتسامي وتستمر لفترة أطول من الأشكال الأخرى التي لها نفس الوزن.

بناءً على التطبيق، يتم تقسيم سوق الثلج الجاف إلى الأطعمة والمشروبات والتخزين والنقل والرعاية الصحية والتطبيقات الصناعية وغيرها. في عام 2022، استحوذ قطاع التخزين والنقل على أكبر حصة سوقية للثلج الجاف. يستخدم الثلج الجاف على نطاق واسع لشحن البضائع. وقد عززت التجارة الدولية مما سمح للبلدان بتصدير واستيراد المواد القابلة للتلف. تشمل المنتجات التي تعتمد على الثلج الجاف الأسماك والزهور والأعشاب وما إلى ذلك. ويعتمد تخزين الأطعمة القابلة للتلف مثل اللحوم والأسماك على التخزين البارد للحفاظ على حفظها الجيد مع مرور الوقت. التخزين البارد الأكثر كفاءة هو الحفاظ على لون ونكهة وملمس ورائحة المنتجات الغذائية. يُستخدم الثلج الجاف أيضًا في التخزين الجاف للحبوب والأرز والفواكه والخضروات والدقيق التي لا تتطلب نظامًا للتحكم في درجة الحرارة. غالبًا ما يستخدم الثلج الجاف كمبرد أثناء نقل المنتجات الحساسة لدرجة الحرارة نظرًا لأنه أكثر برودة من الجليد المائي ولا يحتوي على مرحلة سائلة في الظروف الجوية القياسية. يمكن للثلج الجاف مواكبة "السلسلة الباردة" طوال سلسلة التشتيت بأكملها، بدءًا من الإنشاء وحتى المستخدم النهائي.


التحليل الإقليمي

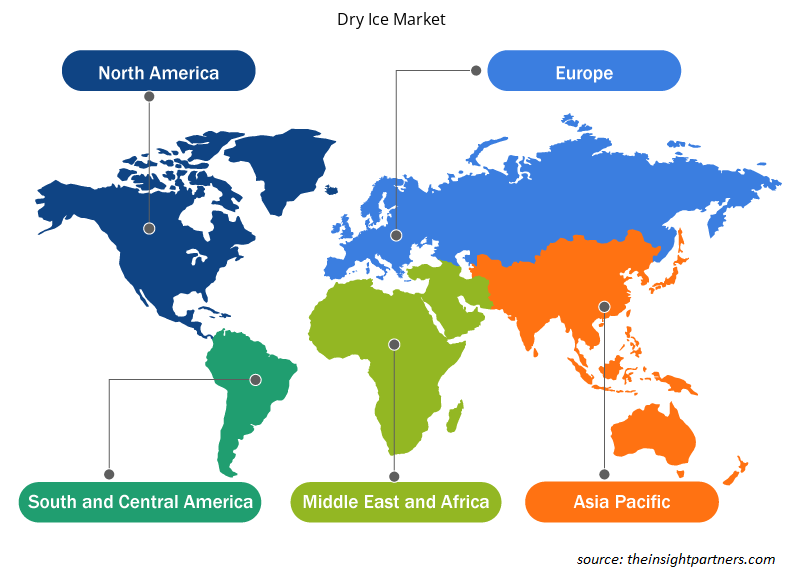
يقدم التقرير نظرة عامة مفصلة عن سوق الثلج الجاف العالمي فيما يتعلق بخمس مناطق رئيسية - أمريكا الشمالية وأوروبا وآسيا والمحيط الهادئ (APAC) والشرق الأوسط وأفريقيا (MEA) وأمريكا الجنوبية والوسطى. استحوذت أمريكا الشمالية على الحصة الأكبر من سوق الثلج الجاف العالمي وقدرت قيمتها بأكثر من 150 مليون دولار أمريكي في عام 2022. وتعد أمريكا الشمالية مركزًا للشركات متوسطة الحجم العاملة في المنطقة. من المتوقع أن يصل السوق في أوروبا إلى أكثر من 200 مليون دولار أمريكي بحلول عام 2030. ومن المتوقع أن يسجل السوق في أمريكا الشمالية معدل نمو سنوي مركب يصل إلى 7٪ تقريبًا من عام 2022 إلى عام 2030. وكانت الصناعات المتنامية مثل الأغذية والمشروبات والرعاية الصحية والنقل قيادة سوق الثلج الجاف في جميع أنحاء المنطقة. وفقًا لأكسفورد إيكونوميكس، في عام 2020، استحوذت منطقة آسيا والمحيط الهادئ على الحصة الأكبر من الإنفاق الاستهلاكي على تناول الطعام بالخارج.


نطاق تقرير سوق الثلج الجاف

سمة التقريرتفاصيل
حجم السوق في عام 2022587.68 مليون دولار أمريكي
حجم السوق بحلول عام 2030936.90 مليون دولار أمريكي
معدل النمو السنوي المركب العالمي (2022 - 2030)6.0%
البيانات التاريخية2020-2021
فترة التنبؤ2023-2030
القطاعات المغطاةحسب النوع،
  • الكريات
  • كتل
  • آحرون
عن طريق التطبيق
  • طعام و مشروبات
  • التخزين والنقل
  • الرعاىة الصحية
  • تطبيقات صناعية
  • آحرون
المناطق والبلدان المشمولةأمريكا الشمالية
  • نحن
  • كندا
  • المكسيك
أوروبا
  • المملكة المتحدة
  • ألمانيا
  • فرنسا
  • روسيا
  • إيطاليا
  • بقية أوروبا
آسيا والمحيط الهادئ
  • الصين
  • الهند
  • اليابان
  • أستراليا
  • بقية منطقة آسيا والمحيط الهادئ
أمريكا الجنوبية والوسطى
  • البرازيل
  • الأرجنتين
  • بقية أمريكا الجنوبية والوسطى
الشرق الأوسط وأفريقيا
  • جنوب أفريقيا
  • المملكة العربية السعودية
  • الإمارات العربية المتحدة
  • بقية دول الشرق الأوسط وأفريقيا
قادة السوق وملفات تعريف الشركة الرئيسية
  •  
  • الجليد القطبي
  • شركة كونتيننتال للمنتجات الكربونية
  • سيكجيل الهند المحدودة
  • ليند بي إل سي
  • الثلج الجاف في المملكة المتحدة المحدودة.
  • شركة الثلج الجاف
  • يعتمد على الثلج الجاف
  • كريوكاب
  • شركة براكساير تكنولوجي
  • يعرض نموذج PDF بنية المحتوى وطبيعة المعلومات من خلال التحليل النوعي والكمي.


المشهد التنافسي والشركات الرئيسية

الجليد القطبي؛ شركة كونتيننتال للمنتجات الكربونية؛ سيكجيل الهند المحدودة. ليندي بي إل سي؛ شركة الثلج الجاف في المملكة المتحدة المحدودة؛ شركة الثلج الجاف؛ ريلينت للثلج الجاف؛ كريوكاب؛ شركة "براكساير تكنولوجي"؛ و ACP من بين اللاعبين البارزين الذين تم ذكرهم في تقرير سوق الثلج الجاف. بالإضافة إلى ذلك، تمت دراسة وتحليل العديد من اللاعبين الآخرين أثناء الدراسة للحصول على نظرة شاملة للسوق ونظامه البيئي. يتكون تقرير سوق الثلج الجاف أيضًا من تحديد موقع الشركة وتركيزها لتقييم أداء المنافسين/اللاعبين في السوق.


تطورات الصناعة والفرص المستقبلية

فيما يلي بعض المبادرات التي اتخذها اللاعبون الرئيسيون العاملون في سوق الثلج الجاف:

  • في مايو 2021، افتتحت شركة Continental Carbonic Products, Inc. (CCPI) منشأة لتصنيع ثاني أكسيد الكربون السائل (CO2) والثلج الجاف في إلدورادو، أركنساس، الولايات المتحدة.
  • في أغسطس 2021، حصلت شركة Portarlington الحائزة على جوائز على الضوء الأخضر للتوسع.
  • Historical Analysis (2 Years), Base Year, Forecast (7 Years) with CAGR
  • PEST and SWOT Analysis
  • Market Size Value / Volume - Global, Regional, Country
  • Industry and Competitive Landscape
  • Excel Dataset
Report Coverage
Report Coverage

Revenue forecast, Company Analysis, Industry landscape, Growth factors, and Trends

Segment Covered
Segment Covered

This text is related
to segments covered.

Regional Scope
Regional Scope

North America, Europe, Asia Pacific, Middle East & Africa, South & Central America

Country Scope
Country Scope

This text is related
to country scope.

Frequently Asked Questions


By type, which segment accounted for the largest share in the global dry ice market in 2022?

Based on type, the global dry ice market is segmented into pellets, blocks, and others. In 2022, blocks segment accounted for the largest revenue share and is expected to account for the highest growth rate over forecast period. Dry ice blocks are easy to store and can be transported conveniently. Most storage units accommodate dry ice blocks with little or no difficulty; moreover, the blocks can be shaped into different sizes as per requirement. Thus, the block segment accounted for the highest share in the market and is expected to grow with highest growth rate over forecast period.

Which application segment is the fastest growing in the global dry ice market?

Based on application, the global dry ice market is segmented into food and beverages, storage and transportation, healthcare, industrial applications, and others. In 2022, the food and beverages is expected to account for the highest growth rate over forecast period. The growing food and beverages industry, especially in Asia Pacific, is expected to contribute to the high growth rate of food and beverages application.

What is the key driver for the growth of the global dry ice market?

Increasing preference for dry ice over water-based ice is expected to drive the demand for dry ice market. The dry ice has a low temperature than water-based ice. When it is heated, it directly changes into the gas and does not leave any residue. The dry ice is cost effective and has non-combustible and non-toxic properties.

In 2022, which application held the largest market share in global dry ice market?

Based on application, the global dry ice market is segmented into food and beverages, storage and transportation, healthcare, industrial applications, and others. In 2022, the storage and transportation segment accounted for the largest revenue share. The global cold chain market is on the rise as the demand for frozen foods has significantly increase. The rise in cold chain market has led to high share of storage and transportation segment.

In 2020, which region held the largest share of the global dry ice market?

In 2021, Asia Pacific accounted for the largest share in the global dry ice market. Asia Pacific consists of developing countries such as China and India which have a rapidly growing food and beverages industries. The high consumption for various end uses in the region has resulted in largest share for the region.

Can you list some of the major players operating in the global dry ice market?

The major players operating in the global dry ice market are Polar Ice; Continental Carbonic Products Inc.; Sicgil India Limited; Linde PLC; Dry Ice UK Ltd.; Dry Ice Corp; Reliant Dry Ice; CryoCab; Praxair Technology, Inc.; and ACP among others.

Trends and growth analysis reports related to Chemicals and Materials : READ MORE..   
Your data will never be shared with third parties, however, we may send you information from time to time about our products that may be of interest to you. By submitting your details, you agree to be contacted by us. You may contact us at any time to opt-out.

The List of Companies - Dry Ice Market

  1. Polar Ice
  2. Continental Carbonic Products Inc.
  3. Sicgil India Limited
  4. Linde PLC
  5. Dry Ice UK Ltd.
  6. Dry Ice Corp
  7. Reliant Dry Ice
  8. CryoCab
  9. Praxair Technology, Inc.
  10. ACP       

Buy Now  

The Insight Partners performs research in 4 major stages: Data Collection & Secondary Research, Primary Research, Data Analysis and Data Triangulation & Final Review.

  1. Data Collection and Secondary Research:

As a market research and consulting firm operating from a decade, we have published and advised several client across the globe. First step for any study will start with an assessment of currently available data and insights from existing reports. Further, historical and current market information is collected from Investor Presentations, Annual Reports, SEC Filings, etc., and other information related to company’s performance and market positioning are gathered from Paid Databases (Factiva, Hoovers, and Reuters) and various other publications available in public domain.

Several associations trade associates, technical forums, institutes, societies and organization are accessed to gain technical as well as market related insights through their publications such as research papers, blogs and press releases related to the studies are referred to get cues about the market. Further, white papers, journals, magazines, and other news articles published in last 3 years are scrutinized and analyzed to understand the current market trends.

  1. Primary Research:

The primarily interview analysis comprise of data obtained from industry participants interview and answers to survey questions gathered by in-house primary team.

For primary research, interviews are conducted with industry experts/CEOs/Marketing Managers/VPs/Subject Matter Experts from both demand and supply side to get a 360-degree view of the market. The primary team conducts several interviews based on the complexity of the markets to understand the various market trends and dynamics which makes research more credible and precise.

A typical research interview fulfils the following functions:

  • Provides first-hand information on the market size, market trends, growth trends, competitive landscape, and outlook
  • Validates and strengthens in-house secondary research findings
  • Develops the analysis team’s expertise and market understanding

Primary research involves email interactions and telephone interviews for each market, category, segment, and sub-segment across geographies. The participants who typically take part in such a process include, but are not limited to:

  • Industry participants: VPs, business development managers, market intelligence managers and national sales managers
  • Outside experts: Valuation experts, research analysts and key opinion leaders specializing in the electronics and semiconductor industry.

Below is the breakup of our primary respondents by company, designation, and region:

Research Methodology

Once we receive the confirmation from primary research sources or primary respondents, we finalize the base year market estimation and forecast the data as per the macroeconomic and microeconomic factors assessed during data collection.

  1. Data Analysis:

Once data is validated through both secondary as well as primary respondents, we finalize the market estimations by hypothesis formulation and factor analysis at regional and country level.

  • Macro-Economic Factor Analysis:

We analyse macroeconomic indicators such the gross domestic product (GDP), increase in the demand for goods and services across industries, technological advancement, regional economic growth, governmental policies, the influence of COVID-19, PEST analysis, and other aspects. This analysis aids in setting benchmarks for various nations/regions and approximating market splits. Additionally, the general trend of the aforementioned components aid in determining the market's development possibilities.

  • Country Level Data:

Various factors that are especially aligned to the country are taken into account to determine the market size for a certain area and country, including the presence of vendors, such as headquarters and offices, the country's GDP, demand patterns, and industry growth. To comprehend the market dynamics for the nation, a number of growth variables, inhibitors, application areas, and current market trends are researched. The aforementioned elements aid in determining the country's overall market's growth potential.

  • Company Profile:

The “Table of Contents” is formulated by listing and analyzing more than 25 - 30 companies operating in the market ecosystem across geographies. However, we profile only 10 companies as a standard practice in our syndicate reports. These 10 companies comprise leading, emerging, and regional players. Nonetheless, our analysis is not restricted to the 10 listed companies, we also analyze other companies present in the market to develop a holistic view and understand the prevailing trends. The “Company Profiles” section in the report covers key facts, business description, products & services, financial information, SWOT analysis, and key developments. The financial information presented is extracted from the annual reports and official documents of the publicly listed companies. Upon collecting the information for the sections of respective companies, we verify them via various primary sources and then compile the data in respective company profiles. The company level information helps us in deriving the base number as well as in forecasting the market size.

  • Developing Base Number:

Aggregation of sales statistics (2020-2022) and macro-economic factor, and other secondary and primary research insights are utilized to arrive at base number and related market shares for 2022. The data gaps are identified in this step and relevant market data is analyzed, collected from paid primary interviews or databases. On finalizing the base year market size, forecasts are developed on the basis of macro-economic, industry and market growth factors and company level analysis.

  1. Data Triangulation and Final Review:

The market findings and base year market size calculations are validated from supply as well as demand side. Demand side validations are based on macro-economic factor analysis and benchmarks for respective regions and countries. In case of supply side validations, revenues of major companies are estimated (in case not available) based on industry benchmark, approximate number of employees, product portfolio, and primary interviews revenues are gathered. Further revenue from target product/service segment is assessed to avoid overshooting of market statistics. In case of heavy deviations between supply and demand side values, all thes steps are repeated to achieve synchronization.

We follow an iterative model, wherein we share our research findings with Subject Matter Experts (SME’s) and Key Opinion Leaders (KOLs) until consensus view of the market is not formulated – this model negates any drastic deviation in the opinions of experts. Only validated and universally acceptable research findings are quoted in our reports.

We have important check points that we use to validate our research findings – which we call – data triangulation, where we validate the information, we generate from secondary sources with primary interviews and then we re-validate with our internal data bases and Subject matter experts. This comprehensive model enables us to deliver high quality, reliable data in shortest possible time.