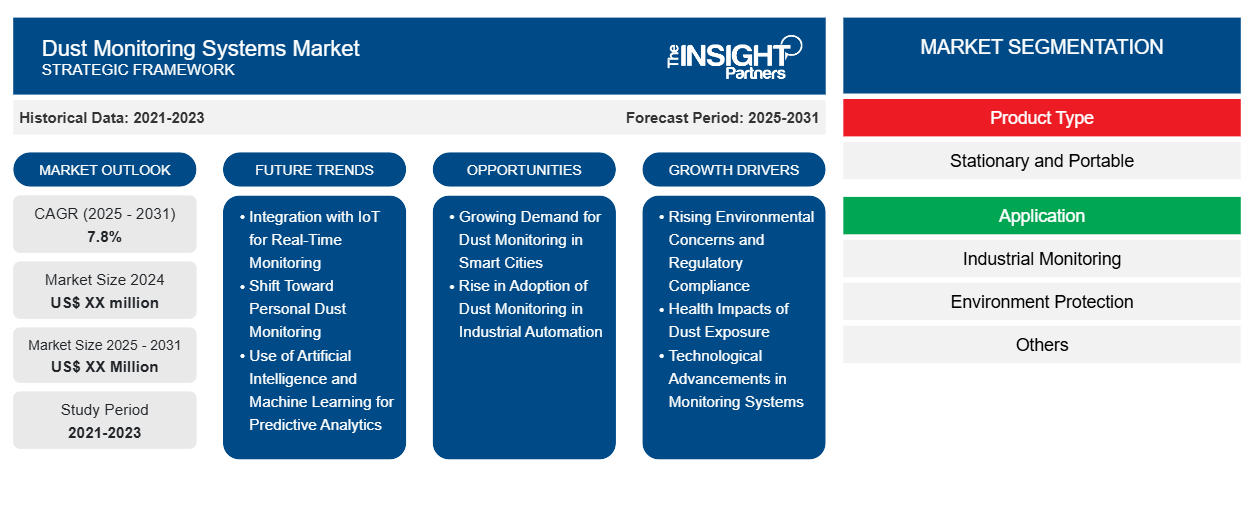
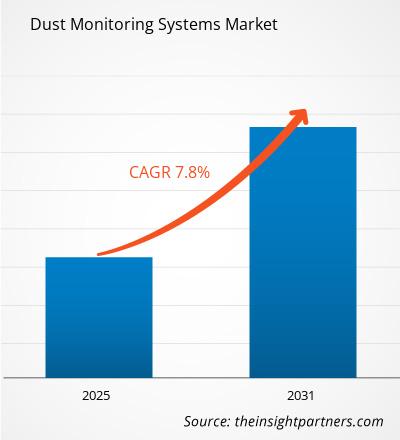
من المتوقع أن يسجل سوق أنظمة مراقبة الغبار معدل نمو سنوي مركب بنسبة 7.8٪ من عام 2023 إلى عام 2031، مع توسع حجم السوق من XX مليون دولار أمريكي في عام 2023 إلى XX مليون دولار أمريكي بحلول عام 2031.
تم تقسيم التقرير حسب نوع المنتج (ثابت ومحمول)، والتطبيق (المراقبة الصناعية، وحماية البيئة، وغيرها). كما تم تقسيم التحليل العالمي إلى أجزاء على المستوى الإقليمي والدول الرئيسية. ويقدم التقرير القيمة بالدولار الأمريكي للتحليل والأجزاء المذكورة أعلاه
غرض التقرير
يهدف تقرير سوق أنظمة مراقبة الغبار الصادر عن The Insight Partners إلى وصف المشهد الحالي والنمو المستقبلي وأهم العوامل الدافعة والتحديات والفرص. سيوفر هذا رؤى لمختلف أصحاب المصلحة في الأعمال التجارية، مثل:
- مزودي/مصنعي التكنولوجيا: لفهم ديناميكيات السوق المتطورة ومعرفة فرص النمو المحتملة، وتمكينهم من اتخاذ قرارات استراتيجية مستنيرة.
- المستثمرون: إجراء تحليل شامل للاتجاهات فيما يتعلق بمعدل نمو السوق، وتوقعات السوق المالية، والفرص المتاحة عبر سلسلة القيمة.
- الهيئات التنظيمية: لتنظيم السياسات ومراقبة الأنشطة في السوق بهدف تقليل الانتهاكات والحفاظ على ثقة المستثمرين والحفاظ على سلامة السوق واستقرارها.
تجزئة سوق أنظمة مراقبة الغبار
نوع المنتج
- ثابتة ومحمولة
طلب
- المراقبة الصناعية
- حماية البيئة
- آحرون
قم بتخصيص هذا التقرير ليناسب متطلباتك
ستحصل على تخصيص لأي تقرير - مجانًا - بما في ذلك أجزاء من هذا التقرير، أو تحليل على مستوى الدولة، وحزمة بيانات Excel، بالإضافة إلى الاستفادة من العروض والخصومات الرائعة للشركات الناشئة والجامعات
سوق أنظمة مراقبة الغبار: رؤى استراتيجية
- احصل على أهم اتجاهات السوق الرئيسية لهذا التقرير.ستتضمن هذه العينة المجانية تحليلاً للبيانات، بدءًا من اتجاهات السوق وحتى التقديرات والتوقعات.
عوامل نمو سوق أنظمة مراقبة الغبار
- المخاوف البيئية المتزايدة والامتثال التنظيمي: مع تزايد الوعي بجودة الهواء وتأثيره على صحة الإنسان والبيئة، تطبق الهيئات التنظيمية في جميع أنحاء العالم معايير أكثر صرامة لتلوث الهواء. أصبحت الصناعات مثل التعدين والبناء والتصنيع ملزمة الآن بمراقبة انبعاثات الغبار والتحكم فيها للامتثال للوائح البيئية. وقد أدى هذا إلى زيادة الطلب بشكل كبير على أنظمة مراقبة الغبار المتقدمة لضمان الامتثال والحد من الانبعاثات الضارة، مما أدى إلى نمو السوق.
- التأثيرات الصحية للتعرض للغبار: إن الوعي المتزايد بالآثار الصحية الضارة المرتبطة بالتعرض للغبار، مثل مشاكل الجهاز التنفسي وأمراض القلب والأوعية الدموية وسرطان الرئة، هو محرك رئيسي آخر لسوق أنظمة مراقبة الغبار. تتبنى الصناعات مثل البناء والتعدين والزراعة، التي تنتج مستويات عالية من الغبار، حلول مراقبة الغبار لحماية صحة العمال ومنع المشكلات الصحية طويلة الأمد. هذا التركيز المتزايد على الصحة والسلامة المهنية يغذي الطلب على أنظمة مراقبة الغبار الموثوقة.
- التطورات التكنولوجية في أنظمة المراقبة: إن التطورات المستمرة في تكنولوجيا الاستشعار وتحليل البيانات والاتصالات اللاسلكية تدفع الابتكار في أنظمة مراقبة الغبار. توفر حلول مراقبة الغبار الحديثة دقة أعلى وجمع البيانات في الوقت الفعلي وقدرات المراقبة عن بعد. وبفضل التقنيات المحسنة، توفر هذه الأنظمة رؤى أفضل لمستويات الغبار وتمكن الصناعات من اتخاذ إجراءات في الوقت المناسب للتخفيف من المخاطر، مما يؤدي إلى تسريع تبنيها عبر مختلف القطاعات.
الاتجاهات المستقبلية لسوق أنظمة مراقبة الغبار
- التكامل مع إنترنت الأشياء للمراقبة في الوقت الفعلي: يعد التكامل المتزايد لإنترنت الأشياء للمراقبة في الوقت الفعلي وتحليل البيانات أحد الاتجاهات المهمة في سوق أنظمة مراقبة الغبار. تتيح أنظمة مراقبة الغبار التي تدعمها إنترنت الأشياء للصناعات مراقبة مستويات الغبار بشكل مستمر، والوصول إلى البيانات عن بُعد، وتلقي التنبيهات عندما تتجاوز تركيزات الغبار الحدود الآمنة. يتيح هذا الإدارة الاستباقية للقضايا المتعلقة بالغبار ويدعم اتخاذ القرار في الوقت الفعلي، مما يعزز الكفاءة التشغيلية والامتثال لمعايير السلامة.
- التحول نحو مراقبة الغبار الشخصي: هناك اتجاه متزايد نحو تطوير وتبني أجهزة مراقبة الغبار الشخصي التي يمكن للعمال ارتداؤها في البيئات الخطرة. تتيح هذه الأجهزة المحمولة للأفراد تتبع تعرضهم للغبار في الوقت الفعلي، مما يوفر بيانات قيمة لتقييمات الصحة المهنية. مع تزايد تركيز المنظمات على سلامة العمال ومراقبة الصحة الشخصية، تكتسب أنظمة مراقبة الغبار الشخصي شعبية، خاصة في الصناعات مثل التعدين والبناء والزراعة.
- استخدام الذكاء الاصطناعي والتعلم الآلي للتحليلات التنبؤية: هناك اتجاه رئيسي آخر في سوق مراقبة الغبار وهو استخدام الذكاء الاصطناعي والتعلم الآلي للتنبؤ بمستويات تلوث الغبار والمخاطر المحتملة. تقوم خوارزميات الذكاء الاصطناعي والتعلم الآلي بتحليل كميات كبيرة من البيانات من أنظمة مراقبة الغبار للتنبؤ بالأحداث المتعلقة بالغبار واقتراح التدابير الوقائية. تساعد هذه القدرة التنبؤية الشركات على التخفيف من المخاطر قبل تفاقمها، مما يوفر نهجًا أكثر استباقية لإدارة الغبار وتحسين السلامة العامة في مكان العمل.
فرص سوق أنظمة مراقبة الغبار
- الطلب المتزايد على مراقبة الغبار في المدن الذكية: إن مفهوم المدن الذكية، حيث يتم دمج التكنولوجيا في البنية التحتية الحضرية لتحسين الإدارة، يوفر فرصة ناشئة لسوق أنظمة مراقبة الغبار. يمكن تنفيذ أنظمة مراقبة الغبار كجزء من مبادرات المدينة الذكية لتتبع ومراقبة جودة الهواء في البيئات الحضرية. مع تزايد مشكلة تلوث الهواء في العديد من المدن، فإن دمج أنظمة مراقبة الغبار في التخطيط والإدارة الحضرية من شأنه أن يوفر فرصًا لتركيبات جديدة وترقيات للأنظمة.
- ارتفاع في اعتماد مراقبة الغبار في الأتمتة الصناعية: مع تزايد اعتماد الأتمتة الصناعية، أصبحت أنظمة مراقبة الغبار مدمجة في خطوط الإنتاج الآلية والمصانع الذكية. تتطلب الأنظمة الآلية بيانات في الوقت الفعلي لتحسين العمليات، وتساعد مراقبة الغبار في الحفاظ على بيئة آمنة. يقدم هذا الاتجاه فرصة لسوق أنظمة مراقبة الغبار للتوسع في قطاع الأتمتة الصناعية، وتقديم حلول تكمل تقنيات الأتمتة وتضمن سلامة وكفاءة عمليات الإنتاج.
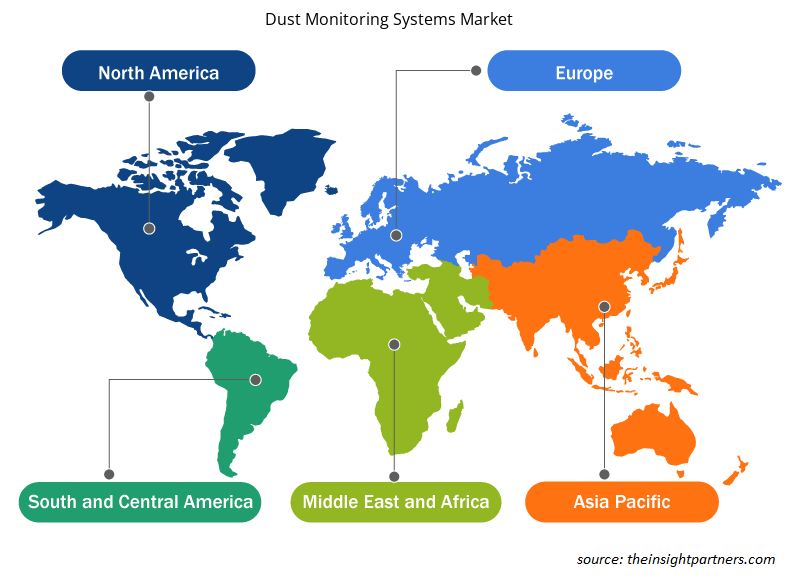
رؤى إقليمية حول سوق أنظمة مراقبة الغبار
لقد قام المحللون في Insight Partners بشرح الاتجاهات والعوامل الإقليمية المؤثرة على سوق أنظمة مراقبة الغبار طوال فترة التوقعات بشكل شامل. يناقش هذا القسم أيضًا قطاعات سوق أنظمة مراقبة الغبار والجغرافيا في جميع أنحاء أمريكا الشمالية وأوروبا ومنطقة آسيا والمحيط الهادئ والشرق الأوسط وأفريقيا وأمريكا الجنوبية والوسطى.
- احصل على البيانات الإقليمية المحددة لسوق أنظمة مراقبة الغبار
نطاق تقرير سوق أنظمة مراقبة الغبار
| سمة التقرير | تفاصيل |
|---|---|
| حجم السوق في عام 2023 | XX مليون دولار أمريكي |
| حجم السوق بحلول عام 2031 | XX مليون دولار أمريكي |
| معدل النمو السنوي المركب العالمي (2023 - 2031) | 7.8% |
| البيانات التاريخية | 2021-2022 |
| فترة التنبؤ | 2024-2031 |
| القطاعات المغطاة | حسب نوع المنتج
|
| المناطق والدول المغطاة | أمريكا الشمالية
|
| قادة السوق وملفات تعريف الشركات الرئيسية |
|
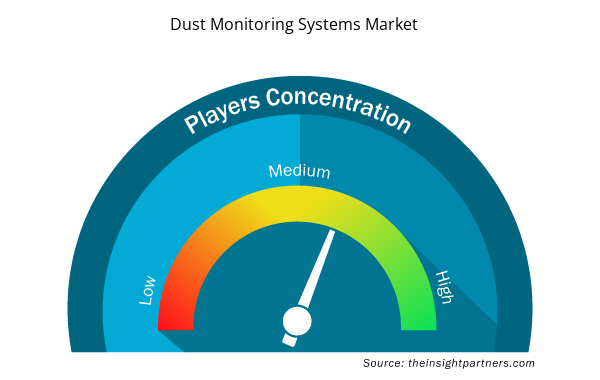
كثافة اللاعبين في سوق أنظمة مراقبة الغبار: فهم تأثيرها على ديناميكيات الأعمال
يشهد سوق أنظمة مراقبة الغبار نموًا سريعًا، مدفوعًا بالطلب المتزايد من المستخدم النهائي بسبب عوامل مثل تفضيلات المستهلك المتطورة والتقدم التكنولوجي والوعي المتزايد بفوائد المنتج. ومع ارتفاع الطلب، تعمل الشركات على توسيع عروضها والابتكار لتلبية احتياجات المستهلكين والاستفادة من الاتجاهات الناشئة، مما يؤدي إلى زيادة نمو السوق.
تشير كثافة اللاعبين في السوق إلى توزيع الشركات أو المؤسسات العاملة في سوق أو صناعة معينة. وهي تشير إلى عدد المنافسين (اللاعبين في السوق) الموجودين في مساحة سوق معينة نسبة إلى حجمها أو قيمتها السوقية الإجمالية.
الشركات الرئيسية العاملة في سوق أنظمة مراقبة الغبار هي:
- شركة ايركوال المحدودة
- شركة أميتك
- مجموعة دوراج
- شركة دينوبتيك سيستمز المحدودة
- شركة هانغتشو زيتيان للتكنولوجيا المحدودة
إخلاء المسؤولية : الشركات المذكورة أعلاه ليست مرتبة بأي ترتيب معين.
- احصل على نظرة عامة على أهم اللاعبين الرئيسيين في سوق أنظمة مراقبة الغبار
نقاط البيع الرئيسية
- التغطية الشاملة: يغطي التقرير بشكل شامل تحليل المنتجات والخدمات والأنواع والمستخدمين النهائيين لسوق أنظمة مراقبة الغبار، مما يوفر صورة شاملة.
- تحليل الخبراء: تم تجميع التقرير على أساس الفهم العميق لخبراء الصناعة والمحللين.
- معلومات محدثة: يضمن التقرير أهمية الأعمال التجارية بسبب تغطيته للمعلومات الحديثة واتجاهات البيانات.
- خيارات التخصيص: يمكن تخصيص هذا التقرير لتلبية متطلبات العملاء المحددة وبما يتناسب مع استراتيجيات العمل بشكل مناسب.
وبالتالي، يمكن أن يساعد تقرير البحث حول سوق أنظمة مراقبة الغبار في تمهيد الطريق لفك شفرة وفهم سيناريو الصناعة وآفاق النمو. ورغم وجود بعض المخاوف المشروعة، فإن الفوائد الإجمالية لهذا التقرير تميل إلى التفوق على العيوب.
- التحليل التاريخي (سنتان)، السنة الأساسية، التوقعات (7 سنوات) مع معدل النمو السنوي المركب
- تحليل PEST و SWOT
- حجم السوق والقيمة / الحجم - عالميًا وإقليميًا وقطريًا
- الصناعة والمنافسة
- مجموعة بيانات Excel


- Fixed-Base Operator Market
- Legal Case Management Software Market
- Virtual Event Software Market
- Europe Surety Market
- Vertical Farming Crops Market
- Excimer & Femtosecond Ophthalmic Lasers Market
- Trade Promotion Management Software Market
- Bioremediation Technology and Services Market
- Medical Devices Market
- Redistribution Layer Material Market

Report Coverage
Revenue forecast, Company Analysis, Industry landscape, Growth factors, and Trends

Segment Covered
This text is related
to segments covered.

Regional Scope
North America, Europe, Asia Pacific, Middle East & Africa, South & Central America

Country Scope
This text is related
to country scope.
الأسئلة الشائعة
Some of the customization options available based on the request are an additional 3-5 company profiles and country-specific analysis of 3-5 countries of your choice. Customizations are to be requested/discussed before making final order confirmation# as our team would review the same and check the feasibility
The report can be delivered in PDF/PPT format; we can also share excel dataset based on the request
Increased Use of Portable Monitoring Devices
Higher Industrial and Construction Activities, Compliance and Environmental Standards
The Dust Monitoring Systems Market is estimated to witness a CAGR of 7.8% from 2023 to 2031
Trends and growth analysis reports related to Electronics and Semiconductor : READ MORE..
1.Aeroqual Limited2.AMETEK, Inc.3.DURAG Group4.DynOptic Systems Ltd5.Hangzhou Zetian Technology Co., Ltd6.Kanomax7.KANSAI Automation Co., Ltd.8.Sintrol Oy9.Trolex Ltd10.TSI Incorporated
The Insight Partners performs research in 4 major stages: Data Collection & Secondary Research, Primary Research, Data Analysis and Data Triangulation & Final Review.
- Data Collection and Secondary Research:
As a market research and consulting firm operating from a decade, we have published and advised several client across the globe. First step for any study will start with an assessment of currently available data and insights from existing reports. Further, historical and current market information is collected from Investor Presentations, Annual Reports, SEC Filings, etc., and other information related to company’s performance and market positioning are gathered from Paid Databases (Factiva, Hoovers, and Reuters) and various other publications available in public domain.
Several associations trade associates, technical forums, institutes, societies and organization are accessed to gain technical as well as market related insights through their publications such as research papers, blogs and press releases related to the studies are referred to get cues about the market. Further, white papers, journals, magazines, and other news articles published in last 3 years are scrutinized and analyzed to understand the current market trends.
- Primary Research:
The primarily interview analysis comprise of data obtained from industry participants interview and answers to survey questions gathered by in-house primary team.
For primary research, interviews are conducted with industry experts/CEOs/Marketing Managers/VPs/Subject Matter Experts from both demand and supply side to get a 360-degree view of the market. The primary team conducts several interviews based on the complexity of the markets to understand the various market trends and dynamics which makes research more credible and precise.
A typical research interview fulfils the following functions:
- Provides first-hand information on the market size, market trends, growth trends, competitive landscape, and outlook
- Validates and strengthens in-house secondary research findings
- Develops the analysis team’s expertise and market understanding
Primary research involves email interactions and telephone interviews for each market, category, segment, and sub-segment across geographies. The participants who typically take part in such a process include, but are not limited to:
- Industry participants: VPs, business development managers, market intelligence managers and national sales managers
- Outside experts: Valuation experts, research analysts and key opinion leaders specializing in the electronics and semiconductor industry.
Below is the breakup of our primary respondents by company, designation, and region:

Once we receive the confirmation from primary research sources or primary respondents, we finalize the base year market estimation and forecast the data as per the macroeconomic and microeconomic factors assessed during data collection.
- Data Analysis:
Once data is validated through both secondary as well as primary respondents, we finalize the market estimations by hypothesis formulation and factor analysis at regional and country level.
- Macro-Economic Factor Analysis:
We analyse macroeconomic indicators such the gross domestic product (GDP), increase in the demand for goods and services across industries, technological advancement, regional economic growth, governmental policies, the influence of COVID-19, PEST analysis, and other aspects. This analysis aids in setting benchmarks for various nations/regions and approximating market splits. Additionally, the general trend of the aforementioned components aid in determining the market's development possibilities.
- Country Level Data:
Various factors that are especially aligned to the country are taken into account to determine the market size for a certain area and country, including the presence of vendors, such as headquarters and offices, the country's GDP, demand patterns, and industry growth. To comprehend the market dynamics for the nation, a number of growth variables, inhibitors, application areas, and current market trends are researched. The aforementioned elements aid in determining the country's overall market's growth potential.
- Company Profile:
The “Table of Contents” is formulated by listing and analyzing more than 25 - 30 companies operating in the market ecosystem across geographies. However, we profile only 10 companies as a standard practice in our syndicate reports. These 10 companies comprise leading, emerging, and regional players. Nonetheless, our analysis is not restricted to the 10 listed companies, we also analyze other companies present in the market to develop a holistic view and understand the prevailing trends. The “Company Profiles” section in the report covers key facts, business description, products & services, financial information, SWOT analysis, and key developments. The financial information presented is extracted from the annual reports and official documents of the publicly listed companies. Upon collecting the information for the sections of respective companies, we verify them via various primary sources and then compile the data in respective company profiles. The company level information helps us in deriving the base number as well as in forecasting the market size.
- Developing Base Number:
Aggregation of sales statistics (2020-2022) and macro-economic factor, and other secondary and primary research insights are utilized to arrive at base number and related market shares for 2022. The data gaps are identified in this step and relevant market data is analyzed, collected from paid primary interviews or databases. On finalizing the base year market size, forecasts are developed on the basis of macro-economic, industry and market growth factors and company level analysis.
- Data Triangulation and Final Review:
The market findings and base year market size calculations are validated from supply as well as demand side. Demand side validations are based on macro-economic factor analysis and benchmarks for respective regions and countries. In case of supply side validations, revenues of major companies are estimated (in case not available) based on industry benchmark, approximate number of employees, product portfolio, and primary interviews revenues are gathered. Further revenue from target product/service segment is assessed to avoid overshooting of market statistics. In case of heavy deviations between supply and demand side values, all thes steps are repeated to achieve synchronization.
We follow an iterative model, wherein we share our research findings with Subject Matter Experts (SME’s) and Key Opinion Leaders (KOLs) until consensus view of the market is not formulated – this model negates any drastic deviation in the opinions of experts. Only validated and universally acceptable research findings are quoted in our reports.
We have important check points that we use to validate our research findings – which we call – data triangulation, where we validate the information, we generate from secondary sources with primary interviews and then we re-validate with our internal data bases and Subject matter experts. This comprehensive model enables us to deliver high quality, reliable data in shortest possible time.
 احصل على عينة مجانية لهذا التقرير