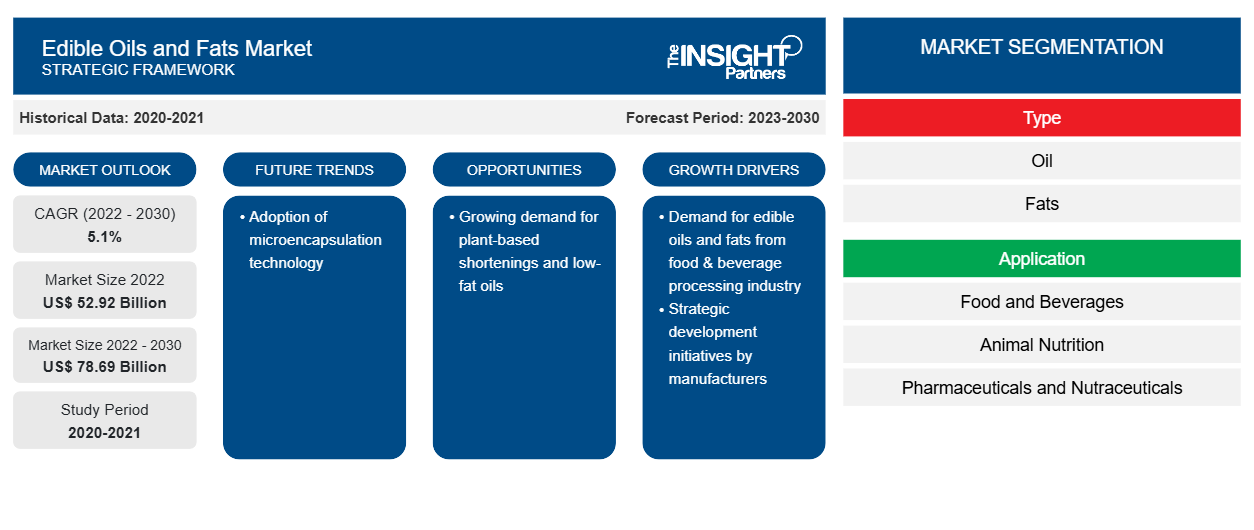
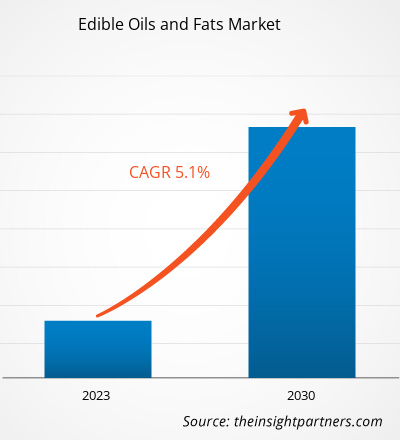
[تقرير بحثي] من المتوقع أن ينمو سوق الزيوت والدهون الصالحة للأكل من 52،920.00 مليون دولار أمريكي في عام 2022 إلى 78،686.61 مليون دولار أمريكي بحلول عام 2030؛ ومن المتوقع أن يسجل معدل نمو سنوي مركب بنسبة 5.1٪ من عام 2023 إلى عام 2030.
رؤى السوق ووجهة نظر المحلل:
يتم الحصول على الدهون الصالحة للأكل من خلال المواد الخام ذات الأصل الحيواني مثل دهن الخنزير (شحم الخنزير) والشحم البقري أو من أصل نباتي. تعد شركات معالجة اللحوم موردي المواد الخام لمصنعي الدهون الصالحة للأكل والمشتقة من الحيوانات. لدى الشركات المصنعة اتفاقيات طويلة الأجل مع صناعات معالجة اللحوم لتوريد المواد الخام دون انقطاع. يتم تقطيع الأنسجة الدهنية من لحم الخنزير أو لحم البقر إلى قطع صغيرة وغليها في أجهزة هضم بالبخار، حيث يتم إطلاق الدهون في الماء. تطفو الدهون فوق سطح الماء ويتم جمعها عن طريق الإزالة. يتم ضغط المادة الغشائية للأنسجة الحيوانية في مكبس هيدروليكي حيث يتم الحصول على دهون إضافية. يتم فصل الدهون عن الطور السائل في جهاز طرد مركزي لإزالة الحمأة.
يتم الحصول على الدهون النباتية مثل السمن النباتي عن طريق هدرجة زيت فول الصويا أو زيت الذرة أو زيت القرطم. يتم تبييض الزيت أولاً باستخدام تراب التبييض أو الفحم لإزالة الرائحة واللون غير المرغوب فيهما. ثم يتم تمريره عبر غاز الهيدروجين تحت ضغط عالٍ، مما يؤدي إلى تصلب الزيت للحصول على السمن النباتي. هناك عمليات مختلفة لتصنيع الزيوت والدهون النباتية.
يتم تعبئة الزيوت والدهون الصالحة للأكل المكررة في حاويات وإرسالها إلى المستخدمين النهائيين مثل صناعات الأغذية والمشروبات وتغذية الحيوانات والأدوية والمكملات الغذائية من خلال الموزعين والموردين. تعد شركة Cargill Incorporated وBunge Limited وADM وFuji Oil Co Ltd وKao Corporation من بين الشركات المصنعة الرئيسية للزيوت والدهون الصالحة للأكل في جميع أنحاء العالم.
محركات النمو والتحديات:
وفقًا لوزارة الزراعة الأمريكية (USDA)، فإن زيت الصويا هو ثاني أكبر زيت نباتي مستهلك. يتم استخدامه على نطاق واسع في القلي والطهي والتقصير والسمن. وفقًا لمنظمة التعاون الاقتصادي والتنمية (OECD)، في عام 2022، بلغ استهلاك الزيوت النباتية 249 مليون طن متري، حيث يمثل قطاع الأغذية الحصة الأكبر. علاوة على ذلك، تستخدم صناعة الحلويات الزبدة بشكل كبير كمكون أساسي، تليها السمن. تُستخدم الزيوت والدهون الصالحة للأكل عالية الجودة في المخابز والحلويات ومنتجات الألبان والحلويات المجمدة والوجبات الخفيفة والوجبات الجاهزة للأكل والجاهزة للطهي وغيرها من الأطعمة والمشروبات. الزيوت والدهون المكررة هي مصدر غني بالدهون. وبالتالي، يتزايد استخدامها بسبب زيادة استخدامها وتزايد عدد سكان العالم.
تشهد صناعة الأغذية والمشروبات في مناطق مختلفة مثل أمريكا الشمالية ومنطقة آسيا والمحيط الهادئ نموًا مستمرًا بسبب الميل المتزايد نحو الاستدامة وتفضيل الراحة والمنتجات الجاهزة للأكل والاعتماد المتزايد على المنتجات العضوية والنباتية. تشهد الصناعة حركة كبيرة مع الابتكار في العمليات والمنتجات والخدمات لتلبية تفضيلات المستهلكين المتغيرة بسرعة. وفقًا لمكتب الإحصاء الأمريكي، كان لدى الولايات المتحدة 39646 مصنعًا لتصنيع الأغذية والمشروبات في عام 2020. منها كاليفورنيا وتكساس ونيويورك 6116 و2625 و2600 على التوالي. وبالمثل، تعد صناعة الأغذية والمشروبات واحدة من المساهمين المهمين في الاقتصاد الأوروبي. وبالتالي، فإن صناعة الأغذية والمشروبات المتنامية في جميع أنحاء العالم تدفع الطلب على الزيوت والدهون الصالحة للأكل.
قم بتخصيص هذا التقرير ليناسب متطلباتك
ستحصل على تخصيص لأي تقرير - مجانًا - بما في ذلك أجزاء من هذا التقرير، أو تحليل على مستوى الدولة، وحزمة بيانات Excel، بالإضافة إلى الاستفادة من العروض والخصومات الرائعة للشركات الناشئة والجامعات
- احصل على أهم اتجاهات السوق الرئيسية لهذا التقرير.ستتضمن هذه العينة المجانية تحليلاً للبيانات، بدءًا من اتجاهات السوق وحتى التقديرات والتوقعات.
تقسيم التقرير ونطاقه:
"يُقسم " سوق الزيوت والدهون الصالحة للأكل العالمية " على أساس النوع والتطبيق والجغرافيا. بناءً على النوع، ينقسم السوق إلى زيوت ودهون. بناءً على التطبيق، تنقسم الزيوت والدهون الصالحة للأكل العالمية إلى أغذية ومشروبات، وتغذية حيوانية، ومستحضرات صيدلانية ومكملات غذائية. احتل قطاع الزيوت حصة أكبر من السوق العالمية.
سوق الزيوت والدهون الصالحة للأكل
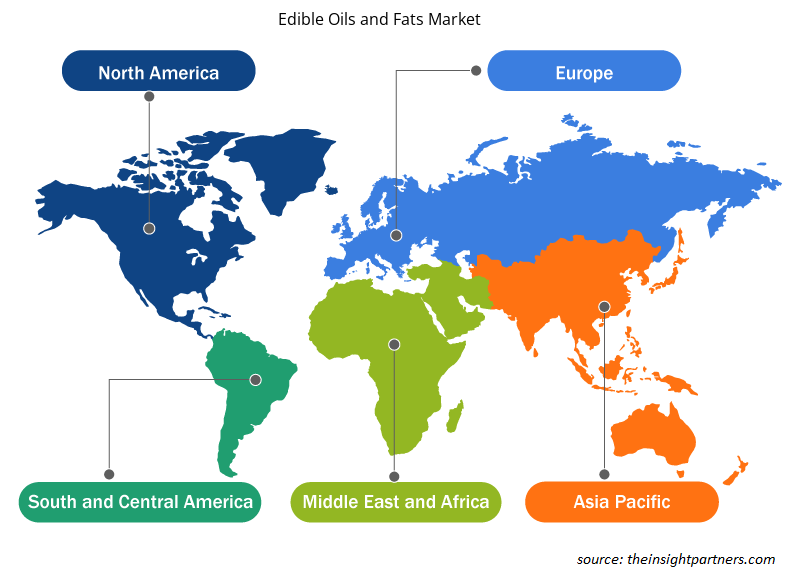
في عام 2022. بناءً على الجغرافيا، يتم تقسيم سوق الزيوت والدهون الصالحة للأكل إلى أمريكا الشمالية (الولايات المتحدة وكندا والمكسيك)، وأوروبا (ألمانيا وفرنسا وإيطاليا والمملكة المتحدة وروسيا وبقية أوروبا)، وآسيا والمحيط الهادئ (أستراليا والصين واليابان والهند وكوريا الجنوبية وبقية آسيا والمحيط الهادئ)، والشرق الأوسط وأفريقيا (جنوب أفريقيا والمملكة العربية السعودية والإمارات العربية المتحدة وبقية الشرق الأوسط وأفريقيا)، وأمريكا الجنوبية والوسطى (البرازيل وتشيلي وبقية أمريكا الجنوبية والوسطى).
التحليل القطاعي:
بناءً على النوع، ينقسم سوق الزيوت والدهون الصالحة للأكل إلى زيت ودهون. احتل قطاع الزيوت حصة أكبر من سوق الزيوت والدهون الصالحة للأكل في عام 2022 ومن المتوقع أن يسجل معدل نمو سنوي مركب أعلى خلال فترة التوقعات. يمكن استخلاص الزيوت النباتية من البذور والحبوب والمكسرات والفواكه. تعد زيوت الزيتون وعباد الشمس والنخيل والكانولا وجوز الهند والقرطم والذرة والفول السوداني وبذور القطن ونواة النخيل وفول الصويا من بين أكثر الزيوت استهلاكًا. بشكل عام، تُستخدم الزيوت النباتية في تحضير الطعام، ويُضاف الزيت الخام للنكهة. كما يستخدم الزيت النباتي في إنتاج الأعلاف الحيوانية. يسهل تثبيت زيوت النخيل، وتحافظ على جودة النكهة والاتساق في الأطعمة المصنعة. لذلك، يفضلها مصنعو الأغذية بشكل متكرر. تعد إندونيسيا وماليزيا وتايلاند ونيجيريا من بين أكبر منتجي ومصدري زيت النخيل. يدفع الوعي المتزايد المتعلق بالمخاوف الصحية المرتبطة بالدهون المتحولة في الزيوت النباتية المهدرجة إلى استخدام زيت النخيل في صناعة الأغذية. إن صناعة الأغذية الزراعية تستهلك كميات كبيرة من زيت النخيل، حيث يستخدم بشكل رئيسي في المخبوزات الصناعية ومنتجات الشوكولاتة والحلويات والآيس كريم وحتى بدائل الوجبات الغذائية. يعتبر زيت النخيل مصدرًا غنيًا بالتوكوفيرول والكاروتينات، التي تمنحه ثباتًا طبيعيًا ضد التدهور التأكسدي. وبالتالي، فإن فوائد وتطبيقات زيت النخيل في مختلف الصناعات النهائية تدفع الطلب عليها في جميع أنحاء العالم.
التحليل الإقليمي:
تنقسم سوق الزيوت والدهون الصالحة للأكل إلى خمس مناطق رئيسية - أمريكا الشمالية وأوروبا وآسيا والمحيط الهادئ وأمريكا الجنوبية والوسطى والشرق الأوسط وأفريقيا. كانت أمريكا الجنوبية والوسطى تهيمن على سوق الزيوت والدهون الصالحة للأكل العالمية وقُدِّرت بنحو 4500 مليار دولار أمريكي في عام 2022. تنقسم سوق الزيوت والدهون الصالحة للأكل في أمريكا الجنوبية والوسطى إلى البرازيل والأرجنتين وبقية أمريكا الجنوبية والوسطى. يتوسع قطاع الوجبات الخفيفة في المنطقة بسبب تفضيل المستهلك المتزايد لخيارات الوجبات الخفيفة المختلفة مثل الوجبات الخفيفة المجمدة والوجبات الخفيفة اللذيذة والوجبات الخفيفة من الفاكهة والوجبات الخفيفة من الحلويات والوجبات الخفيفة من المخبوزات. تلعب الزيوت والدهون الصالحة للأكل دورًا لا يتجزأ، حيث توفر نكهات مميزة للطعام وتوفر وظائف فريدة ومرغوبة في تصنيع الوجبات الخفيفة. على سبيل المثال، الزيوت هي وسائط القلي للأطعمة المقلية، وفي المعجنات، تُضاف الزيوت النباتية لمنع تكتل الدقيق والمكونات الأخرى. ومن ثم، فإن الطلب المتزايد على الوجبات الخفيفة المختلفة والفوائد المرتبطة بالزيوت والدهون الصالحة للأكل يدفع الطلب على الزيوت والدهون الصالحة للأكل في قطاع الوجبات الخفيفة في أمريكا الجنوبية والوسطى.
علاوة على ذلك، شهد الطلب على الزيوت والدهون الصالحة للأكل في الصناعات النهائية مثل تغذية الحيوانات ارتفاعًا في أمريكا الجنوبية والوسطى. ووفقًا لـ Oil World، في عام 2022، اشترت الصين حوالي 70٪ من زيت فول الصويا البرازيلي، وخاصة لاستهلاك البروتين الحيواني. علاوة على ذلك، فإن توسع صناعات التغذية الحيوانية والأدوية والمستحضرات الغذائية يدفع الطلب على الزيوت والدهون الصالحة للأكل المتخصصة. تتطلب هذه الصناعات أنواعًا معينة من الزيوت لتطبيقات مختلفة، مثل تركيبات الأعلاف الحيوانية والتركيبات الصيدلانية. ومع نمو هذه القطاعات وتنوعها، يزداد الطلب على متطلباتها الفريدة، مما يغذي نمو سوق الزيوت والدهون الصالحة للأكل في أمريكا الجنوبية والوسطى.
تطورات الصناعة والفرص المستقبلية:
فيما يلي قائمة بالمبادرات المختلفة التي اتخذها اللاعبون الرئيسيون العاملون في سوق الزيوت والدهون الصالحة للأكل العالمية:
- في أكتوبر 2021، أعلنت شركة ADM، إحدى أبرز شركات تصنيع الدهون والزيوت الصالحة للأكل في الولايات المتحدة، عن خططها لبناء أول مصنع ومصفاة لتكسير فول الصويا على الإطلاق في داكوتا الشمالية لتلبية الطلب المتزايد بسرعة على زيت فول الصويا من صناعات الأغذية والأعلاف الحيوانية.
- في ديسمبر 2021، أعلنت شركة ITOCHU Corporation، التي يقع مقرها الرئيسي في اليابان، عن اتفاقها من خلال شركة ITOCHU International Inc.، التي يقع مقرها الرئيسي في نيويورك، الولايات المتحدة، لتأسيس شركة Fuji Oil International Inc. في الولايات المتحدة. ومن خلال هذه الاتفاقية، تخطط الشركة لتعزيز أعمال الزيوت والدهون في أمريكا الشمالية.
رؤى إقليمية حول سوق الزيوت والدهون الصالحة للأكل
لقد قام المحللون في Insight Partners بشرح الاتجاهات والعوامل الإقليمية المؤثرة على سوق الزيوت والدهون الصالحة للأكل طوال فترة التوقعات بشكل شامل. يناقش هذا القسم أيضًا قطاعات سوق الزيوت والدهون الصالحة للأكل والجغرافيا في جميع أنحاء أمريكا الشمالية وأوروبا ومنطقة آسيا والمحيط الهادئ والشرق الأوسط وأفريقيا وأمريكا الجنوبية والوسطى.

- احصل على البيانات الإقليمية المحددة لسوق الزيوت والدهون الصالحة للأكل
نطاق تقرير سوق الزيوت والدهون الصالحة للأكل
| سمة التقرير | تفاصيل |
|---|---|
| حجم السوق في عام 2022 | 52.92 مليار دولار أمريكي |
| حجم السوق بحلول عام 2030 | 78.69 مليار دولار أمريكي |
| معدل النمو السنوي المركب العالمي (2022 - 2030) | 5.1% |
| البيانات التاريخية | 2020-2021 |
| فترة التنبؤ | 2023-2030 |
| القطاعات المغطاة | حسب النوع
|
| المناطق والدول المغطاة | أمريكا الشمالية
|
| قادة السوق وملفات تعريف الشركات الرئيسية |
|
كثافة اللاعبين في السوق: فهم تأثيرها على ديناميكيات الأعمال
يشهد سوق الزيوت والدهون الصالحة للأكل نموًا سريعًا، مدفوعًا بالطلب المتزايد من جانب المستخدم النهائي بسبب عوامل مثل تفضيلات المستهلكين المتطورة والتقدم التكنولوجي والوعي المتزايد بفوائد المنتج. ومع ارتفاع الطلب، تعمل الشركات على توسيع عروضها والابتكار لتلبية احتياجات المستهلكين والاستفادة من الاتجاهات الناشئة، مما يؤدي إلى زيادة نمو السوق.
تشير كثافة اللاعبين في السوق إلى توزيع الشركات أو المؤسسات العاملة في سوق أو صناعة معينة. وهي تشير إلى عدد المنافسين (اللاعبين في السوق) الموجودين في مساحة سوق معينة نسبة إلى حجمها أو قيمتها السوقية الإجمالية.
الشركات الرئيسية العاملة في سوق الزيوت والدهون الصالحة للأكل هي:
- شركة بونج المحدودة
- شركة آرتشر دانييلز ميدلاند
- شركة فوجي للزيوت المحدودة
- شركة كاو
- ايه ايه كيه ايه بي
إخلاء المسؤولية : الشركات المذكورة أعلاه ليست مرتبة بأي ترتيب معين.

- احصل على نظرة عامة على أهم اللاعبين الرئيسيين في سوق الزيوت والدهون الصالحة للأكل
تأثير جائحة كوفيد-19:
أثرت جائحة كوفيد-19 على الاقتصادات والصناعات في مختلف البلدان. أثرت عمليات الإغلاق وحظر السفر وإغلاق الشركات في الدول الرائدة في أمريكا الشمالية وأوروبا ومنطقة آسيا والمحيط الهادئ وأمريكا الجنوبية والوسطى والشرق الأوسط وأفريقيا سلبًا على نمو مختلف الصناعات، بما في ذلك صناعة الأغذية والمشروبات. أدى إغلاق وحدات التصنيع إلى اضطراب سلاسل التوريد العالمية وأنشطة التصنيع وجداول التسليم ومبيعات مختلف المنتجات الأساسية وغير الأساسية. أعلنت شركات مختلفة عن تأخيرات محتملة في تسليم المنتجات وانخفاض في مبيعات منتجاتها المستقبلية في عام 2020. بالإضافة إلى ذلك، أجبر الحظر الذي فرضته حكومات مختلفة في أوروبا وآسيا وأمريكا الشمالية على السفر الدولي الشركات على تعليق خطط التعاون والشراكة مؤقتًا. كل هذه العوامل أعاقت صناعة الأغذية والمشروبات في عام 2020 وأوائل عام 2021، وبالتالي كبح نمو سوق الزيوت والدهون الصالحة للأكل.
المنافسة والشركات الرئيسية:
تعد شركات Bunge Ltd وArcher-Daniels-Midland Co وFuji Oil Co Ltd وKao Corp وAAK AB وJ-Oil Mills Inc وCargill Inc وOlam Group Ltd وConnOils LLC وLouis Dreyfus Co BV من بين اللاعبين البارزين الذين يعملون في سوق الزيوت والدهون الصالحة للأكل على مستوى العالم. تقدم شركات تصنيع الزيوت والدهون الصالحة للأكل حلول مستخلصات متطورة بميزات مبتكرة لتقديم تجربة فائقة للمستهلكين.
- التحليل التاريخي (سنتان)، السنة الأساسية، التوقعات (7 سنوات) مع معدل النمو السنوي المركب
- تحليل PEST و SWOT
- حجم السوق والقيمة / الحجم - عالميًا وإقليميًا وقطريًا
- الصناعة والمنافسة
- مجموعة بيانات Excel


Report Coverage
Revenue forecast, Company Analysis, Industry landscape, Growth factors, and Trends

Segment Covered
This text is related
to segments covered.

Regional Scope
North America, Europe, Asia Pacific, Middle East & Africa, South & Central America

Country Scope
This text is related
to country scope.
الأسئلة الشائعة
Manufacturers of edible fats and oils invest significantly in the expansion of business and production capacity to serve their customer base better and meet their consumer requirements. In December 2021, ITOCHU Corporation, headquartered in Japan, announced their agreement through ITOCHU International Inc., headquartered in New York, US, for the establishment of Fuji Oil International Inc. in the US. With this agreement, the firm plans to strengthen the oil and fat business in North America.
Based on type, oil segment mainly has the largest revenue share. Vegetable oils can be derived from seeds, cereal grains, nuts, and fruits. The most consumed oils are olive, sunflower, palm, canola, coconut, safflower, corn, peanut, cottonseed, palm kernel, and soybean. Generally, vegetable oils are used in food preparation, and crude oil is added for flavor. Vegetable oil is also used in the production of animal feed.
The major players operating in the global edible oils and fats market are are Bunge Ltd, Archer-Daniels-Midland Co, Fuji Oil Co Ltd, Kao Corp, AAK AB, J-Oil Mills Inc, Cargill Inc, Olam Group Ltd, ConnOils LLC, and Louis Dreyfus Co BV.
Consumers consider plant-based products healthier than conventional products. Rising health consciousness among consumers propels the demand for plant-based and low-fat products. Thus, manufacturers develop plant-based shortenings and low-fat oils to cater to the rising demand. Plant-based shortenings are non-hydrogenated and do not contain cholesterol and trans-fat. Thus, it is considered a healthier alternative to conventional shortenings. Moreover, the increasing prevalence of cardiovascular diseases, obesity, and diabetes over the years is expected to boost the demand for low-fat products such as low-fat oils among various industries, including bakery & confectioneries, dairy & frozen desserts, and snacking.
Asia Pacific accounted for the largest share of the global edible oils and fats market. The market growth is attributed to increasing demand for bakery products, especially breads, cakes, pastries, and muffins, coupled with the growing influence of Western culture on the millennial and Gen-z population in the region. The bakery sector in China witnessed tremendous growth, with retail sales of bakery products accounting for US$ 34 billion in 2020, according to the United States Department of Agriculture (USDA). Moreover, manufacturers of edible oils and fats actively operate across the region and offer edible oils and fats made with fine-quality oil or its fractions. Distinct melting profiles of butter and margarines, packaging types, and the expansion of antifoaming or antioxidant agents of edible oils and fats are available across the region and widely applicable in many end-use industries such as confectionery, bakery, dairy, and infant nutrition.
Based on the application, food and beverages segment is hold a significant share in the market. The demand for edible oils and fats, such as shortenings, is gradually increasing in bakery and confectionery segment as they lubricate the structure of bakery products and shorten or tender flour proteins. Fats and oils in the mixture hold many air cells incorporated during creaming, making the products smooth and creamy. Fats act as enriching agents, add calorie value to baked foods, and develop flakiness in products. The rising demand for baked products, including cakes, breads, cookies, and biscuits, significantly drives edible oils and fats utilization.
Trends and growth analysis reports related to Food and Beverages : READ MORE..
The List of Companies - Edible Oils and Fats Market
- Bunge Ltd
- Archer-Daniels-Midland Co
- Fuji Oil Co Ltd
- Kao Corp
- AAK AB
- J-Oil Mills Inc
- Cargill Inc
- Olam Group Ltd
- ConnOils LLC
- Louis Dreyfus Co BV
The Insight Partners performs research in 4 major stages: Data Collection & Secondary Research, Primary Research, Data Analysis and Data Triangulation & Final Review.
- Data Collection and Secondary Research:
As a market research and consulting firm operating from a decade, we have published and advised several client across the globe. First step for any study will start with an assessment of currently available data and insights from existing reports. Further, historical and current market information is collected from Investor Presentations, Annual Reports, SEC Filings, etc., and other information related to company’s performance and market positioning are gathered from Paid Databases (Factiva, Hoovers, and Reuters) and various other publications available in public domain.
Several associations trade associates, technical forums, institutes, societies and organization are accessed to gain technical as well as market related insights through their publications such as research papers, blogs and press releases related to the studies are referred to get cues about the market. Further, white papers, journals, magazines, and other news articles published in last 3 years are scrutinized and analyzed to understand the current market trends.
- Primary Research:
The primarily interview analysis comprise of data obtained from industry participants interview and answers to survey questions gathered by in-house primary team.
For primary research, interviews are conducted with industry experts/CEOs/Marketing Managers/VPs/Subject Matter Experts from both demand and supply side to get a 360-degree view of the market. The primary team conducts several interviews based on the complexity of the markets to understand the various market trends and dynamics which makes research more credible and precise.
A typical research interview fulfils the following functions:
- Provides first-hand information on the market size, market trends, growth trends, competitive landscape, and outlook
- Validates and strengthens in-house secondary research findings
- Develops the analysis team’s expertise and market understanding
Primary research involves email interactions and telephone interviews for each market, category, segment, and sub-segment across geographies. The participants who typically take part in such a process include, but are not limited to:
- Industry participants: VPs, business development managers, market intelligence managers and national sales managers
- Outside experts: Valuation experts, research analysts and key opinion leaders specializing in the electronics and semiconductor industry.
Below is the breakup of our primary respondents by company, designation, and region:

Once we receive the confirmation from primary research sources or primary respondents, we finalize the base year market estimation and forecast the data as per the macroeconomic and microeconomic factors assessed during data collection.
- Data Analysis:
Once data is validated through both secondary as well as primary respondents, we finalize the market estimations by hypothesis formulation and factor analysis at regional and country level.
- Macro-Economic Factor Analysis:
We analyse macroeconomic indicators such the gross domestic product (GDP), increase in the demand for goods and services across industries, technological advancement, regional economic growth, governmental policies, the influence of COVID-19, PEST analysis, and other aspects. This analysis aids in setting benchmarks for various nations/regions and approximating market splits. Additionally, the general trend of the aforementioned components aid in determining the market's development possibilities.
- Country Level Data:
Various factors that are especially aligned to the country are taken into account to determine the market size for a certain area and country, including the presence of vendors, such as headquarters and offices, the country's GDP, demand patterns, and industry growth. To comprehend the market dynamics for the nation, a number of growth variables, inhibitors, application areas, and current market trends are researched. The aforementioned elements aid in determining the country's overall market's growth potential.
- Company Profile:
The “Table of Contents” is formulated by listing and analyzing more than 25 - 30 companies operating in the market ecosystem across geographies. However, we profile only 10 companies as a standard practice in our syndicate reports. These 10 companies comprise leading, emerging, and regional players. Nonetheless, our analysis is not restricted to the 10 listed companies, we also analyze other companies present in the market to develop a holistic view and understand the prevailing trends. The “Company Profiles” section in the report covers key facts, business description, products & services, financial information, SWOT analysis, and key developments. The financial information presented is extracted from the annual reports and official documents of the publicly listed companies. Upon collecting the information for the sections of respective companies, we verify them via various primary sources and then compile the data in respective company profiles. The company level information helps us in deriving the base number as well as in forecasting the market size.
- Developing Base Number:
Aggregation of sales statistics (2020-2022) and macro-economic factor, and other secondary and primary research insights are utilized to arrive at base number and related market shares for 2022. The data gaps are identified in this step and relevant market data is analyzed, collected from paid primary interviews or databases. On finalizing the base year market size, forecasts are developed on the basis of macro-economic, industry and market growth factors and company level analysis.
- Data Triangulation and Final Review:
The market findings and base year market size calculations are validated from supply as well as demand side. Demand side validations are based on macro-economic factor analysis and benchmarks for respective regions and countries. In case of supply side validations, revenues of major companies are estimated (in case not available) based on industry benchmark, approximate number of employees, product portfolio, and primary interviews revenues are gathered. Further revenue from target product/service segment is assessed to avoid overshooting of market statistics. In case of heavy deviations between supply and demand side values, all thes steps are repeated to achieve synchronization.
We follow an iterative model, wherein we share our research findings with Subject Matter Experts (SME’s) and Key Opinion Leaders (KOLs) until consensus view of the market is not formulated – this model negates any drastic deviation in the opinions of experts. Only validated and universally acceptable research findings are quoted in our reports.
We have important check points that we use to validate our research findings – which we call – data triangulation, where we validate the information, we generate from secondary sources with primary interviews and then we re-validate with our internal data bases and Subject matter experts. This comprehensive model enables us to deliver high quality, reliable data in shortest possible time.


 احصل على عينة مجانية لهذا التقرير