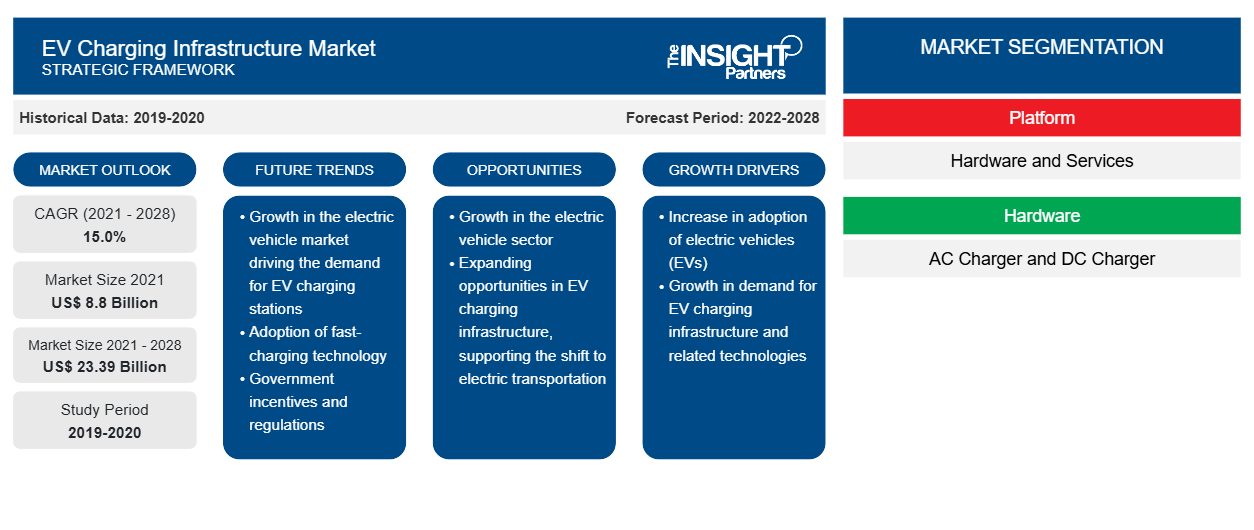
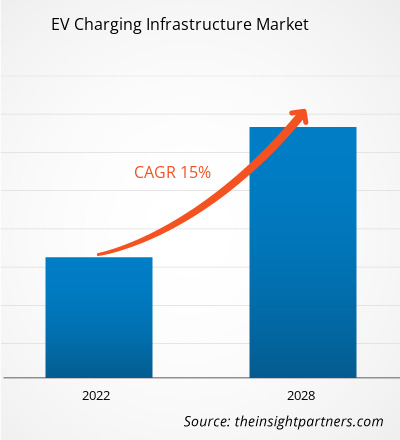
[تقرير بحثي] بلغت قيمة سوق البنية التحتية لشحن السيارات الكهربائية 8.80 مليار دولار أمريكي في عام 2021 ومن المتوقع أن تصل إلى 23.39 مليار دولار أمريكي بحلول عام 2028؛ ومن المتوقع أن ينمو بمعدل نمو سنوي مركب قدره 15.0٪ من عام 2021 إلى عام 2028.
وجهة نظر المحلل:
شهد سوق البنية التحتية لشحن المركبات الكهربائية نموًا وتطورًا كبيرًا في السنوات الأخيرة، مدفوعًا بالتحول العالمي نحو النقل المستدام. ومع إعطاء المزيد من البلدان والحكومات الأولوية لاعتماد المركبات الكهربائية لخفض انبعاثات الغازات المسببة للانحباس الحراري ومكافحة تغير المناخ، فقد ارتفع الطلب على البنية التحتية الموثوقة والفعالة للشحن. تشير البنية التحتية لشحن المركبات الكهربائية إلى شبكة محطات الشحن والتقنيات المرتبطة بها التي تمكن إعادة شحن المركبات الكهربائية . تأتي محطات الشحن هذه بأشكال مختلفة، بما في ذلك محطات الشحن المنزلية ومكان العمل والعامة والسريعة. وهي مصممة لتلبية احتياجات الشحن المختلفة وتوفير الراحة لأصحاب المركبات الكهربائية. أحد المحركات الرئيسية لسوق البنية التحتية لشحن المركبات الكهربائية هو سوق المركبات الكهربائية المتوسع نفسه. مع استمرار نمو مبيعات المركبات الكهربائية، تصبح الحاجة إلى بنية تحتية قوية للشحن أمرًا بالغ الأهمية لدعم العدد المتزايد من المركبات الكهربائية على الطريق.
بالإضافة إلى ذلك، لعبت المبادرات الحكومية والإعانات واللوائح التي تروج لتبني المركبات الكهربائية دورًا مهمًا في تعزيز تطوير البنية التحتية للشحن. وتشارك العديد من الشركات وأصحاب المصلحة بنشاط في سوق البنية التحتية لشحن المركبات الكهربائية. ويشمل ذلك شركات صناعة السيارات الراسخة وشركات الطاقة ومشغلي شبكات الشحن ومقدمي التكنولوجيا. وهم يتعاونون لتطوير حلول شحن مبتكرة وتعزيز سرعات الشحن وتحسين تجربة المستخدم. تعد البنية التحتية للشحن السريع ضرورية للسفر لمسافات طويلة وتقليل قلق المدى، مما يسمح لأصحاب المركبات الكهربائية بإعادة شحن مركباتهم بسرعة أثناء الرحلات الطويلة. علاوة على ذلك، يكتسب دمج مصادر الطاقة المتجددة في البنية التحتية للشحن زخمًا. تساعد محطات الشحن التي تعمل بالطاقة المتجددة في تقليل الانبعاثات الكربونية المرتبطة بالشحن، مما يجعل النظام البيئي للتنقل الكهربائي بشكل عام أكثر استدامة وصديقًا للبيئة.
نظرة عامة على السوق:
محطة شحن السيارات الكهربائية هي قطعة من الأجهزة المستخدمة لتوصيل المكونات الإضافية والمركبات الكهربائية بمصدر كهربائي لإعادة شحنها. تضع الشركات الخاصة أو مزودو المرافق الكهربائية محطات شحن في المناطق العامة مثل مواقف السيارات ومراكز التسوق وغيرها من الأماكن. تعد المقابس ثلاثية الدبابيس ومحطات الشحن العامة وشواحن الصناديق الجدارية السكنية طرقًا بسيطة لإعادة شحن المركبات الكهربائية من الشبكة. ومن المتوقع أن تمكن تقنية المركبات إلى الشبكة (V2G) أصحاب المركبات من إعادة بيع فائض الكهرباء لديهم إلى الشبكة خلال ساعات الذروة في السنوات القادمة.
قم بتخصيص هذا التقرير ليناسب متطلباتك
ستحصل على تخصيص لأي تقرير - مجانًا - بما في ذلك أجزاء من هذا التقرير، أو تحليل على مستوى الدولة، وحزمة بيانات Excel، بالإضافة إلى الاستفادة من العروض والخصومات الرائعة للشركات الناشئة والجامعات
- احصل على أهم اتجاهات السوق الرئيسية لهذا التقرير.ستتضمن هذه العينة المجانية تحليلاً للبيانات، بدءًا من اتجاهات السوق وحتى التقديرات والتوقعات.
محرك السوق:
توسيع سوق المركبات الكهربائية لتعزيز نمو سوق البنية التحتية لشحن المركبات الكهربائية
إن تطوير سوق المركبات الكهربائية هو محرك مهم لنمو سوق البنية التحتية لشحن المركبات الكهربائية. ومع تزايد الحاجة إلى المركبات الكهربائية، يصبح وجود بنية تحتية قوية وواسعة النطاق للشحن أمرًا بالغ الأهمية. هناك العديد من العوامل التي تدفع سوق المركبات الكهربائية المتوسعة. هناك وعي متزايد وقلق بشأن القضايا البيئية، بما في ذلك تغير المناخ وتلوث الهواء. لقد أدى التقدم في تكنولوجيا المركبات الكهربائية، بما في ذلك تحسين سعة البطاريات ومدى القيادة الأطول، إلى تعزيز جاذبية المركبات الكهربائية وعمليتها. مع استمرار تطور تكنولوجيا البطاريات، أصبحت المركبات الكهربائية أكثر تنافسية من حيث الأداء والمدى، مما يعالج مخاوف المشترين المحتملين بشأن مسافات القيادة المحدودة وتوافر الشحن. بالإضافة إلى ذلك، تستثمر شركات صناعة السيارات بكثافة في تطوير نماذج المركبات الكهربائية. يقدم اللاعبون الرئيسيون في صناعة السيارات عددًا متزايدًا من خيارات المركبات الكهربائية عبر مختلف قطاعات المركبات، لتلبية تفضيلات واحتياجات المستهلكين المختلفة. تصبح الحاجة إلى بنية تحتية شاملة للشحن أمرًا بالغ الأهمية مع توسع سوق المركبات الكهربائية. يحتاج مالكو المركبات الكهربائية إلى حلول شحن مريحة وموثوقة لإعادة شحن مركباتهم بسهولة وكفاءة. ويمتد هذا الطلب إلى ما هو أبعد من خيارات الشحن السكنية، حيث يحتاج مالكو السيارات الكهربائية إلى الوصول إلى محطات الشحن في أماكن العمل والأماكن العامة والطرق السريعة لدعم تنقلاتهم اليومية والسفر لمسافات طويلة. ويدرك مزودو البنية التحتية للشحن وشركات الطاقة وأصحاب المصلحة الآخرون أهمية الاستثمار في شبكة الشحن وتوسيعها لتلبية احتياجات أسطول أكبر من السيارات الكهربائية. وهم يتعاونون مع الحكومات وشركات صناعة السيارات وغيرها من الجهات الفاعلة في الصناعة لتطوير حلول شحن قابلة للتطوير وموثوقة ويمكن الوصول إليها على نطاق واسع.
التحليل القطاعي:
بناءً على المنصة، يتم تقسيم سوق البنية التحتية لشحن المركبات الكهربائية إلى أجهزة وخدمات. احتل قطاع الأجهزة أكبر حصة في السوق في عام 2020. وبسبب عدة عوامل، يعد قطاع الأجهزة المساهم الأكبر في سوق البنية التحتية لشحن المركبات الكهربائية. يساهم نشر محطات الشحن في مواقع مختلفة في هيمنته. يشمل القطاع تصنيع وتركيب وصيانة محطات الشحن، والتي تشكل العمود الفقري للبنية التحتية للشحن. تعمل حلول الشحن المتنوعة، بما في ذلك شواحن المستوى 1 و2 والتيار المستمر السريعة، على دفع حصة سوق قطاع الأجهزة. تعمل التطورات التكنولوجية في أجهزة الشحن والعمر الأطول للاستثمارات في البنية التحتية المادية على تعزيز مكانتها. تعكس الحصة السوقية الأكبر لقطاع الأجهزة طبيعته كثيفة رأس المال ودوره المحوري في إنشاء شبكات شحن موثوقة وفعالة.
التحليل الإقليمي:
بلغت قيمة سوق البنية التحتية لشحن المركبات الكهربائية في منطقة آسيا والمحيط الهادئ 3.99 مليار دولار أمريكي في عام 2021 ومن المتوقع أن تصل إلى 10.77 مليار دولار أمريكي بحلول عام 2028؛ ومن المتوقع أن تنمو بمعدل نمو سنوي مركب قدره 15.2٪ خلال الفترة المتوقعة. وقد أسست منطقة آسيا والمحيط الهادئ هيمنتها في سوق البنية التحتية لشحن المركبات الكهربائية من خلال العديد من العوامل الرئيسية التي ساهمت في نموها وحصتها في السوق. وشهدت المنطقة زيادة كبيرة في تبني المركبات الكهربائية، مما يجعلها أكبر وأسرع سوق نموًا للمركبات الكهربائية على مستوى العالم. وقد دفعت دول مثل الصين واليابان وكوريا الجنوبية هذا التبني بدعم حكومي قوي وحوافز وأهداف طموحة للحد من الانبعاثات. وقد خلق سوق المركبات الكهربائية المتنامي هذا طلبًا كبيرًا على البنية التحتية لشحن المركبات الكهربائية، مما أدى إلى هيمنة المنطقة. تستفيد منطقة آسيا والمحيط الهادئ من نظام بيئي تصنيع متطور، وخاصة في دول مثل الصين وكوريا الجنوبية. وقد قامت هذه الدول باستثمارات كبيرة في تصنيع محطات الشحن والكابلات والمكونات ذات الصلة، مما أدى إلى إمداد قوي بالبنية التحتية للشحن بأسعار تنافسية. وقد سهّل ذلك نشر حلول الشحن وزيادة إمكانية الوصول للمستهلكين. وعلاوة على ذلك، التزمت المنطقة بقوة ببناء شبكة شحن شاملة. وكانت الحكومات وأصحاب المصلحة في الصناعة يعملون بنشاط على توسيع البنية التحتية للشحن، بما في ذلك المناطق السكنية والمجمعات التجارية والأماكن العامة وممرات النقل الرئيسية. وتضمن هذه الشبكة الواسعة النطاق الراحة وإمكانية الوصول لأصحاب المركبات الكهربائية، مما يعزز هيمنة المنطقة. كما ساهمت التطورات التكنولوجية والابتكار في هيمنة منطقة آسيا والمحيط الهادئ على السوق. وقد أدى اعتماد محطات الشحن عالية الطاقة وحلول الشحن الذكية واستكشاف التقنيات الناشئة مثل الشحن اللاسلكي إلى تحسين كفاءة وتجربة المستخدم لشحن المركبات الكهربائية. وقد اجتذبت هذه التطورات المزيد من المستهلكين إلى المركبات الكهربائية وعززت الطلب على البنية التحتية للشحن.
بالإضافة إلى ذلك، لعبت الشركات الرائدة والجهات الفاعلة في السوق في المنطقة دورًا مهمًا. فقد استثمرت الشركات المصنعة الآسيوية، بما في ذلك BYD وNIO وHyundai وLG Electronics، بشكل كبير في البنية التحتية للشحن ووسعت نطاق وصولها إلى السوق. وقد ساهمت خبرتها وتقدمها التكنولوجي وحضورها القوي في السوق في نمو سوق البنية التحتية لشحن السيارات الكهربائية في منطقة آسيا والمحيط الهادئ.
تحليل اللاعب الرئيسي:
يتكون تحليل سوق البنية التحتية لشحن السيارات الكهربائية من لاعبين مثل Tritium و Blink Charging Co. و ChargePoint، Inc. و BP plc و EVBox و EVgo Inc. و Tesla، Inc. و Webasto Group و RWE AG و Delta Electronics، Inc. ومن بين اللاعبين في البنية التحتية لشحن السيارات الكهربائية، تعد Tritium و EVBox من أفضل لاعبين نظرًا لمجموعة المنتجات المتنوعة المقدمة.
رؤى إقليمية حول سوق البنية التحتية لشحن السيارات الكهربائية
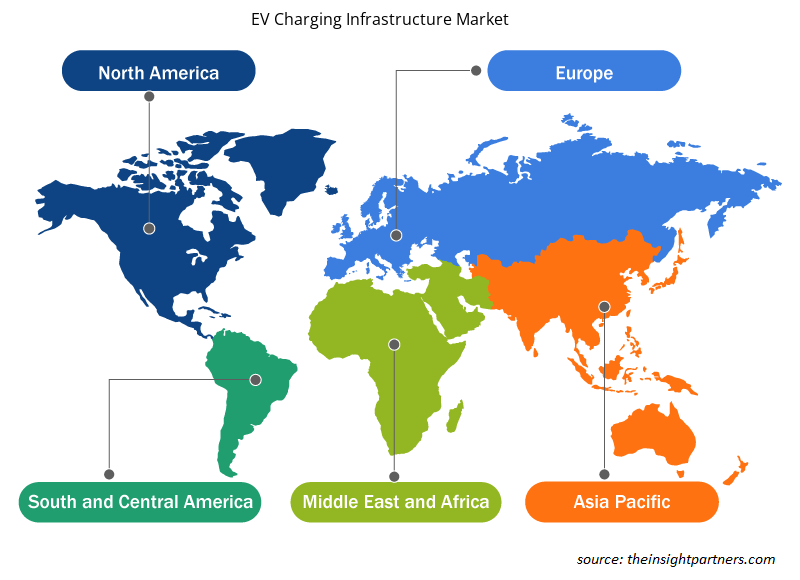
لقد قام المحللون في Insight Partners بشرح الاتجاهات والعوامل الإقليمية المؤثرة على سوق البنية التحتية لشحن المركبات الكهربائية طوال فترة التوقعات بشكل شامل. يناقش هذا القسم أيضًا قطاعات سوق البنية التحتية لشحن المركبات الكهربائية والجغرافيا في جميع أنحاء أمريكا الشمالية وأوروبا ومنطقة آسيا والمحيط الهادئ والشرق الأوسط وأفريقيا وأمريكا الجنوبية والوسطى.

- احصل على البيانات الإقليمية المحددة لسوق البنية التحتية لشحن المركبات الكهربائية
نطاق تقرير سوق البنية التحتية لشحن السيارات الكهربائية
| سمة التقرير | تفاصيل |
|---|---|
| حجم السوق في عام 2021 | 8.8 مليار دولار أمريكي |
| حجم السوق بحلول عام 2028 | 23.39 مليار دولار أمريكي |
| معدل النمو السنوي المركب العالمي (2021 - 2028) | 15.0% |
| البيانات التاريخية | 2019-2020 |
| فترة التنبؤ | 2022-2028 |
| القطاعات المغطاة | حسب المنصة
|
| المناطق والدول المغطاة | أمريكا الشمالية
|
| قادة السوق وملفات تعريف الشركات الرئيسية |
|
كثافة اللاعبين في سوق البنية التحتية لشحن المركبات الكهربائية: فهم تأثيرها على ديناميكيات الأعمال
يشهد سوق البنية التحتية لشحن المركبات الكهربائية نموًا سريعًا، مدفوعًا بالطلب المتزايد من المستخدم النهائي بسبب عوامل مثل تفضيلات المستهلكين المتطورة والتقدم التكنولوجي والوعي الأكبر بفوائد المنتج. ومع ارتفاع الطلب، تعمل الشركات على توسيع عروضها والابتكار لتلبية احتياجات المستهلكين والاستفادة من الاتجاهات الناشئة، مما يؤدي إلى زيادة نمو السوق.
تشير كثافة اللاعبين في السوق إلى توزيع الشركات أو المؤسسات العاملة في سوق أو صناعة معينة. وهي تشير إلى عدد المنافسين (اللاعبين في السوق) الموجودين في مساحة سوق معينة نسبة إلى حجمها أو قيمتها السوقية الإجمالية.
الشركات الرئيسية العاملة في سوق البنية التحتية لشحن المركبات الكهربائية هي:
- دي
إخلاء المسؤولية : الشركات المذكورة أعلاه ليست مرتبة بأي ترتيب معين.

- احصل على نظرة عامة على أهم اللاعبين الرئيسيين في سوق البنية التحتية لشحن المركبات الكهربائية
التطورات الأخيرة:
تتبنى الشركات العاملة في سوق البنية التحتية لشحن المركبات الكهربائية بشكل كبير الاستراتيجيات غير العضوية والعضوية مثل عمليات الدمج والاستحواذ. وفيما يلي بعض التطورات الرئيسية الأخيرة في السوق:
- في نوفمبر 2022، وقعت شركة يولو مذكرة تفاهم مع حكومة كارناتاكا وأعلنت عن خططها لاستثمار 12 مليار روبية هندية في نشر أسطول من 100 ألف سيارة كهربائية وتشغيل أكبر بنية تحتية لشحن وتبديل بطاريات السيارات الكهربائية في الولاية على مدى السنوات الخمس المقبلة.
- في أكتوبر 2022، أعلنت حكومة لوكسمبورج عن اختيار 29 مشروعًا في أعقاب الدعوة الأولى للمشاريع التي تمنح مساعدات مالية للشركات التي تستثمر في مشاريع البنية التحتية لشحن المركبات الكهربائية. وستحصل الشركات المعنية على إعانة تصل إلى 50% على الاستثمارات المتعلقة بنشر محطات الشحن بسعة شحن لا تقل عن 175 كيلووات.
- التحليل التاريخي (سنتان)، السنة الأساسية، التوقعات (7 سنوات) مع معدل النمو السنوي المركب
- تحليل PEST و SWOT
- حجم السوق والقيمة / الحجم - عالميًا وإقليميًا وقطريًا
- الصناعة والمنافسة
- مجموعة بيانات Excel


- Aircraft Wire and Cable Market
- Virtual Production Market
- Quantitative Structure-Activity Relationship (QSAR) Market
- Predictive Maintenance Market
- Blood Collection Devices Market
- Procedure Trays Market
- Power Bank Market
- Electronic Data Interchange Market
- Truck Refrigeration Market
- Vision Guided Robotics Software Market

Report Coverage
Revenue forecast, Company Analysis, Industry landscape, Growth factors, and Trends

Segment Covered
This text is related
to segments covered.

Regional Scope
North America, Europe, Asia Pacific, Middle East & Africa, South & Central America

Country Scope
This text is related
to country scope.
الأسئلة الشائعة
Asia Pacific dominated the EV charging infrastructure market in 2020 with a share of 45.2% and is expected to continue its dominance by 2028. Europe is the second-largest contributor to the global EV charging infrastructure market in 2020, followed by North America.
The major companies in EV charging infrastructure market are Tritium; Blink Charging Co; ChargePoint, Inc.; BP p.l.c.; EVBox; EVgo Inc.; Tesla, Inc.; Webasto Group; RWE AG; and Delta Electronics, Inc.
The IEC Mode in EV charging infrastructure includes 2, 3, and 4. In terms of market share, the market was dominated by the 3 segment in 2020.
Based on platform, the global EV charging infrastructure market is segmented into hardware, and services. The EV charging infrastructure market was dominated by the hardware segment in 2020.
The rising concern of the transportation sector's impact on the environment has led to an unprecedented global requirement of decarbonizing transportation to meet climate goals and limit global warming, thereby increasing the adoption of low carbon technology in the transportation sector. The rising concerns for the adverse impact of transportation-related emissions and shift of consumer behavior toward zero-emission vehicles have resulted in a significant increase in the adoption of light-duty passenger vehicles across the globe, especially in strong economies, such as the US, China, and the European Union. The global share of new passenger EVs has risen at an average of nearly 50% per year since 2015. In 2021, the sales of electric vehicles surged by 160% in these top three markets. Notably, China has the largest fleet of electric vehicles globally, with 4.5 million electric cars, and Europe witnessed the largest annual increase to reach a total of 3.2 million electric passenger vehicles.
Presently, EV charging stations are more common in private residences. However, the rising consumer demand has led to an active adoption of on-site commercial charging as a standard building feature. China, the EU-27 plus the UK, and the US, are expected to implement charging in residential and commercial buildings to scale up the EV charging infrastructure in the near future, which requires upgrading buildings' electrical infrastructure to satisfy the rising demand for EV charging. Additionally, EV charging at scale is subject to the careful planning of a building's electrical distribution system, along with the local electric-grid infrastructure. To enhance the accessibility and affordability of electric chargers, a large number of building developers, urban planners, and electrical-equipment suppliers are actively integrating the EV charging infrastructure into standard building design plans.
Trends and growth analysis reports related to Automotive and Transportation : READ MORE..
The List of Companies - EV Charging Infrastructure Market
- De’Longhi Appliances S.r.l.
- The Whirlpool Corporation
- Koninklijke Philips N.V.
- Breville
- SMEG S.p.A.
- Hobart
- Ankarsrum Kitchen AB
- Wonderchef Home Appliances Pvt. Ltd.
- Kenwood Limited
- Hamilton Beach Brands, Inc.
The Insight Partners performs research in 4 major stages: Data Collection & Secondary Research, Primary Research, Data Analysis and Data Triangulation & Final Review.
- Data Collection and Secondary Research:
As a market research and consulting firm operating from a decade, we have published and advised several client across the globe. First step for any study will start with an assessment of currently available data and insights from existing reports. Further, historical and current market information is collected from Investor Presentations, Annual Reports, SEC Filings, etc., and other information related to company’s performance and market positioning are gathered from Paid Databases (Factiva, Hoovers, and Reuters) and various other publications available in public domain.
Several associations trade associates, technical forums, institutes, societies and organization are accessed to gain technical as well as market related insights through their publications such as research papers, blogs and press releases related to the studies are referred to get cues about the market. Further, white papers, journals, magazines, and other news articles published in last 3 years are scrutinized and analyzed to understand the current market trends.
- Primary Research:
The primarily interview analysis comprise of data obtained from industry participants interview and answers to survey questions gathered by in-house primary team.
For primary research, interviews are conducted with industry experts/CEOs/Marketing Managers/VPs/Subject Matter Experts from both demand and supply side to get a 360-degree view of the market. The primary team conducts several interviews based on the complexity of the markets to understand the various market trends and dynamics which makes research more credible and precise.
A typical research interview fulfils the following functions:
- Provides first-hand information on the market size, market trends, growth trends, competitive landscape, and outlook
- Validates and strengthens in-house secondary research findings
- Develops the analysis team’s expertise and market understanding
Primary research involves email interactions and telephone interviews for each market, category, segment, and sub-segment across geographies. The participants who typically take part in such a process include, but are not limited to:
- Industry participants: VPs, business development managers, market intelligence managers and national sales managers
- Outside experts: Valuation experts, research analysts and key opinion leaders specializing in the electronics and semiconductor industry.
Below is the breakup of our primary respondents by company, designation, and region:

Once we receive the confirmation from primary research sources or primary respondents, we finalize the base year market estimation and forecast the data as per the macroeconomic and microeconomic factors assessed during data collection.
- Data Analysis:
Once data is validated through both secondary as well as primary respondents, we finalize the market estimations by hypothesis formulation and factor analysis at regional and country level.
- Macro-Economic Factor Analysis:
We analyse macroeconomic indicators such the gross domestic product (GDP), increase in the demand for goods and services across industries, technological advancement, regional economic growth, governmental policies, the influence of COVID-19, PEST analysis, and other aspects. This analysis aids in setting benchmarks for various nations/regions and approximating market splits. Additionally, the general trend of the aforementioned components aid in determining the market's development possibilities.
- Country Level Data:
Various factors that are especially aligned to the country are taken into account to determine the market size for a certain area and country, including the presence of vendors, such as headquarters and offices, the country's GDP, demand patterns, and industry growth. To comprehend the market dynamics for the nation, a number of growth variables, inhibitors, application areas, and current market trends are researched. The aforementioned elements aid in determining the country's overall market's growth potential.
- Company Profile:
The “Table of Contents” is formulated by listing and analyzing more than 25 - 30 companies operating in the market ecosystem across geographies. However, we profile only 10 companies as a standard practice in our syndicate reports. These 10 companies comprise leading, emerging, and regional players. Nonetheless, our analysis is not restricted to the 10 listed companies, we also analyze other companies present in the market to develop a holistic view and understand the prevailing trends. The “Company Profiles” section in the report covers key facts, business description, products & services, financial information, SWOT analysis, and key developments. The financial information presented is extracted from the annual reports and official documents of the publicly listed companies. Upon collecting the information for the sections of respective companies, we verify them via various primary sources and then compile the data in respective company profiles. The company level information helps us in deriving the base number as well as in forecasting the market size.
- Developing Base Number:
Aggregation of sales statistics (2020-2022) and macro-economic factor, and other secondary and primary research insights are utilized to arrive at base number and related market shares for 2022. The data gaps are identified in this step and relevant market data is analyzed, collected from paid primary interviews or databases. On finalizing the base year market size, forecasts are developed on the basis of macro-economic, industry and market growth factors and company level analysis.
- Data Triangulation and Final Review:
The market findings and base year market size calculations are validated from supply as well as demand side. Demand side validations are based on macro-economic factor analysis and benchmarks for respective regions and countries. In case of supply side validations, revenues of major companies are estimated (in case not available) based on industry benchmark, approximate number of employees, product portfolio, and primary interviews revenues are gathered. Further revenue from target product/service segment is assessed to avoid overshooting of market statistics. In case of heavy deviations between supply and demand side values, all thes steps are repeated to achieve synchronization.
We follow an iterative model, wherein we share our research findings with Subject Matter Experts (SME’s) and Key Opinion Leaders (KOLs) until consensus view of the market is not formulated – this model negates any drastic deviation in the opinions of experts. Only validated and universally acceptable research findings are quoted in our reports.
We have important check points that we use to validate our research findings – which we call – data triangulation, where we validate the information, we generate from secondary sources with primary interviews and then we re-validate with our internal data bases and Subject matter experts. This comprehensive model enables us to deliver high quality, reliable data in shortest possible time.


 احصل على عينة مجانية لهذا التقرير