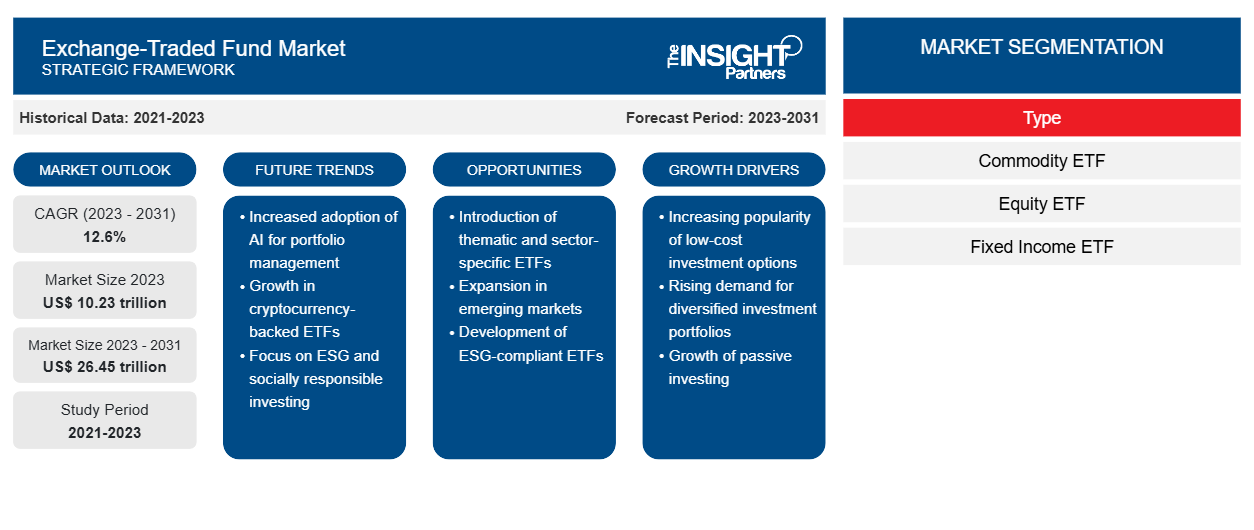
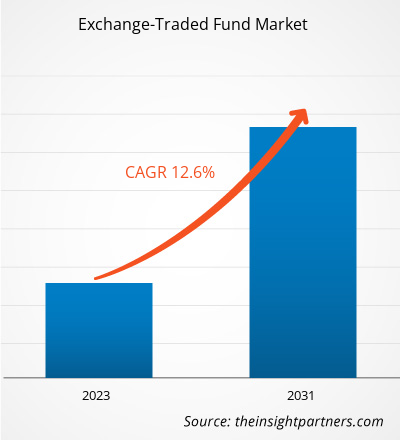
من المتوقع أن ينمو حجم سوق صناديق الاستثمار المتداولة في البورصة من 10.23 تريليون دولار أمريكي في عام 2023 إلى 26.45 تريليون دولار أمريكي بحلول عام 2031؛ ومن المتوقع أن يتوسع بمعدل نمو سنوي مركب قدره 12.6٪ من عام 2023 إلى عام 2031. ومن المتوقع أن توفر الشعبية المتزايدة لصناديق الاستثمار المتداولة في البورصة فرص نمو عالية.
تحليل سوق الصناديق المتداولة في البورصة
تشكل صناديق الاستثمار المتداولة في البورصة نسبة صغيرة من إجمالي السوق المالية العالمية في كل من الدخل الثابت والأسهم، تتراوح من 0.4% إلى 3.0% من أصول الدخل الثابت و4% إلى 15% من الأسهم حسب المنطقة. تشمل مزايا صناديق الاستثمار المتداولة على صناديق الاستثمار المشتركة انخفاض التكاليف، واحتمال تتبع أداء السوق بالكامل بدلاً من الاستثمار في أسهم فردية، ومن الناحية النظرية نتائج استثمارية أفضل، حيث يميل مديرو الصناديق النشطون إلى الأداء دون أداء السوق. أدت هذه المزايا إلى زيادة كبيرة في عدد هذه الصناديق في جميع أنحاء العالم، حيث نمت بنسبة مذهلة بلغت حوالي 3000% منذ عام 2003، مما دفع نمو سوق صناديق الاستثمار المتداولة في البورصة.
قم بتخصيص هذا التقرير ليناسب متطلباتك
ستحصل على تخصيص لأي تقرير - مجانًا - بما في ذلك أجزاء من هذا التقرير، أو تحليل على مستوى الدولة، وحزمة بيانات Excel، بالإضافة إلى الاستفادة من العروض والخصومات الرائعة للشركات الناشئة والجامعات
- احصل على أهم اتجاهات السوق الرئيسية لهذا التقرير.ستتضمن هذه العينة المجانية تحليلاً للبيانات، بدءًا من اتجاهات السوق وحتى التقديرات والتوقعات.
صندوق التداول في البورصة
نظرة عامة على الصناعة
- الصندوق المتداول في البورصة هو نوع من الأوراق المالية الاستثمارية المجمعة التي يمكن شراؤها وبيعها مثل الأسهم الفردية. والفرق الرئيسي بين الصندوق المتداول في البورصة والصندوق المشترك هو أنه على الرغم من أن الصندوق المشترك هو أيضًا استثمار مجمع، إلا أنه يتم تداوله مرة واحدة فقط في اليوم بعد إغلاق السوق.
- كان أول صندوق متداول في البورصة هو SPDR S&P 500 ETF (SPY)، والذي يتتبع مؤشر S&P 500 ولا يزال صندوقًا متداولًا في البورصة شائعًا بين المستثمرين والتجار اليوم.
محركات وفرص سوق صناديق الاستثمار المتداولة
التحول من الإقراض التقليدي إلى الصناديق المتداولة في البورصة لتحريك سوق الصناديق المتداولة في البورصة
- تشتهر صناديق الاستثمار المتداولة بخيارات السيولة السهلة التي توفرها. تُعَد السيولة جانبًا لا غنى عنه في الاستثمار، حيث توفر للمستثمرين إمكانية الشراء والبيع بسهولة. وفيما يتعلق بصناديق الاستثمار المتداولة، فإن السيولة لها أهمية كبيرة.
- تشير سيولة الصناديق المتداولة في البورصة إلى السهولة التي يستطيع بها المستثمرون تداول أو تبادل هذه الصناديق. وتعتبر هذه الصناديق سلال أصول متعددة الأوجه. وبالتالي، كلما زادت سيولة كل أصل أساسي يشكل صندوقًا متداولًا في البورصة، كلما كان من الأسهل استرداد الصندوق المتداول في البورصة بالكامل.
- تتميز صناديق الاستثمار المتداولة في البورصة بعنصرين للسيولة - سيولة الأصول الأساسية وسيولة الصناديق المتداولة في البورصة. ونظرًا لإجراءات الاسترداد/الإنشاء المعقدة، فإن معظم صناديق الاستثمار المتداولة في البورصة تقيس سيولتها في إشارة إلى أصولها الأساسية وقد تشمل السندات والأسهم والذهب وما إلى ذلك.
صندوق التداول في البورصة
تحليل تجزئة تقرير السوق
- اعتمادًا على النوع، يتم تقسيم سوق صناديق الاستثمار المتداولة إلى صناديق الاستثمار المتداولة في السلع الأساسية، وصناديق الاستثمار المتداولة في الأسهم، وصناديق الاستثمار المتداولة في الدخل الثابت، وصناديق الاستثمار المتداولة في العقارات، وغيرها.
- من المتوقع أن يستحوذ قطاع صناديق الاستثمار المتداولة في البورصة على حصة كبيرة في سوق صناديق الاستثمار المتداولة في البورصة في عام 2023. وهي عبارة عن منتجات استثمارية بسيطة تجمع بين مرونة الاستثمار في الأسهم وبساطة صناديق الاستثمار المشتركة في الأسهم. وتتداول صناديق الاستثمار المتداولة في البورصة في سوق الأوراق المالية النقدية، على غرار أي سهم آخر، ويمكن شراؤها وبيعها باستمرار بأسعار السوق. وهي أدوات استثمارية سلبية، تستند إلى المؤشرات وتستثمر في الأوراق المالية بنفس نسبة المؤشر الأصلي. وبسبب خاصية عكس المؤشر، هناك شفافية كاملة فيما يتعلق بممتلكات صندوق الاستثمار المتداول في البورصة. وعلاوة على ذلك، نظرًا لبنيتها المميزة وآلية إنشائها، فإن صناديق الاستثمار المتداولة في البورصة لديها نسب مصاريف أقل بكثير مقارنة بصناديق الاستثمار المشتركة. ومن المتوقع أن تعزز هذه المزايا نمو سوق صناديق الاستثمار المتداولة في البورصة.
صندوق التداول في البورصة
تحليل حصة السوق حسب المنطقة الجغرافية
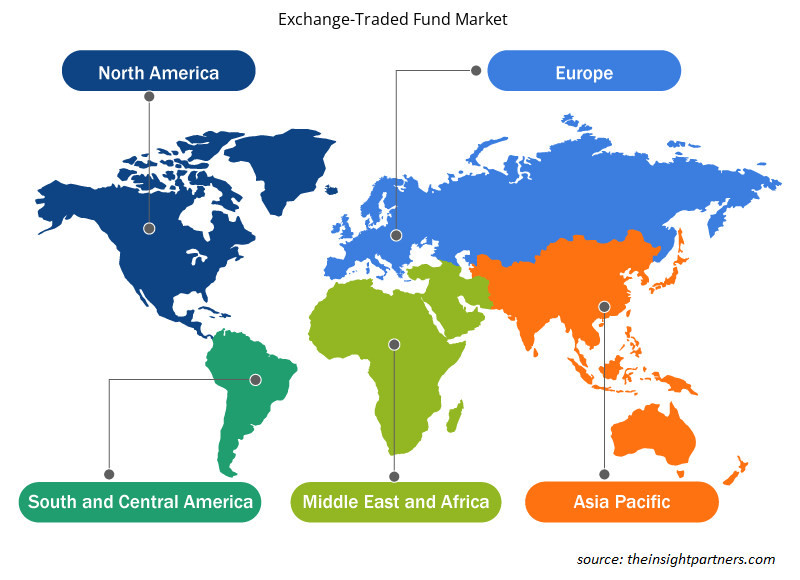
ينقسم نطاق تقرير سوق صناديق الاستثمار المتداولة في البورصة بشكل أساسي إلى خمس مناطق - أمريكا الشمالية وأوروبا وآسيا والمحيط الهادئ والشرق الأوسط وأفريقيا وأمريكا الجنوبية. تشهد منطقة آسيا والمحيط الهادئ نموًا سريعًا، ولكن من المتوقع أن تحتفظ أمريكا الشمالية بأكبر حصة في سوق صناديق الاستثمار المتداولة في البورصة. لقد قدم التطور الاقتصادي الكبير في منطقة آسيا والمحيط الهادئ والاهتمام المتزايد بالتداول فرصًا كبيرة لصناديق الاستثمار المتداولة في البورصة للتوسع.
صندوق التداول في البورصة
نظرة إقليمية على سوق صناديق الاستثمار المتداولة
لقد قام المحللون في Insight Partners بشرح الاتجاهات والعوامل الإقليمية المؤثرة على سوق الصناديق المتداولة في البورصة طوال فترة التوقعات بشكل شامل. كما يناقش هذا القسم أيضًا قطاعات سوق الصناديق المتداولة في البورصة والجغرافيا في جميع أنحاء أمريكا الشمالية وأوروبا ومنطقة آسيا والمحيط الهادئ والشرق الأوسط وأفريقيا وأمريكا الجنوبية والوسطى.

- احصل على البيانات الإقليمية المحددة لسوق صناديق الاستثمار المتداولة
نطاق تقرير سوق الصناديق المتداولة في البورصة
| سمة التقرير | تفاصيل |
|---|---|
| حجم السوق في عام 2023 | 10.23 تريليون دولار أمريكي |
| حجم السوق بحلول عام 2031 | 26.45 تريليون دولار أمريكي |
| معدل النمو السنوي المركب العالمي (2023 - 2031) | 12.6% |
| البيانات التاريخية | 2021-2023 |
| فترة التنبؤ | 2023-2031 |
| القطاعات المغطاة | حسب النوع
|
| المناطق والدول المغطاة | أمريكا الشمالية
|
| قادة السوق وملفات تعريف الشركات الرئيسية |
|
كثافة اللاعبين في سوق صناديق الاستثمار المتداولة: فهم تأثيرها على ديناميكيات الأعمال
يشهد سوق صناديق الاستثمار المتداولة نموًا سريعًا، مدفوعًا بالطلب المتزايد من جانب المستخدم النهائي بسبب عوامل مثل تفضيلات المستهلكين المتطورة والتقدم التكنولوجي والوعي المتزايد بفوائد المنتج. ومع ارتفاع الطلب، تعمل الشركات على توسيع عروضها والابتكار لتلبية احتياجات المستهلكين والاستفادة من الاتجاهات الناشئة، مما يؤدي إلى زيادة نمو السوق.
تشير كثافة اللاعبين في السوق إلى توزيع الشركات أو المؤسسات العاملة في سوق أو صناعة معينة. وهي تشير إلى عدد المنافسين (اللاعبين في السوق) الموجودين في مساحة سوق معينة نسبة إلى حجمها أو قيمتها السوقية الإجمالية.
الشركات الرئيسية العاملة في سوق صناديق الاستثمار المتداولة هي:
- مجموعة أليانز
- شركة بلاك روك
- مؤسسة بي إن واي ميلون
- شركة فيديليتي للاستثمارات
- جولدمان ساكس
إخلاء المسؤولية : الشركات المذكورة أعلاه ليست مرتبة بأي ترتيب معين.

- احصل على نظرة عامة على أهم اللاعبين الرئيسيين في سوق الصناديق المتداولة في البورصة
"تحليل سوق صناديق الاستثمار المتداولة"تم إجراء التقييم على أساس النوع والجغرافيا. من حيث النوع، يتم تقسيم السوق إلى صناديق السلع المتداولة، وصناديق الأسهم المتداولة، وصناديق الدخل الثابت المتداولة، وصناديق العقارات المتداولة، وغيرها. بناءً على الجغرافيا، يتم تقسيم السوق إلى أمريكا الشمالية وأوروبا ومنطقة آسيا والمحيط الهادئ والشرق الأوسط وأفريقيا وأمريكا الجنوبية.
صندوق التداول في البورصة
أخبار السوق والتطورات الأخيرة
تتبنى الشركات استراتيجيات غير عضوية وعضوية مثل عمليات الدمج والاستحواذ في سوق صناديق الاستثمار المتداولة في البورصة. وفيما يلي بعض التطورات الرئيسية التي شهدتها السوق مؤخرًا:
- في مارس 2024، أعلن مدير الأصول VanEck عن التنازل عن رسوم الرعاية الخاصة به لـ VanEck Bitcoin Trust (HODL)، والذي يوفر التعرض لعملة البيتكوين الفورية، اعتبارًا من الآن. يوضح هذا التعديل التزام VanEck بتقديم قيمة معززة للمستثمرين، بما في ذلك من خلال التسعير التنافسي. خلال الفترة التي تبدأ في 12 مارس 2024 وتنتهي في 31 مارس 2025، سيتم التنازل عن رسوم الرعاية بالكامل لأول 1.5 مليار دولار أمريكي من أصول الصندوق. إذا تجاوزت أصول الصندوق 1.5 مليار دولار أمريكي قبل 31 مارس 2025، فستكون الرسوم على الأصول التي تزيد عن 1.5 مليار دولار أمريكي 0.20٪. سيتحمل جميع المستثمرين نفس رسوم الرعاية، والتي تمثل المتوسط المرجح لمعدلات الرسوم هذه. بعد 31 مارس 2025، ستكون رسوم الرعاية 0.20٪.
[المصدر: VanEck، موقع الشركة على الويب]
- في مارس 2024، تقدمت شركة إدارة الأصول الرقمية Grayscale Investments بطلب لفصل صندوقها المتداول في البورصة للبيتكوين، Grayscale Bitcoin Trust (GBTC). يعد الفصل جزءًا من محاولة لتقديم تعرض أقل رسومًا للمستثمرين للبيتكوين. تقدمت Grayscale بطلب لإدراج أسهم منتج استثماري جديد، Grayscale Bitcoin Mini Trust، والذي سيتلقى كمية معينة من البيتكوين التي تحتفظ بها GBTC. في المقابل، سيحصل مساهمو GBTC الحاليون على أسهم في Mini Trust.
[المصدر: Grayscale، موقع الشركة]
صندوق التداول في البورصة
تغطية تقرير السوق والمنتجات النهائية
يقدم تقرير السوق حول "حجم سوق صناديق الاستثمار المتداولة في البورصة والتوقعات (2021-2031)" تحليلاً مفصلاً للسوق يغطي المجالات التالية-
- حجم السوق والتوقعات على المستوى العالمي والإقليمي وعلى مستوى الدولة لجميع قطاعات السوق الرئيسية المشمولة بالنطاق.
- ديناميكيات السوق مثل المحركات والقيود والفرص الرئيسية.
- الاتجاهات المستقبلية الرئيسية.
- تحليل مفصل لـ PEST و SWOT
- تحليل السوق العالمي والإقليمي يغطي اتجاهات السوق الرئيسية، واللاعبين الرئيسيين، واللوائح، والتطورات الأخيرة في السوق.
- تحليل المشهد الصناعي والمنافسة الذي يغطي تركيز السوق، وتحليل الخريطة الحرارية، واللاعبين الرئيسيين، والتطورات الأخيرة.
- ملفات تعريفية مفصلة للشركة.
- Historical Analysis (2 Years), Base Year, Forecast (7 Years) with CAGR
- PEST and SWOT Analysis
- Market Size Value / Volume - Global, Regional, Country
- Industry and Competitive Landscape
- Excel Dataset

Report Coverage
Revenue forecast, Company Analysis, Industry landscape, Growth factors, and Trends

Segment Covered
This text is related
to segments covered.

Regional Scope
North America, Europe, Asia Pacific, Middle East & Africa, South & Central America

Country Scope
This text is related
to country scope.
Frequently Asked Questions
The key players holding majority shares in the market are BlackRock Inc, Fidelity Investments Inc, Goldman Sachs, JPMorgan Chase and Co, and The Vanguard Group.
The market is expected to reach US$ 26.45 trillion by 2030.
The global market was estimated to be US$ 10.23 trillion in 2023 and is expected to grow at a CAGR of 12.6 % during the forecast period 2023 - 2031.
The growth of bond exchange-traded funds is anticipated to play a significant role in the global market in the coming years.
Rising demand for easily liquifiable fund options for choosing varied assets for fund allocation are the major factors that propel the market.
Trends and growth analysis reports related to Banking, Financial Services, and Insurance : READ MORE..
- Allianz Group
- BlackRock Inc
- BNY Mellon Corporation
- Fidelity Investments Inc
- Goldman Sachs
- JPMorgan Chase and Co
- Mirae Asset Securities Co Ltd
- Morgan Stanley
- The Vanguard Group
- UBS Group
The Insight Partners performs research in 4 major stages: Data Collection & Secondary Research, Primary Research, Data Analysis and Data Triangulation & Final Review.
- Data Collection and Secondary Research:
As a market research and consulting firm operating from a decade, we have published and advised several client across the globe. First step for any study will start with an assessment of currently available data and insights from existing reports. Further, historical and current market information is collected from Investor Presentations, Annual Reports, SEC Filings, etc., and other information related to company’s performance and market positioning are gathered from Paid Databases (Factiva, Hoovers, and Reuters) and various other publications available in public domain.
Several associations trade associates, technical forums, institutes, societies and organization are accessed to gain technical as well as market related insights through their publications such as research papers, blogs and press releases related to the studies are referred to get cues about the market. Further, white papers, journals, magazines, and other news articles published in last 3 years are scrutinized and analyzed to understand the current market trends.
- Primary Research:
The primarily interview analysis comprise of data obtained from industry participants interview and answers to survey questions gathered by in-house primary team.
For primary research, interviews are conducted with industry experts/CEOs/Marketing Managers/VPs/Subject Matter Experts from both demand and supply side to get a 360-degree view of the market. The primary team conducts several interviews based on the complexity of the markets to understand the various market trends and dynamics which makes research more credible and precise.
A typical research interview fulfils the following functions:
- Provides first-hand information on the market size, market trends, growth trends, competitive landscape, and outlook
- Validates and strengthens in-house secondary research findings
- Develops the analysis team’s expertise and market understanding
Primary research involves email interactions and telephone interviews for each market, category, segment, and sub-segment across geographies. The participants who typically take part in such a process include, but are not limited to:
- Industry participants: VPs, business development managers, market intelligence managers and national sales managers
- Outside experts: Valuation experts, research analysts and key opinion leaders specializing in the electronics and semiconductor industry.
Below is the breakup of our primary respondents by company, designation, and region:

Once we receive the confirmation from primary research sources or primary respondents, we finalize the base year market estimation and forecast the data as per the macroeconomic and microeconomic factors assessed during data collection.
- Data Analysis:
Once data is validated through both secondary as well as primary respondents, we finalize the market estimations by hypothesis formulation and factor analysis at regional and country level.
- Macro-Economic Factor Analysis:
We analyse macroeconomic indicators such the gross domestic product (GDP), increase in the demand for goods and services across industries, technological advancement, regional economic growth, governmental policies, the influence of COVID-19, PEST analysis, and other aspects. This analysis aids in setting benchmarks for various nations/regions and approximating market splits. Additionally, the general trend of the aforementioned components aid in determining the market's development possibilities.
- Country Level Data:
Various factors that are especially aligned to the country are taken into account to determine the market size for a certain area and country, including the presence of vendors, such as headquarters and offices, the country's GDP, demand patterns, and industry growth. To comprehend the market dynamics for the nation, a number of growth variables, inhibitors, application areas, and current market trends are researched. The aforementioned elements aid in determining the country's overall market's growth potential.
- Company Profile:
The “Table of Contents” is formulated by listing and analyzing more than 25 - 30 companies operating in the market ecosystem across geographies. However, we profile only 10 companies as a standard practice in our syndicate reports. These 10 companies comprise leading, emerging, and regional players. Nonetheless, our analysis is not restricted to the 10 listed companies, we also analyze other companies present in the market to develop a holistic view and understand the prevailing trends. The “Company Profiles” section in the report covers key facts, business description, products & services, financial information, SWOT analysis, and key developments. The financial information presented is extracted from the annual reports and official documents of the publicly listed companies. Upon collecting the information for the sections of respective companies, we verify them via various primary sources and then compile the data in respective company profiles. The company level information helps us in deriving the base number as well as in forecasting the market size.
- Developing Base Number:
Aggregation of sales statistics (2020-2022) and macro-economic factor, and other secondary and primary research insights are utilized to arrive at base number and related market shares for 2022. The data gaps are identified in this step and relevant market data is analyzed, collected from paid primary interviews or databases. On finalizing the base year market size, forecasts are developed on the basis of macro-economic, industry and market growth factors and company level analysis.
- Data Triangulation and Final Review:
The market findings and base year market size calculations are validated from supply as well as demand side. Demand side validations are based on macro-economic factor analysis and benchmarks for respective regions and countries. In case of supply side validations, revenues of major companies are estimated (in case not available) based on industry benchmark, approximate number of employees, product portfolio, and primary interviews revenues are gathered. Further revenue from target product/service segment is assessed to avoid overshooting of market statistics. In case of heavy deviations between supply and demand side values, all thes steps are repeated to achieve synchronization.
We follow an iterative model, wherein we share our research findings with Subject Matter Experts (SME’s) and Key Opinion Leaders (KOLs) until consensus view of the market is not formulated – this model negates any drastic deviation in the opinions of experts. Only validated and universally acceptable research findings are quoted in our reports.
We have important check points that we use to validate our research findings – which we call – data triangulation, where we validate the information, we generate from secondary sources with primary interviews and then we re-validate with our internal data bases and Subject matter experts. This comprehensive model enables us to deliver high quality, reliable data in shortest possible time.


 Get Free Sample For