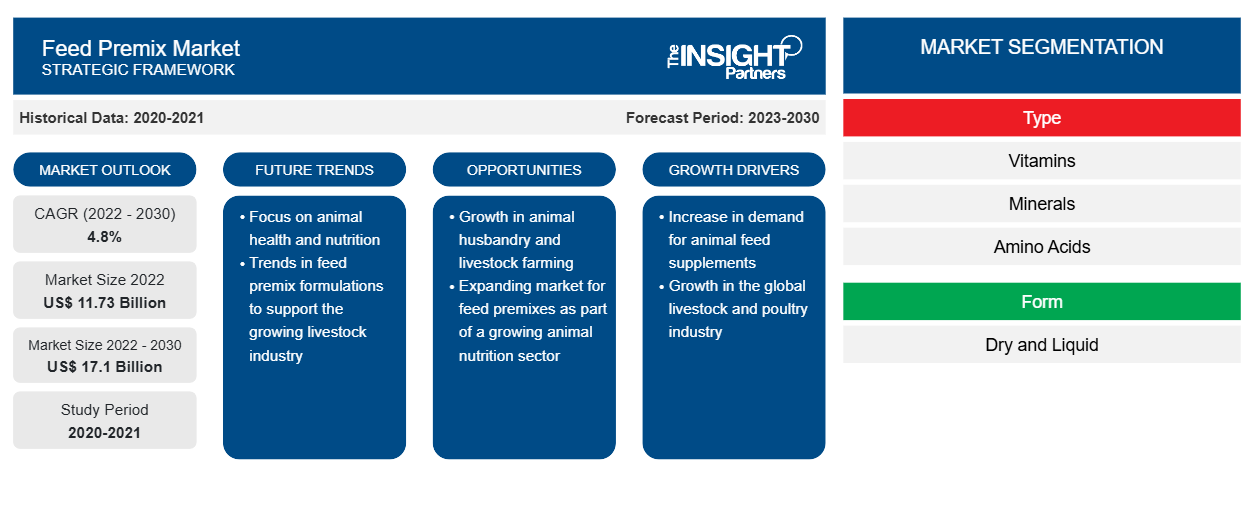
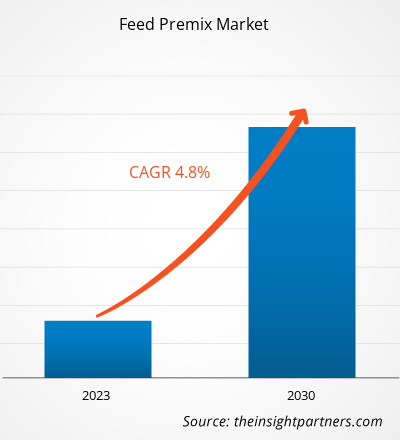
[تقرير بحثي] من المتوقع أن ينمو حجم سوق الخلطات العلفية من 11,732.50 مليون دولار أمريكي في عام 2022 إلى 17,101.04 مليون دولار أمريكي بحلول عام 2030. ومن المتوقع أن يسجل السوق معدل نمو سنوي مركب بنسبة 4.8٪ من عام 2022 إلى عام 2030.
رؤى السوق ووجهة نظر المحلل:
يُعد خليط الأعلاف المسبق مزيجًا معقدًا من مادة أو أكثر من المواد المضافة إلى الأعلاف أو المغذيات مثل الأحماض الأمينية والفيتامينات والمعادن ومضادات الأكسدة والمضادات الحيوية. يتم خلط هذه الخلطات المسبقة في مواد العلف لتعزيز الجودة الغذائية للأعلاف الحيوانية وتوفير المغذيات الدقيقة الأساسية للحيوانات. يتزايد الطلب على الخلطات المسبقة للأعلاف في جميع أنحاء العالم بشكل كبير بسبب الطلب المتزايد على الأعلاف الحيوانية المركبة والوعي المتزايد بشأن سلامة حيوانات الماشية. ساهمت هذه العوامل بشكل كبير في نمو سوق الخلطات المسبقة للأعلاف العالمية
محركات النمو والتحديات:
لقد خضع إنتاج الثروة الحيوانية الصناعي لتحول كبير بسبب الطلب المتزايد على المنتجات القائمة على اللحوم ومنتجات الألبان. تمثل البروتينات الحيوانية 16٪ من الطاقة و 34٪ من البروتين في النظام الغذائي البشري. كما يمثل إنتاج الثروة الحيوانية حوالي 19٪ من قيمة إنتاج الغذاء و 30٪ من القيمة العالمية للزراعة. الطلب على منتجات الثروة الحيوانية مدفوع بأنماط الحياة المتغيرة وتفضيلات الطعام، وزيادة التحضر، ونمو الدخل، والارتفاع السريع في عدد سكان العالم. تساهم هذه العوامل بشكل كبير في نمو سوق الأعلاف الجاهزة في جميع أنحاء العالم. علاوة على ذلك، مع الطلب المتزايد على الثروة الحيوانية، يتزايد استهلاك منتجات اللحوم الغنية بالبروتين. وبالتالي، فإن الاستهلاك المتزايد لمنتجات الثروة الحيوانية، مثل اللحوم، وزيادة إنتاج الحليب شجع الشركات المصنعة على التركيز على توفير أعلاف عالية الجودة وغنية بالمغذيات للماشية. هذا يدفع الطلب على الأعلاف الجاهزة كمضاف بين مصنعي الأعلاف ومن المتوقع أن يدفع نمو سوق الأعلاف الجاهزة في جميع أنحاء العالم.
كانت الأسباب الرئيسية للطلب المتزايد على خلطات الأعلاف في البلدان النامية هي النمو السكاني والتحضر وارتفاع الأجور في البلدان النامية. وفقًا لاتحاد صناعة الأعلاف ( FIF )، وصل إنتاج الأعلاف المركبة إلى 1000 مليون طن سنويًا. هذا النمو في معدل الإنتاج أعلى بشكل خاص في البلدان النامية منه في البلدان المتقدمة. يساعد تحديث مزارع الماشية في المناطق النامية لتلبية الطلب المتزايد على البروتين الحيواني في سوق خلطات الأعلاف.
قم بتخصيص هذا التقرير ليناسب متطلباتك
ستحصل على تخصيص لأي تقرير - مجانًا - بما في ذلك أجزاء من هذا التقرير، أو تحليل على مستوى الدولة، وحزمة بيانات Excel، بالإضافة إلى الاستفادة من العروض والخصومات الرائعة للشركات الناشئة والجامعات
- احصل على أهم اتجاهات السوق الرئيسية لهذا التقرير.ستتضمن هذه العينة المجانية تحليلاً للبيانات، بدءًا من اتجاهات السوق وحتى التقديرات والتوقعات.
تقسيم التقرير ونطاقه:
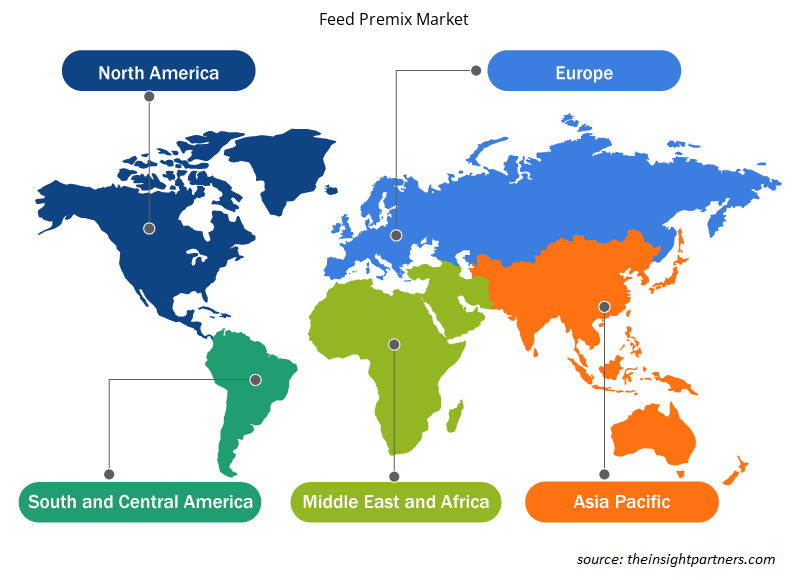
يتم تقسيم سوق الأعلاف العالمية حسب النوع والشكل والثروة الحيوانية والجغرافيا. يتم تقسيم السوق حسب النوع إلى فيتامينات ومعادن وأحماض أمينية ومضادات حيوية ومضادات أكسدة ومخاليط وغيرها. بناءً على الشكل، يتم تقسيم السوق إلى جاف وسائل. بناءً على الثروة الحيوانية، يتم تقسيم السوق إلى دواجن ومجترات وخنازير وتربية الأحياء المائية وغيرها. يتم تقسيم سوق الأعلاف الجاهزة حسب الجغرافيا إلى أمريكا الشمالية (الولايات المتحدة وكندا والمكسيك) وأوروبا (ألمانيا وفرنسا وإيطاليا والمملكة المتحدة وروسيا وبقية أوروبا) وآسيا والمحيط الهادئ (أستراليا والصين واليابان والهند وكوريا الجنوبية وبقية آسيا والمحيط الهادئ) والشرق الأوسط وأفريقيا (جنوب أفريقيا والمملكة العربية السعودية والإمارات العربية المتحدة وبقية الشرق الأوسط وأفريقيا) وأمريكا الجنوبية والوسطى (البرازيل والأرجنتين وبقية أمريكا الجنوبية والوسطى).UAE, and the Rest of Middle East & Africa), and South & Central America (Brazil, Argentina, and the Rest of South & Central America).
التحليل القطاعي:
بناءً على النوع، يتم تقسيم سوق الخلطات العلفية إلى فيتامينات ومعادن وأحماض أمينية ومضادات حيوية ومضادات أكسدة ومخاليط وغيرها. يشغل قطاع الخلطات حصة كبيرة من السوق. يواجه مصنعو الأعلاف الحيوانية عادةً صعوبة في تحديد جرعات كل عنصر غذائي في الأعلاف الحيوانية. وبالتالي، يقدم مصنعو إضافات الأعلاف مزيجًا من العناصر الغذائية المختلفة التي تساعد مصنعي الأعلاف الحيوانية على توفير الراحة. يعد الخلط المسبق على شكل مزيج أحد القطاعات البارزة لأنه يحتوي على نسبة متوازنة من العناصر الغذائية وعادةً ما يفضل مصنعو الأعلاف الحيوانية مزيجًا مخصصًا من الخلطات العلفية كمضافات لمحاليل الأعلاف الخاصة بهم. تدفع هذه العوامل نمو السوق لقطاع الخلطات.
التحليل الإقليمي:
بناءً على الجغرافيا، يتم تقسيم سوق الأعلاف الجاهزة إلى خمس مناطق رئيسية: أمريكا الشمالية وأوروبا وآسيا والمحيط الهادئ وأمريكا الجنوبية والوسطى والشرق الأوسط وأفريقيا. سيطرت منطقة آسيا والمحيط الهادئ على السوق العالمية؛ حيث بلغت قيمة السوق في هذه المنطقة 4449 مليون دولار أمريكي في عام 2022. ومن المتوقع أن يسجل السوق في أمريكا الشمالية معدل نمو سنوي مركب بنسبة 5.5٪ خلال الفترة المتوقعة. تعد منطقة آسيا والمحيط الهادئ أكبر منتج للأعلاف الحيوانية على مستوى العالم. وفقًا لشركة Alltech Global، أنتجت المنطقة أكثر من 305 مليون طن متري من الأعلاف الحيوانية في عام 2020. علاوة على ذلك، تضم المنطقة عددًا قليلاً من الدول الرئيسية التي تربي الماشية، مما يسرع الطلب على مكونات الأعلاف الحيوانية مثل الأعلاف الجاهزة في المنطقة. علاوة على ذلك، تمثل منطقة آسيا والمحيط الهادئ أكبر عدد من السكان بين المناطق الخمس وتحتوي على حوالي 60٪ من سكان العالم. وبالتالي، تشهد المنطقة طلبًا قويًا على اللحوم ومنتجات الألبان، مما يعزز متطلبات إنتاج الثروة الحيوانية وبالتالي يفضل الطلب على الأعلاف الحيوانية. إن الاستهلاك الجماعي للأعلاف الحيوانية في المنطقة والممارسات المتنامية لتغذية الأعلاف المغذية للماشية هي المحرك لسوق خلطات الأعلاف في المنطقة.
تمثل أوروبا ما يقرب من 20٪ من حصة السوق. يشهد سوق الأعلاف الجاهزة في أوروبا نموًا قويًا بسبب التصنيع المتزايد لإنتاج اللحوم والطلب المتزايد على الأعلاف الحيوانية المغذية. يتبنى أصحاب الماشية مكونات الأعلاف الصحية لإنتاج منتجات لحوم حيوانية صحية وعالية الجودة ومغذية. علاوة على ذلك، تشتهر أوروبا بتنوعها الكبير في مخزون الحيوانات والطلب المرتفع على اللحوم. وفقًا لـ Eurostat (الاتحاد الأوروبي)، في عام 2020، كان لدى أوروبا ما يقرب من 146 مليون خنزير و 76 مليون حيوان بقري و 75 مليون رأس من الأغنام والماعز. يتطلب مثل هذا المخزون الضخم من حيوانات الماشية ما يكفي من الأعلاف الحيوانية، مما يزيد من الطلب على الأعلاف الجاهزة. وبالتالي، فإن الإنتاج الضخم للأعلاف الحيوانية واستهلاكها بسبب نمو الماشية يعزز الطلب على إضافات الأعلاف المغذية مثل الأعلاف الجاهزة. وبالتالي، نظرًا لجميع العوامل المذكورة أعلاه، من المتوقع أن ينمو سوق الأعلاف الجاهزة بشكل كبير في أوروبا خلال فترة التنبؤ.
تطورات الصناعة والفرص المستقبلية:
فيما يلي قائمة بالمبادرات التي اتخذها اللاعبون الرئيسيون العاملون في سوق خلطات الأعلاف:
- في يونيو 2022، حصلت شركة Nutreco NV على منحة قدرها 4.8 مليون دولار أمريكي من مؤسسة بيل وميليندا جيتس لتنفيذ إنتاج الأعلاف المستدامة في منطقة جنوب الصحراء الكبرى في إفريقيا. وسيساعد هذا في تحسين مبادرات ESG للشركة.
- في عام 2021، استحوذت شركة ADM على شركة Golden Farm Production & Commerce Company Limited، وهي شركة فيتنامية متخصصة في إنتاج الخلطات الجاهزة. ويعزز هذا من تغطيتها الصناعية والتجارية في سوق أعلاف رئيسية مثل فيتنام.
رؤى إقليمية حول سوق الأعلاف الجاهزة
لقد قام المحللون في Insight Partners بشرح الاتجاهات والعوامل الإقليمية المؤثرة على سوق الأعلاف الجاهزة طوال فترة التوقعات بشكل شامل. يناقش هذا القسم أيضًا قطاعات سوق الأعلاف الجاهزة والجغرافيا في جميع أنحاء أمريكا الشمالية وأوروبا ومنطقة آسيا والمحيط الهادئ والشرق الأوسط وأفريقيا وأمريكا الجنوبية والوسطى.

- احصل على البيانات الإقليمية المحددة لسوق الأعلاف الجاهزة
نطاق تقرير سوق الأعلاف الجاهزة
| سمة التقرير | تفاصيل |
|---|---|
| حجم السوق في عام 2022 | 11.73 مليار دولار أمريكي |
| حجم السوق بحلول عام 2030 | 17.1 مليار دولار أمريكي |
| معدل النمو السنوي المركب العالمي (2022 - 2030) | 4.8% |
| البيانات التاريخية | 2020-2021 |
| فترة التنبؤ | 2023-2030 |
| القطاعات المغطاة | حسب النوع
|
| المناطق والدول المغطاة | أمريكا الشمالية
|
| قادة السوق وملفات تعريف الشركات الرئيسية |
|
كثافة اللاعبين في سوق الأعلاف الجاهزة: فهم تأثيرها على ديناميكيات الأعمال
يشهد سوق الأعلاف الجاهزة نموًا سريعًا، مدفوعًا بالطلب المتزايد من المستخدم النهائي بسبب عوامل مثل تفضيلات المستهلك المتطورة والتقدم التكنولوجي والوعي المتزايد بفوائد المنتج. ومع ارتفاع الطلب، تعمل الشركات على توسيع عروضها والابتكار لتلبية احتياجات المستهلكين والاستفادة من الاتجاهات الناشئة، مما يؤدي إلى زيادة نمو السوق.
تشير كثافة اللاعبين في السوق إلى توزيع الشركات أو المؤسسات العاملة في سوق أو صناعة معينة. وهي تشير إلى عدد المنافسين (اللاعبين في السوق) الموجودين في مساحة سوق معينة نسبة إلى حجمها أو قيمتها السوقية الإجمالية.
الشركات الرئيسية العاملة في سوق الأعلاف الجاهزة هي:
- الجمعية الدنماركية للزراعة AMBA
- مجموعة أجريفيرم بي في
- نوتريكو ان في
- شركة آرتشر دانييلز ميدلاند
- شركة كارغيل
إخلاء المسؤولية : الشركات المذكورة أعلاه ليست مرتبة بأي ترتيب معين.

- احصل على نظرة عامة على أهم اللاعبين الرئيسيين في سوق الأعلاف الجاهزة
تأثير جائحة كوفيد-19:
أثرت جائحة كوفيد-19 سلبًا على جميع الصناعات تقريبًا في مختلف البلدان. أعاقت عمليات الإغلاق والقيود المفروضة على السفر وإغلاق الأعمال في أمريكا الشمالية وأوروبا ومنطقة آسيا والمحيط الهادئ وأمريكا الجنوبية والوسطى والشرق الأوسط وأفريقيا نمو العديد من شركات تصنيع الأعلاف الحيوانية. أدى إغلاق وحدات التصنيع إلى اضطراب سلاسل التوريد العالمية وأنشطة الإنتاج وجداول التسليم ومبيعات المنتجات الأساسية وغير الأساسية. شهدت العديد من الشركات تأخيرات في تسليم المنتجات وانخفاضًا في مبيعات منتجاتها في عام 2020، مما أعاق سوق خلطات الأعلاف. كما أدى نقص القوى العاملة وحظر الاستيراد والتصدير والإمدادات المحدودة من المواد الخام إلى توقف العمليات والعمليات في جميع أنحاء العالم أثناء جائحة كوفيد-19. أثرت هذه العوامل سلبًا على نمو السوق في الجائحة.
ومع ذلك، في عام 2021، استأنفت العديد من الاقتصادات عملياتها بعد أن ألغت العديد من الحكومات القيود المفروضة سابقًا، مما أثر بشكل إيجابي على السوق العالمية. علاوة على ذلك، سُمح للمصنعين بالعمل بكامل طاقتهم، مما ساعدهم على التغلب على فجوات العرض والطلب.
المنافسة والشركات الرئيسية:
تعد شركة Danish Agro AMBA، وAgrifirm Group BV، وNutreco NV، وArcher-Daniels-Midland Co، وCargill Inc، وKoninklijke DSM NV، وDansk Landbrugs Grovvareselskab amba، وNuSana BV، وDe Heus Voeders BV، وKemin Industries Inc من بين أبرز اللاعبين الذين يعملون في سوق الأعلاف الجاهزة العالمية. تتبنى هذه الشركات مبادرات التنمية الاستراتيجية لتوسيع أعمالها، مما يؤدي إلى زيادة نمو سوق الأعلاف الجاهزة.
- التحليل التاريخي (سنتان)، السنة الأساسية، التوقعات (7 سنوات) مع معدل النمو السنوي المركب
- تحليل PEST و SWOT
- حجم السوق والقيمة / الحجم - عالميًا وإقليميًا وقطريًا
- الصناعة والمنافسة
- مجموعة بيانات Excel


Report Coverage
Revenue forecast, Company Analysis, Industry landscape, Growth factors, and Trends

Segment Covered
This text is related
to segments covered.

Regional Scope
North America, Europe, Asia Pacific, Middle East & Africa, South & Central America

Country Scope
This text is related
to country scope.
الأسئلة الشائعة
Danish Agro AMBA, Agrifirm Group BV, Nutreco NV, Archer-Daniels-Midland Co, Cargill Inc, Koninklijke DSM NV, Dansk Landbrugs Grovvareselskab amba, NuSana BV, De Heus Voeders BV, Kemin Industries Inc are a few players operating in the global feed premix market.
North America is estimated to register the fastest CAGR in the global feed premix market over the forecast period. The mass production of animal feed in North America and the rise in food safety concerns, especially about meat and dairy products, have led to the increased consumption of nutritional animal feed infused with various nutrients in the form of feed premix in the region.
In 2022, Asia Pacific held the largest share of the global feed premix market. the region is witnessing strong demand for meat and dairy products, boosting the requirement for livestock production and subsequently favoring the demand for animal feed additives such as feed premixes.
Based on type, the blends segment held the largest share in the global feed premix market in 2022 as it has balance proportion of nutrients, and the animal feed manufacturers usually prefer custom blend of feed premixes as an additive for their feed solutions. This factor, thereby, drives the growth of the segment.
Based on livestock, the segment is estimated to register the fastest CAGR in the global feed premix market over the forecast period. The growing aquaculture industry and rising awareness about the nutritional requirements of fish and other aquaculture animals boost the segment’s share.
Increasing livestock production and feed fortification the two key factors driving the feed premix market growth.
Trends and growth analysis reports related to Food and Beverages : READ MORE..
The List of Companies - Feed Premix Market
- Danish Agro AMBA
- Agrifirm Group BV
- Nutreco NV
- Archer-Daniels-Midland Co
- Cargill Inc
- Koninklijke DSM NV
- Dansk Landbrugs Grovvareselskab amba
- NuSana BV
- De Heus Voeders BV
- Kemin Industries Inc
The Insight Partners performs research in 4 major stages: Data Collection & Secondary Research, Primary Research, Data Analysis and Data Triangulation & Final Review.
- Data Collection and Secondary Research:
As a market research and consulting firm operating from a decade, we have published and advised several client across the globe. First step for any study will start with an assessment of currently available data and insights from existing reports. Further, historical and current market information is collected from Investor Presentations, Annual Reports, SEC Filings, etc., and other information related to company’s performance and market positioning are gathered from Paid Databases (Factiva, Hoovers, and Reuters) and various other publications available in public domain.
Several associations trade associates, technical forums, institutes, societies and organization are accessed to gain technical as well as market related insights through their publications such as research papers, blogs and press releases related to the studies are referred to get cues about the market. Further, white papers, journals, magazines, and other news articles published in last 3 years are scrutinized and analyzed to understand the current market trends.
- Primary Research:
The primarily interview analysis comprise of data obtained from industry participants interview and answers to survey questions gathered by in-house primary team.
For primary research, interviews are conducted with industry experts/CEOs/Marketing Managers/VPs/Subject Matter Experts from both demand and supply side to get a 360-degree view of the market. The primary team conducts several interviews based on the complexity of the markets to understand the various market trends and dynamics which makes research more credible and precise.
A typical research interview fulfils the following functions:
- Provides first-hand information on the market size, market trends, growth trends, competitive landscape, and outlook
- Validates and strengthens in-house secondary research findings
- Develops the analysis team’s expertise and market understanding
Primary research involves email interactions and telephone interviews for each market, category, segment, and sub-segment across geographies. The participants who typically take part in such a process include, but are not limited to:
- Industry participants: VPs, business development managers, market intelligence managers and national sales managers
- Outside experts: Valuation experts, research analysts and key opinion leaders specializing in the electronics and semiconductor industry.
Below is the breakup of our primary respondents by company, designation, and region:

Once we receive the confirmation from primary research sources or primary respondents, we finalize the base year market estimation and forecast the data as per the macroeconomic and microeconomic factors assessed during data collection.
- Data Analysis:
Once data is validated through both secondary as well as primary respondents, we finalize the market estimations by hypothesis formulation and factor analysis at regional and country level.
- Macro-Economic Factor Analysis:
We analyse macroeconomic indicators such the gross domestic product (GDP), increase in the demand for goods and services across industries, technological advancement, regional economic growth, governmental policies, the influence of COVID-19, PEST analysis, and other aspects. This analysis aids in setting benchmarks for various nations/regions and approximating market splits. Additionally, the general trend of the aforementioned components aid in determining the market's development possibilities.
- Country Level Data:
Various factors that are especially aligned to the country are taken into account to determine the market size for a certain area and country, including the presence of vendors, such as headquarters and offices, the country's GDP, demand patterns, and industry growth. To comprehend the market dynamics for the nation, a number of growth variables, inhibitors, application areas, and current market trends are researched. The aforementioned elements aid in determining the country's overall market's growth potential.
- Company Profile:
The “Table of Contents” is formulated by listing and analyzing more than 25 - 30 companies operating in the market ecosystem across geographies. However, we profile only 10 companies as a standard practice in our syndicate reports. These 10 companies comprise leading, emerging, and regional players. Nonetheless, our analysis is not restricted to the 10 listed companies, we also analyze other companies present in the market to develop a holistic view and understand the prevailing trends. The “Company Profiles” section in the report covers key facts, business description, products & services, financial information, SWOT analysis, and key developments. The financial information presented is extracted from the annual reports and official documents of the publicly listed companies. Upon collecting the information for the sections of respective companies, we verify them via various primary sources and then compile the data in respective company profiles. The company level information helps us in deriving the base number as well as in forecasting the market size.
- Developing Base Number:
Aggregation of sales statistics (2020-2022) and macro-economic factor, and other secondary and primary research insights are utilized to arrive at base number and related market shares for 2022. The data gaps are identified in this step and relevant market data is analyzed, collected from paid primary interviews or databases. On finalizing the base year market size, forecasts are developed on the basis of macro-economic, industry and market growth factors and company level analysis.
- Data Triangulation and Final Review:
The market findings and base year market size calculations are validated from supply as well as demand side. Demand side validations are based on macro-economic factor analysis and benchmarks for respective regions and countries. In case of supply side validations, revenues of major companies are estimated (in case not available) based on industry benchmark, approximate number of employees, product portfolio, and primary interviews revenues are gathered. Further revenue from target product/service segment is assessed to avoid overshooting of market statistics. In case of heavy deviations between supply and demand side values, all thes steps are repeated to achieve synchronization.
We follow an iterative model, wherein we share our research findings with Subject Matter Experts (SME’s) and Key Opinion Leaders (KOLs) until consensus view of the market is not formulated – this model negates any drastic deviation in the opinions of experts. Only validated and universally acceptable research findings are quoted in our reports.
We have important check points that we use to validate our research findings – which we call – data triangulation, where we validate the information, we generate from secondary sources with primary interviews and then we re-validate with our internal data bases and Subject matter experts. This comprehensive model enables us to deliver high quality, reliable data in shortest possible time.


 احصل على عينة مجانية لهذا التقرير