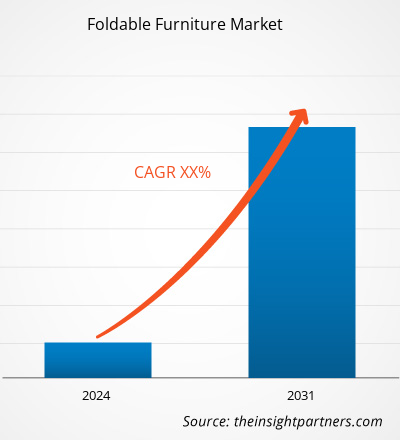
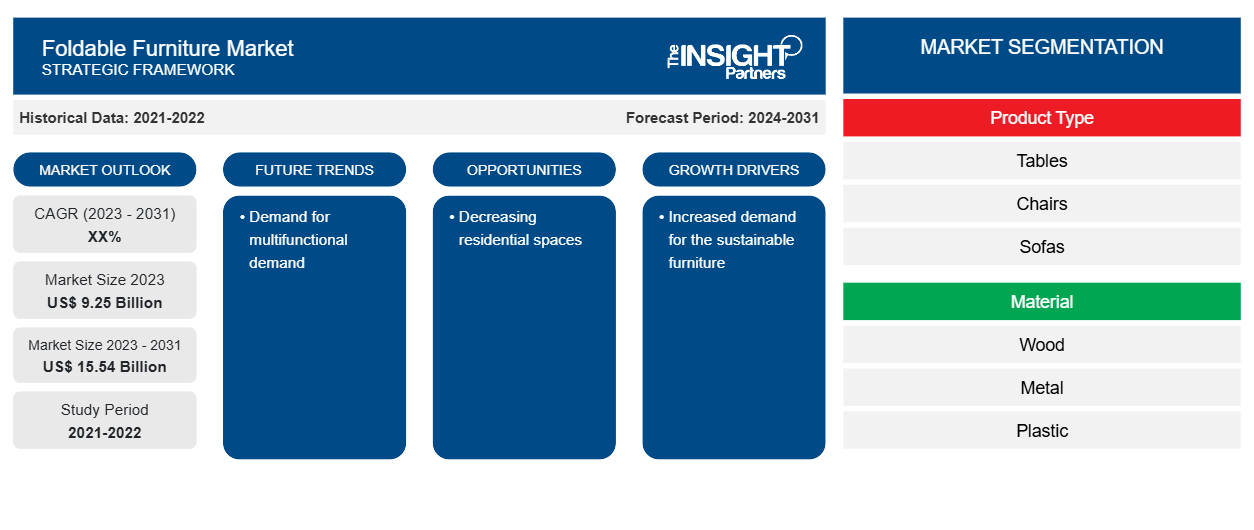
من المتوقع أن يصل حجم سوق الأثاث القابل للطي إلى 15.54 مليار دولار أمريكي بحلول عام 2031 من 9.25 مليار دولار أمريكي في عام 2023. ومن المتوقع أن يسجل السوق معدل نمو سنوي مركب بنسبة XX٪ في الفترة 2023-2031. الطلب على الأثاث متعدد الوظائف ينمو بشكل ملحوظ. مع صغر المساحات السكنية، تزداد الحاجة إلى الأثاث متعدد الوظائف . بالإضافة إلى ذلك، مع تزايد وعي المستهلكين بالبيئة، يتزايد الطلب على الأثاث القابل للطي واعتماده.
تحليل سوق الأثاث القابل للطي
زاد الطلب على الأثاث في السنوات القليلة الماضية. وفقًا للبيانات التي نشرتها Marketplace، ارتفعت مبيعات الأثاث المنزلي في يناير 2022 بنحو 7.2٪ مقارنة بديسمبر 2021. وفقًا للبيانات التي نشرتها Forbes في عام 2022، شهد تجار التجزئة للأثاث زيادة في المبيعات من 64 مليار دولار أمريكي إلى 79.9 مليار دولار أمريكي في عام 2022، بنسبة نمو 24٪. يؤثر هذا النمو في سوق الأثاث بشكل مباشر على الطلب على سوق الأثاث القابل للطي مما يؤدي في النهاية إلى دفع السوق. بصرف النظر عن زيادة الطلب على الأثاث، فإن وجود قنوات البيع عبر الإنترنت مثل Amazon و Alibaba يعمل على زيادة المبيعات نظرًا لزيادة التوافر في جميع أنحاء العالم.
نظرة عامة على سوق الأثاث القابل للطي
الطلب على المنتج ينمو بسرعة في منطقة آسيا والمحيط الهادئ التي تمتلك أعلى حصة في السوق خلال فترة التنبؤ. أحد العوامل التي تدفع حصة السوق هو زيادة عدد السكان في المنطقة. وفقًا للبيانات التي نشرها صندوق الأمم المتحدة للسكان، فإن منطقة آسيا والمحيط الهادئ هي موطن لحوالي 60٪ من إجمالي سكان العالم وهو ما يقرب من 4.3 مليار نسمة. مثل هذه الزيادة السكانية تزيد من الطلب على الأثاث في المنطقة مما يؤدي في النهاية إلى تحريك السوق. صناعة الأثاث مجزأة للغاية وبالتالي، هناك العديد من الشركات المصنعة في الصناعة التي تقدم خدمات عالية الجودة للعميل. وبالتالي نظرًا لوجود عدد كبير من الشركات في الصناعة، تم تقسيم حصة السوق في الصناعة إلى عدد كبير من الشركات. وهذا يزيد من القوة التفاوضية للمستهلك حيث أن لديه مجموعة واسعة من الخيارات للاختيار من بينها.
قم بتخصيص هذا التقرير ليناسب متطلباتك
ستحصل على تخصيص لأي تقرير - مجانًا - بما في ذلك أجزاء من هذا التقرير، أو تحليل على مستوى الدولة، وحزمة بيانات Excel، بالإضافة إلى الاستفادة من العروض والخصومات الرائعة للشركات الناشئة والجامعات
-
احصل على أهم اتجاهات السوق الرئيسية لهذا التقرير.ستتضمن هذه العينة المجانية تحليلاً للبيانات، بدءًا من اتجاهات السوق وحتى التقديرات والتوقعات.
محركات وفرص سوق الأثاث القابل للطي
زيادة الطلب على الأثاث المستدام
مع تزايد الوعي بمسألة إزالة الكربون في جميع أنحاء العالم، حدث تحول في تفضيلات المستهلكين. يفضل المستهلكون الآن المنتجات المستدامة. ووفقًا للبيانات المتاحة في المجال العام، فإن الاستدامة هي أحد العوامل المهمة عندما يتعلق الأمر بشراء المنتجات، ويفضل حوالي ثلاثة أرباع المستهلكين في جميع أنحاء العالم شراء المنتجات المستدامة. وقد أدت مثل هذه التغييرات في تفضيلات المستهلكين إلى زيادة الطلب على الأثاث المستدام في السنوات القليلة الماضية.
تقليص المساحات السكنية
مع النمو الكبير في عدد السكان في جميع أنحاء العالم، يتزايد الطلب على البناء. ومع ذلك، فإن توافر الأراضي المناسبة يتناقص بسرعة. على سبيل المثال، انخفض عدد المنازل المبنية حديثًا، وخاصة في أوروبا والولايات المتحدة، في السنوات القليلة الماضية. وفقًا للبيانات التي نشرها مكتب الإحصاء الأمريكي في عام 2023، كان متوسط لقطات الأسر المنفردة في عام 2017 هو 2385، ومع ذلك، وصل العدد إلى 2179 في عام 2023. وهذا يوضح انخفاض عدد المساحات في البناء السكني. ومن المتوقع أن يؤدي هذا الانخفاض في المساحة السكنية إلى توليد فرص مربحة لسوق الأثاث القابل للطي في السنوات القادمة.
تقرير تحليل تجزئة سوق الأثاث القابل للطي
إن القطاعات الرئيسية التي ساهمت في اشتقاق تحليل سوق الأثاث القابل للطي هي نوع المنتج والمادة والتطبيق وقناة التوزيع.
- بناءً على النوع، ينقسم سوق الأثاث القابل للطي إلى طاولات وكراسي وأرائك وأسرة وغيرها. احتل قطاع الطاولات والكراسي حصة سوقية أكبر في عام 2023.
- من حيث التطبيق، يتم تقسيم السوق إلى سكني وتجاري وغيرها. احتل القطاع السكني الحصة الأكبر من السوق في عام 2023.
- من حيث قنوات التوزيع، ينقسم السوق إلى سوق عبر الإنترنت وسوق خارج الإنترنت. كما ينقسم السوق أيضًا على أساس المزودين إلى سوق عبر الإنترنت وسوق خارج الإنترنت. وقد هيمن قطاع الإنترنت على السوق في عام 2023.
تحليل حصة سوق الأثاث القابل للطي حسب المنطقة الجغرافية
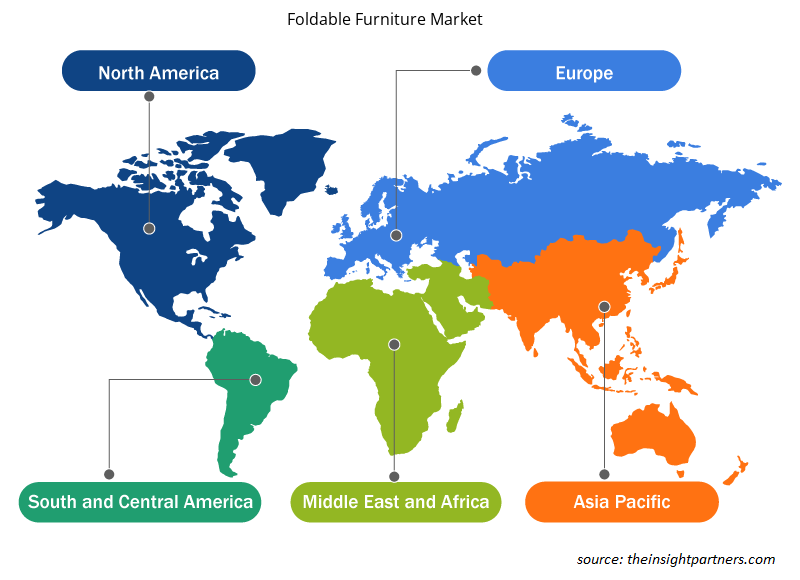
يتم تقسيم النطاق الجغرافي لتقرير سوق الأثاث القابل للطي بشكل أساسي إلى خمس مناطق: أمريكا الشمالية، ومنطقة آسيا والمحيط الهادئ، وأوروبا، والشرق الأوسط وأفريقيا، وأمريكا الجنوبية/أمريكا الجنوبية والوسطى.
سيطرت منطقة آسيا والمحيط الهادئ على السوق في عام 2023 بسبب الطلب المرتفع على سوق الأثاث. يرجع الطلب على السوق بشكل أساسي إلى زيادة البناء السكني في جميع أنحاء العالم. في دول مثل الصين، نما البناء عدة مرات في السنوات القليلة الماضية. أثر الطلب المتزايد على البناء السكني بشكل مباشر على الطلب على سوق الأثاث القابل للطي بشكل إيجابي. وبصرف النظر عن منطقة آسيا والمحيط الهادئ، من المتوقع أن تكتسب منطقة أمريكا الشمالية وأوروبا حصة سوقية ملحوظة.
رؤى إقليمية حول سوق الأثاث القابل للطي
لقد قام المحللون في Insight Partners بشرح الاتجاهات والعوامل الإقليمية المؤثرة على سوق الأثاث القابل للطي طوال فترة التوقعات بشكل شامل. يناقش هذا القسم أيضًا قطاعات سوق الأثاث القابل للطي والجغرافيا في جميع أنحاء أمريكا الشمالية وأوروبا ومنطقة آسيا والمحيط الهادئ والشرق الأوسط وأفريقيا وأمريكا الجنوبية والوسطى.

- احصل على البيانات الإقليمية المحددة لسوق الأثاث القابل للطي
نطاق تقرير سوق الأثاث القابل للطي
| سمة التقرير | تفاصيل |
|---|---|
| حجم السوق في عام 2023 | 9.25 مليار دولار أمريكي |
| حجم السوق بحلول عام 2031 | 15.54 مليار دولار أمريكي |
| معدل النمو السنوي المركب العالمي (2023 - 2031) | XX% |
| البيانات التاريخية | 2021-2022 |
| فترة التنبؤ | 2024-2031 |
| القطاعات المغطاة |
حسب نوع المنتج
|
| المناطق والدول المغطاة |
أمريكا الشمالية
|
| قادة السوق وملفات تعريف الشركات الرئيسية |
|
كثافة اللاعبين في السوق: فهم تأثيرها على ديناميكيات الأعمال
يشهد سوق الأثاث القابل للطي نموًا سريعًا، مدفوعًا بالطلب المتزايد من المستخدم النهائي بسبب عوامل مثل تفضيلات المستهلك المتطورة والتقدم التكنولوجي والوعي المتزايد بفوائد المنتج. ومع ارتفاع الطلب، تعمل الشركات على توسيع عروضها والابتكار لتلبية احتياجات المستهلكين والاستفادة من الاتجاهات الناشئة، مما يؤدي إلى زيادة نمو السوق.
تشير كثافة اللاعبين في السوق إلى توزيع الشركات أو المؤسسات العاملة في سوق أو صناعة معينة. وهي تشير إلى عدد المنافسين (اللاعبين في السوق) الموجودين في مساحة سوق معينة نسبة إلى حجمها أو قيمتها السوقية الإجمالية.
الشركات الرئيسية العاملة في سوق الأثاث القابل للطي هي:
- شركة ليجيت و بلات
- شركة اشلي للصناعات الأثاثية ذ.م.م
- شركة إنتر إيكيا القابضة المحدودة
- شركة هوسي للجلوس
- شركة ساودير للتصنيع
- شركة ميكو
إخلاء المسؤولية : الشركات المذكورة أعلاه ليست مرتبة بأي ترتيب معين.

- احصل على نظرة عامة على أهم اللاعبين الرئيسيين في سوق الأثاث القابل للطي
أخبار سوق الأثاث القابل للطي والتطورات الأخيرة
يتم تقييم سوق الأثاث القابل للطي من خلال جمع البيانات النوعية والكمية بعد البحث الأولي والثانوي، والتي تتضمن منشورات الشركات المهمة وبيانات الجمعيات وقواعد البيانات. فيما يلي قائمة بالتطورات في سوق الأثاث القابل للطي والاستراتيجيات:
- أطلقت شركة Cover Home منتجاتها المبتكرة من المراتب القابلة للطي وأثاث المنزل الذكي في المغرب. تركز المجموعة الجديدة بشكل خاص على تلبية المتطلبات المتطورة للأسر الحديثة. (المصدر: Cover Home، بيان صحفي/موقع الشركة الإلكتروني/النشرة الإخبارية، 2024)
- أطلقت شركة ليفين بوكس كرسيها القابل للطي الجديد CH-40. يُعد كرسي ليفين بوكس القابل للطي ضرورة متعددة الوظائف للبالغين والأطفال. يتميز بخفة وزنه وقدرته على تحمل الأحمال الثقيلة وتوفير المساحة. يتحمل وزنًا يصل إلى 120 كجم للاستخدامات الشاقة. (المصدر: اسم شركة الأثاث القابل للطي، البيان الصحفي/موقع الشركة على الويب/النشرة الإخبارية، 2023)
تقرير سوق الأثاث القابل للطي: التغطية والنتائج المتوقعة
يوفر تقرير "حجم سوق الأثاث القابل للطي والتوقعات (2021-2031)" تحليلاً مفصلاً للسوق يغطي المجالات التالية:
- حجم السوق والتوقعات على المستويات العالمية والإقليمية والوطنية لجميع قطاعات السوق الرئيسية التي يغطيها النطاق
- ديناميكيات السوق مثل المحركات والقيود والفرص الرئيسية
- الاتجاهات المستقبلية الرئيسية
- تحليل مفصل لقوى PEST/Porter الخمس وSWOT
- تحليل السوق العالمي والإقليمي الذي يغطي اتجاهات السوق الرئيسية واللاعبين الرئيسيين واللوائح والتطورات الأخيرة في السوق
- تحليل المشهد الصناعي والمنافسة الذي يغطي تركيز السوق، وتحليل خريطة الحرارة، واللاعبين البارزين، والتطورات الأخيرة
- ملفات تعريف الشركة التفصيلية
- التحليل التاريخي (سنتان)، سنة الأساس، التوقعات (7 سنوات) مع معدل النمو السنوي المركب
- تحليل PEST و SWOT
- حجم السوق والقيمة / الحجم - عالمي، إقليمي، بلد
- الصناعة والمنافسة
- مجموعة بيانات إكسل
التقارير الحديثة
شهادات العملاء
سبب الشراء
- اتخاذ قرارات مدروسة
- فهم ديناميكيات السوق
- تحليل المنافسة
- رؤى العملاء
- توقعات السوق
- تخفيف المخاطر
- التخطيط الاستراتيجي
- مبررات الاستثمار
- تحديد الأسواق الناشئة
- تحسين استراتيجيات التسويق
- تعزيز الكفاءة التشغيلية
- مواكبة التوجهات التنظيمية


 احصل على عينة مجانية ل - سوق الأثاث القابل للطي