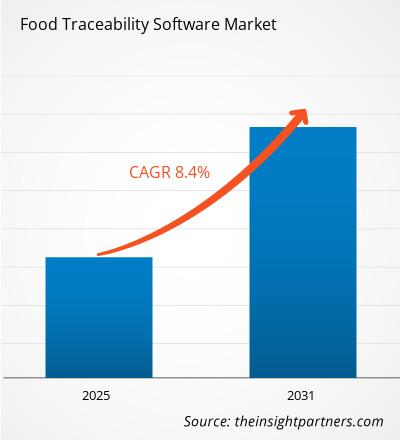
من المتوقع أن يسجل سوق برامج تتبع الأغذية معدل نمو سنوي مركب بنسبة 8.4% خلال الفترة 2023-2031. ومن المرجح أن يظل الوعي المتزايد المتعلق بالحفاظ على سلامة الأغذية وجودتها اتجاهًا رئيسيًا في السوق.
تحليل سوق برامج تتبع الأغذية
- يتم استخدام برامج تتبع الأغذية لتتبع الأغذية أو المكونات من الإنتاج إلى البيع حيث تلعب التكنولوجيا دورًا حيويًا في مراقبة سلسلة التوريد والتحكم فيها بكفاءة وشفافية.
- يؤثر اعتماد تقنيات إنترنت الأشياء مثل RFID و blockchain بشكل كبير على البرامج ويعزز نمو السوق.
- إن المعايير التنظيمية الصارمة والإجراءات الموحدة التي وضعتها السلطات الحكومية للمصنعين هي التي تدفع نمو السوق.
نظرة عامة على سوق برامج تتبع الأغذية
- تساعد برامج تتبع الأغذية شركات الأغذية على تبسيط العملية وتمكينها من جمع البيانات وتخزينها وتتبعها. تضمن برامج تتبع الأغذية سلامة الأغذية وتحسن كفاءة سلسلة التوريد.
- تساعد برامج تتبع الأغذية ذات التقنيات المتقدمة في تحديد الملوثات الموجودة في المنتجات الغذائية وتقليل المخاطر الصحية المحتملة للمستهلكين. يساعد هذا البرنامج في تلبية الطلب المتزايد من المستهلكين، وزيادة الكفاءة التشغيلية، والحد من هدر الغذاء.
تخصيص البحث ليناسب متطلباتك
يمكننا تحسين وتخصيص التحليل والنطاق الذي لم يتم تحقيقه من خلال عروضنا القياسية. ستساعدك هذه المرونة في الحصول على المعلومات الدقيقة اللازمة لتخطيط أعمالك واتخاذ القرارات.
سوق برامج تتبع الأغذية: رؤى استراتيجية

معدل النمو السنوي المركب (2023 - 2031)8.4%- حجم السوق بحلول عام 2023
XX مليار دولار أمريكي - حجم السوق 2031
XX مليار دولار أمريكي
ديناميكيات السوق
- معايير وإجراءات تنظيمية صارمة
- تعزيز التكنولوجيا لمراقبة الجودة
- زيادة الوعي فيما يتعلق بالحفاظ على سلامة وجودة الغذاء
اللاعبون الرئيسيون
- مجموعة كوردانس
- ويرفور، المحدودة
- ترستويل
- كاي
- برنامج مينوتور
- فارم سوفت
- شركة سوفت تريس المحدودة
- e الغذاء-ERP
- أبتين
- شركة تشيتو
نظرة عامة إقليمية

- أمريكا الشمالية
- أوروبا
- آسيا والمحيط الهادئ
- أمريكا الجنوبية والوسطى
- الشرق الأوسط وأفريقيا
تقسيم السوق
 يكتب
يكتب- برنامج تخطيط موارد المؤسسات
- برنامج إدارة معلومات المختبر
- برنامج إدارة الجودة
- برنامج المستودعات
 وضع النشر
- مبني على السحابة ومحليًا
 طلب
طلب- الشركات الكبيرة والشركات الصغيرة والمتوسطة
المستخدمون النهائيون- مصنعي الأغذية
- تجار التجزئة للمواد الغذائية
- موزعي المواد الغذائية
- مقدمي خدمات الطعام
- يُظهر ملف PDF النموذجي بنية المحتوى وطبيعة المعلومات مع التحليل النوعي والكمي.
محركات وفرص سوق برامج تتبع الأغذية
معايير وإجراءات تنظيمية صارمة لصالح السوق
- يضمن قانون تحديث سلامة الأغذية (FSMA) لوائح ومعايير تتبع الأغذية التي تهدف إلى منع مشاكل سلامة الأغذية.
- أصدرت إدارة الغذاء والدواء الأمريكية (FDA) قاعدة نهائية بشأن إمكانية تتبع الأغذية من أجل تحديد المنتجات الضارة وإزالتها بسرعة من سلسلة التوريد. تعمل هذه القواعد على تحسين ممارسات تتبع الأغذية.
- يجب أن يكون برنامج التتبع متصلاً بشكل كامل بنظام تخطيط موارد المؤسسة (ERP) الخاص بشركة الأغذية للتخلص من إدخالات الأرقام المكررة والمشكلات غير المرغوب فيها الأخرى.
- الامتثال لإدارة الغذاء والدواء: يتيح برنامج مراقبة الدفعات لشركات الأغذية استرداد معلومات العميل بسرعة لأي دفعة وإنشاء خطابات استدعاء الدفعة، مما يسمح لشركات الأغذية بتجنب رسوم الامتثال الباهظة مع حماية العملاء أيضًا.
- يتيح مراقبة الدفعات تتبع FIFO [الأول في الدخول، الأول في الخروج] وFEFO [الأول في انتهاء الصلاحية، الأول في الخروج]، مما يضمن لشركات الأغذية بيع أقدم المنتجات وأقربها إلى انتهاء الصلاحية أولاً، مما يمنعها من البقاء في المستودع لفترة طويلة.
تعزيز التكنولوجيا لمراقبة الجودة
- تعمل التكنولوجيا الجديدة على تغذية نمو السوق، وذلك بسبب طلب المستهلكين لمزيد من الشفافية وإمكانية تتبع منتجاتهم الغذائية.
- يساعد التقدم التكنولوجي وتطور إنترنت الأشياء (IoT) والعلامات الذكية والبيانات الضخمة والذكاء الاصطناعي والتعلم الآلي وتقنيات blockchain شركات الأغذية على تحسين مراقبة الجودة وتمكين المراقبة المناسبة للمنتجات الغذائية.
- تعمل هذه التقنيات على تبسيط إمكانية تتبع الأغذية، وزيادة الكفاءة، والقضاء على الفشل في العمليات اليدوية، والتقاط البيانات وتخزينها تلقائيًا، وتقليل التكاليف التشغيلية والمخاطر.
تقرير تحليل تجزئة سوق برامج تتبع الأغذية
إن القطاعات الرئيسية التي ساهمت في اشتقاق تحليل سوق برامج تتبع الأغذية هي النوع وطريقة النشر والتطبيق والمستخدمين النهائيين.
- بناءً على النوع، ينقسم سوق برامج تتبع الأغذية إلى برامج تخطيط موارد المؤسسات (ERP)، وبرامج إدارة معلومات المختبرات، وبرامج إدارة الجودة، وبرامج المستودعات، وغيرها. ومن المتوقع أن يتوسع قطاع برامج تخطيط موارد المؤسسات (ERP) بوتيرة كبيرة خلال فترة التنبؤ.
- من حيث وضع النشر، ينقسم قطاع السحابة إلى قطاع قائم على السحابة وقطاع محلي. وقد استحوذ قطاع السحابة على حصة سوقية أكبر في عام 2023.
- من حيث التطبيق، ينقسم سوق برامج تتبع الأغذية إلى الشركات الكبيرة والشركات الصغيرة والمتوسطة. احتلت شريحة الشركات الكبيرة حصة سوقية أكبر في عام 2023.
- بناءً على المستخدمين النهائيين، يتم تقسيم سوق برامج تتبع الأغذية إلى مصنعي الأغذية وتجار التجزئة للأغذية وموزعي الأغذية ومقدمي خدمات الأغذية. احتلت شريحة مصنعي الأغذية حصة سوقية أكبر في عام 2023.
تحليل حصة سوق برامج تتبع الأغذية حسب المنطقة الجغرافية
ينقسم النطاق الجغرافي لتقرير سوق برامج تتبع الأغذية بشكل أساسي إلى خمس مناطق: أمريكا الشمالية، ومنطقة آسيا والمحيط الهادئ، وأوروبا، والشرق الأوسط وأفريقيا، وأمريكا الجنوبية والوسطى.
- من المتوقع أن يتوسع السوق في أمريكا الشمالية خلال الفترة المتوقعة، وذلك بسبب الطلب المتزايد على المنتجات عالية الجودة بين المستهلكين. وهذا يشجع اللاعبين في السوق على تطوير أو ترقية برامج تتبع الأغذية لتزويد عملائهم بفوائد تتبع الأغذية في الوقت الفعلي.
- علاوة على ذلك، فإن الاعتماد المتزايد على برامج تتبع الأغذية من قبل الشركات الكبرى لإدارة عمليات المستودعات يخلق فرصًا في السوق خلال فترة التنبؤ.
نطاق تقرير سوق برامج تتبع الأغذية
| سمة التقرير | تفاصيل |
|---|---|
| حجم السوق في عام 2023 | XX مليار دولار أمريكي |
| حجم السوق بحلول عام 2031 | XX مليار دولار أمريكي |
| معدل النمو السنوي المركب العالمي (2023 - 2031) | 8.4% |
| البيانات التاريخية | 2021-2023 |
| فترة التنبؤ | 2024-2031 |
| القطاعات المغطاة | حسب النوع
|
| المناطق والدول المغطاة | أمريكا الشمالية
|
| قادة السوق وملفات تعريف الشركات الرئيسية |
|
- يُظهر ملف PDF النموذجي بنية المحتوى وطبيعة المعلومات مع التحليل النوعي والكمي.
أخبار سوق برامج تتبع الأغذية والتطورات الأخيرة
يتم تقييم سوق برامج تتبع الأغذية من خلال جمع البيانات النوعية والكمية بعد البحث الأولي والثانوي، والذي يتضمن منشورات الشركات المهمة وبيانات الجمعيات وقواعد البيانات. فيما يلي بعض التطورات في سوق برامج تتبع الأغذية:
- استحوذت مجموعة كوردانس على شركة بلو لينك أسوشيتس المحدودة (بلو لينك)، مما يعزز التزام كوردانس بتعزيز محفظتها بحلول برمجية مبتكرة تعمل على تمكين الشركات عبر مختلف الصناعات. يعكس هذا الاستحواذ التزام كوردانس بالحفاظ على القوة الفريدة والثقافة الإبداعية التي جعلت من بلو لينك شريكًا موثوقًا به للموزعين الصناعيين والصيدلانيين والأغذية والمشروبات. (المصدر: مجموعة كوردانس، بيان صحفي، يناير 2024)
تقرير سوق برامج تتبع الأغذية والتغطية والنتائج النهائية
يوفر تقرير "حجم سوق برامج تتبع الأغذية والتوقعات (2021-2031)" تحليلاً مفصلاً للسوق يغطي المجالات التالية:
- حجم سوق برامج تتبع الأغذية وتوقعاته على المستويات العالمية والإقليمية والوطنية لجميع قطاعات السوق الرئيسية التي يغطيها النطاق
- اتجاهات سوق برامج تتبع الأغذية بالإضافة إلى ديناميكيات السوق مثل العوامل المحركة والقيود والفرص الرئيسية
- تحليل مفصل لقوى PEST/Porter الخمس وSWOT
- تحليل سوق برامج تتبع الأغذية الذي يغطي اتجاهات السوق الرئيسية والإطار العالمي والإقليمي والجهات الفاعلة الرئيسية واللوائح والتطورات الأخيرة في السوق
- تحليل المشهد الصناعي والمنافسة الذي يغطي تركيز السوق، وتحليل خريطة الحرارة، واللاعبين البارزين، والتطورات الأخيرة في سوق برامج تتبع الأغذية
- ملفات تعريف الشركة التفصيلية
- التحليل التاريخي (سنتان)، السنة الأساسية، التوقعات (7 سنوات) مع معدل النمو السنوي المركب
- تحليل PEST و SWOT
- حجم السوق والقيمة / الحجم - عالميًا وإقليميًا وقطريًا
- الصناعة والمنافسة
- مجموعة بيانات Excel


Report Coverage
Revenue forecast, Company Analysis, Industry landscape, Growth factors, and Trends

Segment Covered
This text is related
to segments covered.

Regional Scope
North America, Europe, Asia Pacific, Middle East & Africa, South & Central America

Country Scope
This text is related
to country scope.
الأسئلة الشائعة
North America dominated the food traceability software market in 2023.
Strict regulatory standards and procedures are the major factors that propel the global food traceability software market.
Growing awareness related to maintaining food safety and quality to play a significant role in the global food traceability software market in the coming years.
The key players holding majority shares in the global food traceability software market are Cordance Group, Wherefour, Inc., Trustwell, CAI, Minotaur Software, FarmSoft, SoftTrace Ltd, e Food-ERP, Aptean, and Chetu Inc.
The global food traceability software market is estimated to register a CAGR of 8.4% during the forecast period 2023–2031.
Trends and growth analysis reports related to Technology, Media and Telecommunications : READ MORE..
The List of Companies
1. Blue Link Associates Limited
2. Carlisle Technology
3. FoodLogiQ
4. Famous Software LLC
5. FreshByte Software
6. IBM Corporation
7.LINKFRESH Software Limited
8. METTLER TOLEDO
9. Minotaur Software Ltd.
10. WaudWare Incorporated
The Insight Partners performs research in 4 major stages: Data Collection & Secondary Research, Primary Research, Data Analysis and Data Triangulation & Final Review.
- Data Collection and Secondary Research:
As a market research and consulting firm operating from a decade, we have published and advised several client across the globe. First step for any study will start with an assessment of currently available data and insights from existing reports. Further, historical and current market information is collected from Investor Presentations, Annual Reports, SEC Filings, etc., and other information related to company’s performance and market positioning are gathered from Paid Databases (Factiva, Hoovers, and Reuters) and various other publications available in public domain.
Several associations trade associates, technical forums, institutes, societies and organization are accessed to gain technical as well as market related insights through their publications such as research papers, blogs and press releases related to the studies are referred to get cues about the market. Further, white papers, journals, magazines, and other news articles published in last 3 years are scrutinized and analyzed to understand the current market trends.
- Primary Research:
The primarily interview analysis comprise of data obtained from industry participants interview and answers to survey questions gathered by in-house primary team.
For primary research, interviews are conducted with industry experts/CEOs/Marketing Managers/VPs/Subject Matter Experts from both demand and supply side to get a 360-degree view of the market. The primary team conducts several interviews based on the complexity of the markets to understand the various market trends and dynamics which makes research more credible and precise.
A typical research interview fulfils the following functions:
- Provides first-hand information on the market size, market trends, growth trends, competitive landscape, and outlook
- Validates and strengthens in-house secondary research findings
- Develops the analysis team’s expertise and market understanding
Primary research involves email interactions and telephone interviews for each market, category, segment, and sub-segment across geographies. The participants who typically take part in such a process include, but are not limited to:
- Industry participants: VPs, business development managers, market intelligence managers and national sales managers
- Outside experts: Valuation experts, research analysts and key opinion leaders specializing in the electronics and semiconductor industry.
Below is the breakup of our primary respondents by company, designation, and region:

Once we receive the confirmation from primary research sources or primary respondents, we finalize the base year market estimation and forecast the data as per the macroeconomic and microeconomic factors assessed during data collection.
- Data Analysis:
Once data is validated through both secondary as well as primary respondents, we finalize the market estimations by hypothesis formulation and factor analysis at regional and country level.
- Macro-Economic Factor Analysis:
We analyse macroeconomic indicators such the gross domestic product (GDP), increase in the demand for goods and services across industries, technological advancement, regional economic growth, governmental policies, the influence of COVID-19, PEST analysis, and other aspects. This analysis aids in setting benchmarks for various nations/regions and approximating market splits. Additionally, the general trend of the aforementioned components aid in determining the market's development possibilities.
- Country Level Data:
Various factors that are especially aligned to the country are taken into account to determine the market size for a certain area and country, including the presence of vendors, such as headquarters and offices, the country's GDP, demand patterns, and industry growth. To comprehend the market dynamics for the nation, a number of growth variables, inhibitors, application areas, and current market trends are researched. The aforementioned elements aid in determining the country's overall market's growth potential.
- Company Profile:
The “Table of Contents” is formulated by listing and analyzing more than 25 - 30 companies operating in the market ecosystem across geographies. However, we profile only 10 companies as a standard practice in our syndicate reports. These 10 companies comprise leading, emerging, and regional players. Nonetheless, our analysis is not restricted to the 10 listed companies, we also analyze other companies present in the market to develop a holistic view and understand the prevailing trends. The “Company Profiles” section in the report covers key facts, business description, products & services, financial information, SWOT analysis, and key developments. The financial information presented is extracted from the annual reports and official documents of the publicly listed companies. Upon collecting the information for the sections of respective companies, we verify them via various primary sources and then compile the data in respective company profiles. The company level information helps us in deriving the base number as well as in forecasting the market size.
- Developing Base Number:
Aggregation of sales statistics (2020-2022) and macro-economic factor, and other secondary and primary research insights are utilized to arrive at base number and related market shares for 2022. The data gaps are identified in this step and relevant market data is analyzed, collected from paid primary interviews or databases. On finalizing the base year market size, forecasts are developed on the basis of macro-economic, industry and market growth factors and company level analysis.
- Data Triangulation and Final Review:
The market findings and base year market size calculations are validated from supply as well as demand side. Demand side validations are based on macro-economic factor analysis and benchmarks for respective regions and countries. In case of supply side validations, revenues of major companies are estimated (in case not available) based on industry benchmark, approximate number of employees, product portfolio, and primary interviews revenues are gathered. Further revenue from target product/service segment is assessed to avoid overshooting of market statistics. In case of heavy deviations between supply and demand side values, all thes steps are repeated to achieve synchronization.
We follow an iterative model, wherein we share our research findings with Subject Matter Experts (SME’s) and Key Opinion Leaders (KOLs) until consensus view of the market is not formulated – this model negates any drastic deviation in the opinions of experts. Only validated and universally acceptable research findings are quoted in our reports.
We have important check points that we use to validate our research findings – which we call – data triangulation, where we validate the information, we generate from secondary sources with primary interviews and then we re-validate with our internal data bases and Subject matter experts. This comprehensive model enables us to deliver high quality, reliable data in shortest possible time.
 احصل على عينة مجانية لهذا التقرير