تحليل سوق إضافات الشحوم والتنبؤ به حسب الحجم والمشاركة والنمو والاتجاهات 2028

  • Report Code : TIPRE00012672
  • Category : Chemicals and Materials
  • Status : Published
  • No. of Pages : 201
Buy Now


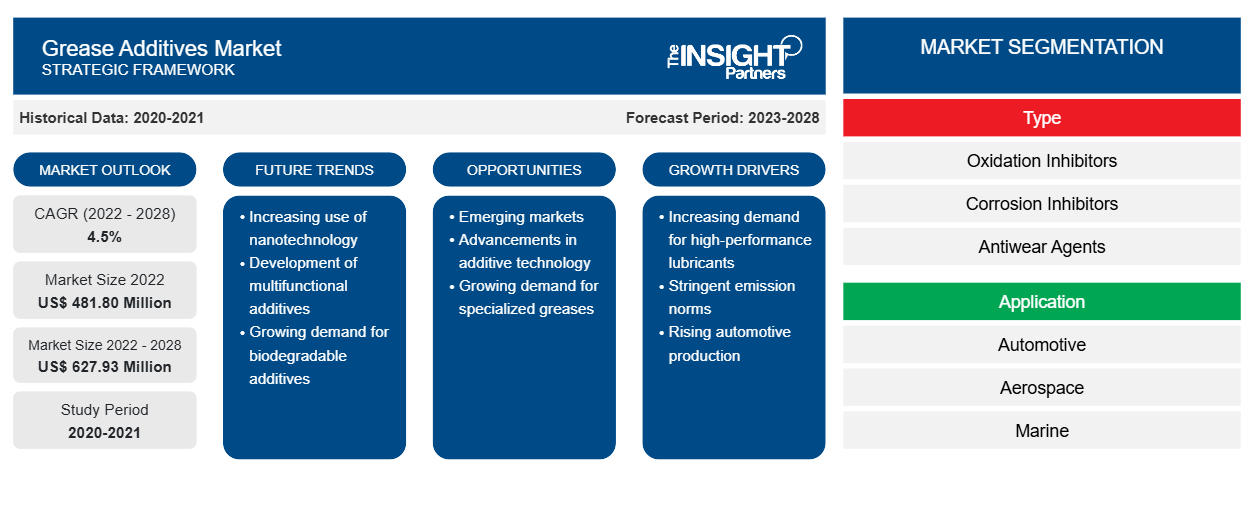
[تقرير بحثي] تم تقييم حجم سوق إضافات الشحوم بـ 481.80 مليون دولار أمريكي في عام 2022 ومن المتوقع أن يصل إلى 627.93 مليون دولار أمريكي بحلول عام 2028؛ ومن المتوقع أن ينمو بمعدل نمو سنوي مركب قدره 4.5٪ من عام 2022 إلى عام 2028.

إضافات الشحوم عبارة عن مواد كيميائية عضوية أو غير عضوية تذوب أو تعلق في الزيت على شكل مواد صلبة. إن الزيادة الكبيرة في مبيعات سيارات الركاب والمركبات التجارية تدفع سوق إضافات الشحوم . تُستخدم إضافات الشحوم في الشحوم المستخدمة كمواد تشحيم لتحسين أداء المعدات وإطالة عمرها.

تتكون الشحوم الصناعية في المقام الأول من الزيت الأساسي والمكثف والمواد المضافة؛ والمواد المضافة هي ثاني أهم مكون بعد الزيت الأساسي. يتم استخدام ثلاثة أنواع من الزيوت الأساسية في تصنيع الشحوم: الزيت المعدني والزيت النباتي والزيت الصناعي. يتم تصنيع الشحوم الصناعية باستخدام زيوت صناعية مثل البولي ألفا أوليفين. وهي تستخدم على نطاق واسع في القطاع الصناعي، وخاصة في صناعة السيارات. خصائصها المتفوقة، وقدرتها على إحداث الاتساق التشغيلي، والتكاليف المعقولة تجعلها فئة مفضلة من مواد التشحيم. تُستخدم الشحوم الصناعية في التطبيقات التي تنطوي على درجات حرارة وأحمال وسرعات شديدة. تعمل إضافات الشحوم الصناعية على تعزيز الخصائص الفيزيائية والكيميائية عن طريق زيادة مؤشر اللزوجة، وخفض التقلب، وتقليل نقطة صب مواد التشحيم . تعد محسنات مؤشر اللزوجة، ومثبطات نقطة الصب، والمشتتات، والمنظفات بعض الفئات المستخدمة على نطاق واسع من المواد المضافة. مع الطلب المتزايد على الشحوم الصناعية، من المرجح أن ترتفع الحاجة إلى المواد المضافة لهذه الشحوم خلال فترة التنبؤ.

تعمل العديد من الجهات الرئيسية في السوق على تطوير إضافات للشحوم الاصطناعية لتحسين كفاءتها. على سبيل المثال، في سبتمبر 2022، أطلقت شركة كلاريانت إضافات الضغط الشديد/مضادات التآكل، ومحسنات التشحيم، ومثبطات التآكل، وعوامل التحييد، وصيغ إرشادية لسوائل تشغيل المعادن الاصطناعية بالكامل والتي تزيد من كفاءة الآلات. وبالتالي، مع الطلب المتزايد على الشحوم الاصطناعية، فإن الإضافات المستخدمة في هذه الشحوم تجلب اتجاهات جديدة إلى سوق إضافات الشحوم.

في عام 2022، استحوذت منطقة آسيا والمحيط الهادئ على أكبر حصة من سوق إضافات الشحوم ومن المتوقع أن تسجل أعلى معدل نمو سنوي مركب خلال فترة التوقعات. أوروبا هي منطقة جذابة أخرى وتمتلك حصة بارزة من السوق. يساهم التركيب المتزايد لمحطات طاقة الرياح البرية والبحرية، وزيادة حجم تصنيع السيارات في نمو سوق إضافات الشحوم في أوروبا. تشهد السويد وفنلندا وألمانيا وفرنسا ارتفاعًا ملحوظًا في تركيب توربينات الرياح، إلى جانب الطلب المتزايد على الطاقة المتجددة. وفقًا لـ WindEurope VZW / ASBL، سجلت أوروبا 19.1 جيجاوات من منشآت الرياح الجديدة في عام 2022، بما في ذلك حوالي 16.7 جيجاوات من المشاريع البرية و 2.5 جيجاوات من المشاريع البحرية. يستخدم الشحم لتحسين أداء توربينات الرياح لأنه يساعد في مقاومة التآكل والحرارة والطقس واللهب.


قم بتخصيص هذا التقرير ليناسب متطلباتك

ستحصل على تخصيص لأي تقرير - مجانًا - بما في ذلك أجزاء من هذا التقرير، أو تحليل على مستوى الدولة، وحزمة بيانات Excel، بالإضافة إلى الاستفادة من العروض والخصومات الرائعة للشركات الناشئة والجامعات

سوق إضافات الشحوم:

Grease Additives Market
  • احصل على أهم اتجاهات السوق الرئيسية لهذا التقرير.
    ستتضمن هذه العينة المجانية تحليلاً للبيانات، بدءًا من اتجاهات السوق وحتى التقديرات والتوقعات.


تأثير جائحة كوفيد-19 على سوق إضافات الشحوم

أثرت جائحة كوفيد-19 على الاقتصادات والصناعات في العديد من البلدان في جميع أنحاء العالم. أعاقت عمليات الإغلاق والقيود على السفر وإغلاق الشركات في أمريكا الشمالية وأوروبا ومنطقة آسيا والمحيط الهادئ وأمريكا الجنوبية والوسطى والشرق الأوسط وأفريقيا نمو العديد من الصناعات، بما في ذلك صناعة السيارات والبناء والفضاء والتعدين. أدى إغلاق وحدات التصنيع إلى اضطراب سلاسل التوريد العالمية وأنشطة التصنيع وجداول التسليم ومبيعات المنتجات الأساسية وغير الأساسية. شهدت العديد من الشركات تأخيرات في تسليم المنتجات وانخفاضًا في مبيعات منتجاتها في عام 2020. علاوة على ذلك، أجبر الحظر الذي فرضته حكومات دول مختلفة في أوروبا ومنطقة آسيا والمحيط الهادئ وأمريكا الشمالية على السفر الدولي الشركات على وقف خطط التعاون والشراكة مؤقتًا. أعاقت كل هذه العوامل العديد من الصناعات في عام 2020 وأوائل عام 2021، مما أدى إلى تقييد نمو أسواق متعددة، بما في ذلك سوق إضافات الشحوم.

خلال المرحلة الأولية من جائحة كوفيد-19، أدى تطبيق قيود الإغلاق وإغلاق وحدات التصنيع إلى نقص في الإنتاج، مما أدى إلى خلق فجوة بين الطلب والعرض. أعاقت هذه العوامل ربحية العديد من مصنعي إضافات الشحوم على نطاق صغير وكبير. في عام 2021، استأنفت العديد من الاقتصادات عملياتها حيث أعلنت حكومات دول مختلفة عن تخفيف القيود المفروضة سابقًا، مما عزز السوق العالمية. سُمح للمصنعين بالعمل بكامل طاقتهم، مما ساعدهم على التغلب على فجوة الطلب والعرض وغيرها من التداعيات. كان الطلب المتزايد على السيارات والآلات الصناعية بعد جائحة كوفيد-19 يولد الطلب على إضافات الشحوم.


رؤى السوق


التطورات الاستراتيجية التي يقوم بها اللاعبون الرئيسيون تدعم نمو سوق إضافات الشحوم

ويشارك اللاعبون الرئيسيون في السوق في تبني استراتيجيات تسويقية مختلفة مثل إطلاق المنتجات، والاندماجات والاستحواذات، والتعاون، مما يؤدي إلى نمو السوق.


رؤى النوع

بناءً على النوع، يتم تقسيم سوق إضافات الشحوم إلى مثبطات الأكسدة ومثبطات التآكل وعوامل مقاومة التآكل وإضافات الضغط ومزيلات المعادن وغيرها. احتل قطاع مثبطات الأكسدة أكبر حصة سوقية في عام 2022. ومن المتوقع أن يسجل قطاع إضافات الضغط أعلى معدل نمو سنوي مركب خلال فترة التوقعات. يُعزى نمو سوق إضافات الشحوم لقطاع إضافات الضغط إلى الطلب المتزايد على الشحوم في التطبيقات ذات ظروف الضغط العالي، بما في ذلك الطيران والبحرية والتعدين ومصانع الصلب. بالإضافة إلى ذلك، يؤكد حدوث التآكل الميكانيكي المتزايد في تطبيقات مختلفة على الحاجة إلى زيوت تشحيم فعّالة مكملة بإضافات شحوم مناسبة.

تعد Afton Chemical Corp وBASF SE وClariant AG وCroda International plc وEvonik Industries AG وShamrock Technologies Inc وThe Lubrizol Corp وRT Vanderbilt Holding Co Inc وLanxess AG وIPAC Inc من بين اللاعبين الرئيسيين العاملين في سوق إضافات الشحوم. تركز هذه الشركات بشكل أساسي على ابتكار المنتجات لتوسيع حجم سوقها ومتابعة اتجاهات السوق الناشئة.


رؤى إقليمية حول سوق إضافات الشحوم

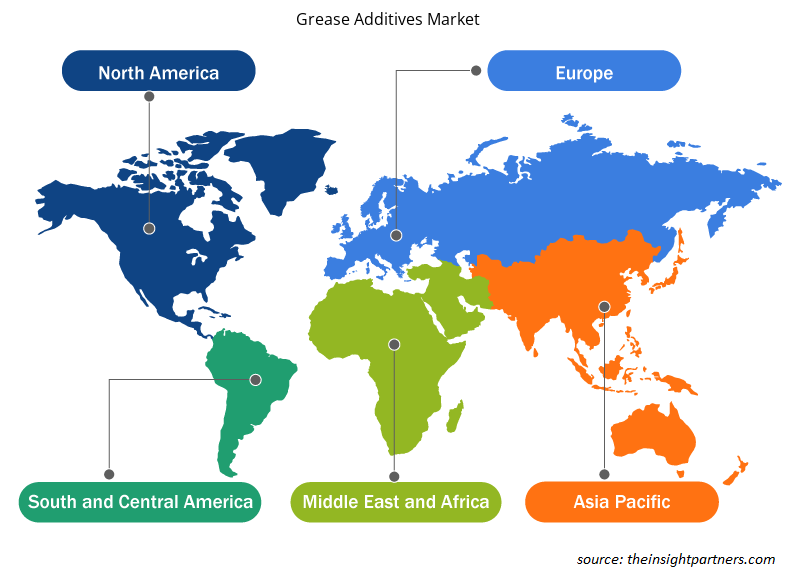
لقد قام المحللون في Insight Partners بشرح الاتجاهات والعوامل الإقليمية المؤثرة على سوق إضافات الشحوم طوال فترة التوقعات بشكل شامل. يناقش هذا القسم أيضًا قطاعات سوق إضافات الشحوم والجغرافيا في جميع أنحاء أمريكا الشمالية وأوروبا ومنطقة آسيا والمحيط الهادئ والشرق الأوسط وأفريقيا وأمريكا الجنوبية والوسطى.
Grease Additives Market
  • احصل على البيانات الإقليمية المحددة لسوق إضافات الشحوم

نطاق تقرير سوق إضافات الشحوم

سمة التقريرتفاصيل
حجم السوق في عام 2022481.80 مليون دولار أمريكي
حجم السوق بحلول عام 2028627.93 مليون دولار أمريكي
معدل النمو السنوي المركب العالمي (2022 - 2028)4.5%
البيانات التاريخية2020-2021
فترة التنبؤ2023-2028
القطاعات المغطاةحسب النوع
  • مثبطات الأكسدة
  • مثبطات التآكل
  • عوامل مقاومة التآكل
  • إضافات الضغط
  • مُعطلات المعادن
حسب الطلب
  • السيارات
  • الفضاء الجوي
  • بحري
  • التعدين
  • مصنع الصلب
  • آلات البناء
المناطق والدول المغطاةأمريكا الشمالية
  • نحن
  • كندا
  • المكسيك
أوروبا
  • المملكة المتحدة
  • ألمانيا
  • فرنسا
  • روسيا
  • إيطاليا
  • بقية أوروبا
آسيا والمحيط الهادئ
  • الصين
  • الهند
  • اليابان
  • أستراليا
  • بقية منطقة آسيا والمحيط الهادئ
أمريكا الجنوبية والوسطى
  • البرازيل
  • الأرجنتين
  • بقية أمريكا الجنوبية والوسطى
الشرق الأوسط وأفريقيا
  • جنوب أفريقيا
  • المملكة العربية السعودية
  • الامارات العربية المتحدة
  • بقية الشرق الأوسط وأفريقيا
قادة السوق وملفات تعريف الشركات الرئيسية
  •  
  • شركة أفتون للكيماويات
  • باسف اس اي
  • شركة كلاريانت ايه جي
  • شركة كرودا الدولية المحدودة
  • شركة إيفونيك للصناعات
  • شركة شامروك للتكنولوجيا
  • شركة لوبريزول
  • شركة آر تي فاندربيلت القابضة المحدودة
  • شركة لانكسيس ايه جي


كثافة اللاعبين في سوق إضافات الشحوم: فهم تأثيرها على ديناميكيات الأعمال

يشهد سوق إضافات الشحوم نموًا سريعًا، مدفوعًا بالطلب المتزايد من المستخدم النهائي بسبب عوامل مثل تفضيلات المستهلكين المتطورة والتقدم التكنولوجي والوعي المتزايد بفوائد المنتج. ومع ارتفاع الطلب، تعمل الشركات على توسيع عروضها والابتكار لتلبية احتياجات المستهلكين والاستفادة من الاتجاهات الناشئة، مما يؤدي إلى زيادة نمو السوق.

تشير كثافة اللاعبين في السوق إلى توزيع الشركات أو المؤسسات العاملة في سوق أو صناعة معينة. وهي تشير إلى عدد المنافسين (اللاعبين في السوق) الموجودين في مساحة سوق معينة نسبة إلى حجمها أو قيمتها السوقية الإجمالية.

الشركات الرئيسية العاملة في سوق إضافات الشحوم هي:

  1. شركة أفتون للكيماويات
  2. باسف اس اي
  3. شركة كلاريانت ايه جي
  4. شركة كرودا الدولية المحدودة
  5. شركة إيفونيك للصناعات

إخلاء المسؤولية : الشركات المذكورة أعلاه ليست مرتبة بأي ترتيب معين.

Grease Additives Market


  • احصل على نظرة عامة على أهم اللاعبين الرئيسيين في سوق إضافات الشحوم


تقرير يسلط الضوء على

  • اتجاهات الصناعة التقدمية في سوق إضافات الشحوم لمساعدة الشركات على تطوير استراتيجيات فعالة طويلة الأجل
  • استراتيجيات نمو الأعمال التي يتبناها لاعبو سوق إضافات الشحوم في البلدان المتقدمة والنامية
  • التحليل الكمي للسوق من 2020 إلى 2028
  • تقدير الطلب العالمي على إضافات الشحوم
  • تحليل قوى بورتر الخمس لتوضيح فعالية المشترين والموردين في سوق إضافات الشحوم
  • التطورات الأخيرة لفهم سيناريو السوق التنافسي
  • اتجاهات السوق وتوقعاته والعوامل التي تدفع أو تحد من نمو سوق إضافات الشحوم
  • المساعدة في عملية اتخاذ القرار من خلال تسليط الضوء على استراتيجيات السوق التي تدعم المصلحة التجارية
  • حجم سوق إضافات الشحوم في مختلف العقد
  • نظرة عامة تفصيلية وتقسيم السوق وديناميكيات النمو في صناعة إضافات الشحوم
  • حجم سوق إضافات الشحوم في مختلف المناطق مع فرص نمو واعدة
  • Historical Analysis (2 Years), Base Year, Forecast (7 Years) with CAGR
  • PEST and SWOT Analysis
  • Market Size Value / Volume - Global, Regional, Country
  • Industry and Competitive Landscape
  • Excel Dataset
Report Coverage
Report Coverage

Revenue forecast, Company Analysis, Industry landscape, Growth factors, and Trends

Segment Covered
Segment Covered

This text is related
to segments covered.

Regional Scope
Regional Scope

North America, Europe, Asia Pacific, Middle East & Africa, South & Central America

Country Scope
Country Scope

This text is related
to country scope.

Frequently Asked Questions


Can you list some of the major players operating in the global grease additives market?

The major players operating in the global grease additives market are Afton Chemical Corp, BASF SE, Clariant AG, Croda International plc, Evonik Industries AG, Shamrock Technologies Inc, The Lubrizol Corp, RT Vanderbilt Holding Co Inc, Lanxess AG, and IPAC Inc.

What are the opportunities for grease additives in the global market?

The renewable energy industry, a subsegment of the power sector, is emerging as a prominent consumer of industrial greases. Grease is primarily used in turbines and transformers in this industry. In recent years, the increasing demand for renewable energy has led to an upsurge in wind turbine installations worldwide. The IEA states that 830 GW of wind capacity was installed globally as of 2021, of which 93% were onshore systems while 7% were offshore wind farms.

What is the largest region within the global grease additives market?

Asia Pacific accounted for the largest share of the global grease additives market. Asia Pacific is one of the most significant regions for the grease additives market owing to growth in operations of industries such as automotive, wind energy, marine, aerospace, and construction, along with increased grease production.

Based on application, which segment is projected to grow at the fastest CAGR over the forecast period?

Based on application, construction machinery segment is projected to grow at the fastest CAGR over the forecast period. The growth of the segment is attributed to growing construction activities in emerging economies and rising renovation activities.

What are the key drivers for the growth of the global grease additives market?

The automotive industry has witnessed tremendous growth over the last few decades and is expected to rise steadily during the forecast period. According to a report published by the European Automobile Manufacturers’ Association (ACEA), global motor vehicle production increased by 1.3% from 2020 to 2021; 79.1 million motor vehicles, including 61.6 million passenger cars, were produced across the world in 2021. Thus, an upsurge in automobile manufacturing and the growing adoption of electric vehicles boost the demand for grease, thereby bolstering the grease additives market growth.

Based on the type, which segment held the largest revenue share?

Based on type, oxidation inhibitors segment held the largest revenue share. The growth of the segment is attributed to increasing demand from various end use industries including aerospace, automotive, mining, construction machinery, and others.

Trends and growth analysis reports related to Chemicals and Materials : READ MORE..   
Your data will never be shared with third parties, however, we may send you information from time to time about our products that may be of interest to you. By submitting your details, you agree to be contacted by us. You may contact us at any time to opt-out.

The List of Companies - Grease Additives Market

  1. Afton Chemical Corp
  2. BASF SE
  3. Clariant AG
  4. Croda International Plc
  5. Evonik Industries AG
  6. Shamrock Technologies Inc
  7. The Lubrizol Corp
  8. RT Vanderbilt Holding Co Inc
  9. Lanxess AG
  10. IPAC Inc

Buy Now  

The Insight Partners performs research in 4 major stages: Data Collection & Secondary Research, Primary Research, Data Analysis and Data Triangulation & Final Review.

  1. Data Collection and Secondary Research:

As a market research and consulting firm operating from a decade, we have published and advised several client across the globe. First step for any study will start with an assessment of currently available data and insights from existing reports. Further, historical and current market information is collected from Investor Presentations, Annual Reports, SEC Filings, etc., and other information related to company’s performance and market positioning are gathered from Paid Databases (Factiva, Hoovers, and Reuters) and various other publications available in public domain.

Several associations trade associates, technical forums, institutes, societies and organization are accessed to gain technical as well as market related insights through their publications such as research papers, blogs and press releases related to the studies are referred to get cues about the market. Further, white papers, journals, magazines, and other news articles published in last 3 years are scrutinized and analyzed to understand the current market trends.

  1. Primary Research:

The primarily interview analysis comprise of data obtained from industry participants interview and answers to survey questions gathered by in-house primary team.

For primary research, interviews are conducted with industry experts/CEOs/Marketing Managers/VPs/Subject Matter Experts from both demand and supply side to get a 360-degree view of the market. The primary team conducts several interviews based on the complexity of the markets to understand the various market trends and dynamics which makes research more credible and precise.

A typical research interview fulfils the following functions:

  • Provides first-hand information on the market size, market trends, growth trends, competitive landscape, and outlook
  • Validates and strengthens in-house secondary research findings
  • Develops the analysis team’s expertise and market understanding

Primary research involves email interactions and telephone interviews for each market, category, segment, and sub-segment across geographies. The participants who typically take part in such a process include, but are not limited to:

  • Industry participants: VPs, business development managers, market intelligence managers and national sales managers
  • Outside experts: Valuation experts, research analysts and key opinion leaders specializing in the electronics and semiconductor industry.

Below is the breakup of our primary respondents by company, designation, and region:

Research Methodology

Once we receive the confirmation from primary research sources or primary respondents, we finalize the base year market estimation and forecast the data as per the macroeconomic and microeconomic factors assessed during data collection.

  1. Data Analysis:

Once data is validated through both secondary as well as primary respondents, we finalize the market estimations by hypothesis formulation and factor analysis at regional and country level.

  • Macro-Economic Factor Analysis:

We analyse macroeconomic indicators such the gross domestic product (GDP), increase in the demand for goods and services across industries, technological advancement, regional economic growth, governmental policies, the influence of COVID-19, PEST analysis, and other aspects. This analysis aids in setting benchmarks for various nations/regions and approximating market splits. Additionally, the general trend of the aforementioned components aid in determining the market's development possibilities.

  • Country Level Data:

Various factors that are especially aligned to the country are taken into account to determine the market size for a certain area and country, including the presence of vendors, such as headquarters and offices, the country's GDP, demand patterns, and industry growth. To comprehend the market dynamics for the nation, a number of growth variables, inhibitors, application areas, and current market trends are researched. The aforementioned elements aid in determining the country's overall market's growth potential.

  • Company Profile:

The “Table of Contents” is formulated by listing and analyzing more than 25 - 30 companies operating in the market ecosystem across geographies. However, we profile only 10 companies as a standard practice in our syndicate reports. These 10 companies comprise leading, emerging, and regional players. Nonetheless, our analysis is not restricted to the 10 listed companies, we also analyze other companies present in the market to develop a holistic view and understand the prevailing trends. The “Company Profiles” section in the report covers key facts, business description, products & services, financial information, SWOT analysis, and key developments. The financial information presented is extracted from the annual reports and official documents of the publicly listed companies. Upon collecting the information for the sections of respective companies, we verify them via various primary sources and then compile the data in respective company profiles. The company level information helps us in deriving the base number as well as in forecasting the market size.

  • Developing Base Number:

Aggregation of sales statistics (2020-2022) and macro-economic factor, and other secondary and primary research insights are utilized to arrive at base number and related market shares for 2022. The data gaps are identified in this step and relevant market data is analyzed, collected from paid primary interviews or databases. On finalizing the base year market size, forecasts are developed on the basis of macro-economic, industry and market growth factors and company level analysis.

  1. Data Triangulation and Final Review:

The market findings and base year market size calculations are validated from supply as well as demand side. Demand side validations are based on macro-economic factor analysis and benchmarks for respective regions and countries. In case of supply side validations, revenues of major companies are estimated (in case not available) based on industry benchmark, approximate number of employees, product portfolio, and primary interviews revenues are gathered. Further revenue from target product/service segment is assessed to avoid overshooting of market statistics. In case of heavy deviations between supply and demand side values, all thes steps are repeated to achieve synchronization.

We follow an iterative model, wherein we share our research findings with Subject Matter Experts (SME’s) and Key Opinion Leaders (KOLs) until consensus view of the market is not formulated – this model negates any drastic deviation in the opinions of experts. Only validated and universally acceptable research findings are quoted in our reports.

We have important check points that we use to validate our research findings – which we call – data triangulation, where we validate the information, we generate from secondary sources with primary interviews and then we re-validate with our internal data bases and Subject matter experts. This comprehensive model enables us to deliver high quality, reliable data in shortest possible time.