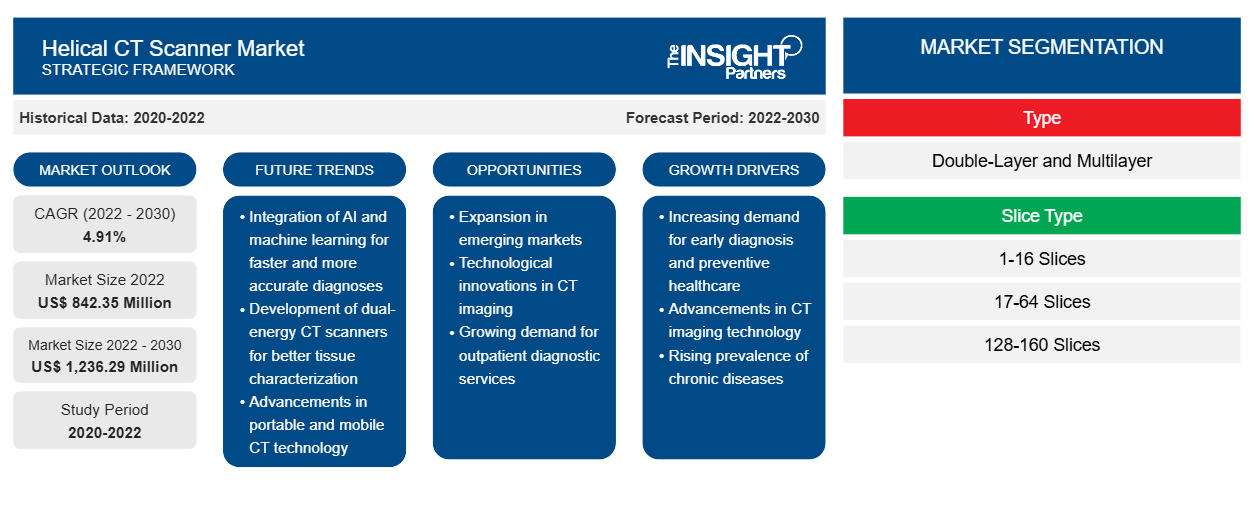
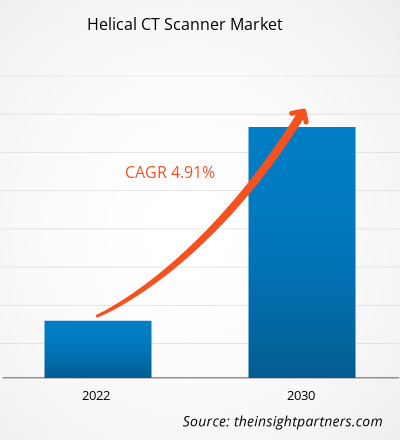
[تقرير بحثي] من المتوقع أن تنمو القيمة السوقية لجهاز المسح المقطعي الحلزوني من 842.35 مليون دولار أمريكي في عام 2022 إلى 1،236.29 مليون دولار أمريكي بحلول عام 2030؛ ومن المتوقع أن يسجل السوق معدل نمو سنوي مركب بنسبة 4.91٪ من عام 2022 إلى عام 2030.
رؤى السوق ووجهة نظر المحلل:
يمكن أن تساعد توقعات سوق ماسح التصوير المقطعي الحلزوني المقدمة في هذا التقرير أصحاب المصلحة في هذا السوق في التخطيط لاستراتيجيات النمو الخاصة بهم.
أجهزة التصوير المقطعي الحلزونية، أو أجهزة التصوير المقطعي الحلزونية، هي أجهزة تصوير طبية متقدمة تستخدم طريقة المسح الحلزوني لإنتاج صور مقطعية تفصيلية للجسم. ومع انتشار الأمراض المزمنة واضطرابات القلب والأوعية الدموية بشكل متزايد، تزداد الحاجة إلى أدوات تشخيص دقيقة وفعالة، مثل أجهزة التصوير المقطعي الحلزونية. وعلى عكس أجهزة التصوير المقطعي التقليدية، تتميز أجهزة التصوير المقطعي الحلزونية بالدوران المستمر لمصدر الأشعة السينية وأجهزة الكشف حول المريض.
إن التركيز المتزايد على قدرات التصوير المتقدمة والطلب على دقة مكانية أعلى مع وقت مسح أسرع في التصوير التشخيصي هي العوامل الرئيسية التي تدفع نمو سوق ماسح التصوير المقطعي الحلزوني. علاوة على ذلك، فإن الاستحواذ المستمر على البيانات بواسطة هذه الماسحات الضوئية يسمح بإنشاء صور ثلاثية الأبعاد عالية الدقة، مما يتيح تصورًا محسنًا للهياكل الداخلية. تستمر التطورات التكنولوجية المستمرة في تقنيات الكشف وتقنيات تقليل الجرعة وخوارزميات إعادة بناء الصور في تحسين أداء وسلامة ماسحات التصوير المقطعي الحلزونية . تشمل اتجاهات سوق ماسح التصوير المقطعي الحلزوني دمج الذكاء الاصطناعي والتعلم الآلي في ماسحات التصوير المقطعي الحلزونية.
محركات النمو والتحديات:
زيادة انتشار الأمراض المزمنة تغذي سوق أجهزة التصوير المقطعي الحلزوني
يؤدي ارتفاع حالات اضطرابات القلب والأوعية الدموية والسرطان والحالات العصبية إلى الحاجة إلى أدوات تصوير تشخيصية متقدمة قادرة على توفير تصورات مفصلة ودقيقة للهياكل التشريحية الداخلية. وفقًا للمركز الوطني لإحصاءات الصحة، تم الإبلاغ عن حوالي 1.9 مليون حالة إصابة بالسرطان جديدة في الولايات المتحدة في عام 2021. التصوير المقطعي المحوسب هو أحد تقنيات التصوير الموثوقة المستخدمة في تشخيص السرطان. وفقًا لمقال نشرته Harvard Health في سبتمبر 2021، يتم إجراء ما يقرب من 90.0 مليون عملية فحص بالأشعة المقطعية في الولايات المتحدة سنويًا. علاوة على ذلك، أفاد المعهد الوطني للسرطان (NCI) أن تجربة فحص الرئة الوطنية (NLST)، التي يمولها المعهد الوطني للسرطان، كشفت أن الأفراد الذين تتراوح أعمارهم بين 55 و 74 عامًا ولديهم تاريخ من التدخين المفرط لديهم خطر أقل بنسبة 20٪ للوفاة من سرطان الرئة بعد فحصهم بالأشعة المقطعية الحلزونية منخفضة الجرعة مقارنة بمن يتم فحصهم بالأشعة السينية القياسية للصدر. يُعتقد أن الأشخاص الذين لم يستخدموا منتجات التبغ أبدًا لديهم فرصة منخفضة جدًا للإصابة بسرطان الرئة للاستفادة من فحص سرطان الرئة.
بفضل قدرتها على التقاط صور ثلاثية الأبعاد شاملة توفر مناظر مقطعية ديناميكية، تلعب أجهزة التصوير المقطعي المحوسب الحلزونية دورًا محوريًا في تشخيص هذه الأمراض وتحديد مراحلها ومراقبتها. إن تنوعها وتطبيقاتها الواسعة في مختلف التخصصات السريرية تجعلها لا غنى عنها في الكشف عن الأورام وتقييم الحالات الوعائية والتصوير التشخيصي الشامل . ومع زيادة عبء السرطان والأمراض المزمنة الأخرى، أصبح الطلب على حلول التشخيص الدقيقة والفعالة التي توفرها أجهزة التصوير المقطعي المحوسب الحلزونية أكثر وضوحًا من أي وقت مضى. وبالتالي، فإن الانتشار المتزايد للأمراض المزمنة والحالات الطبية المعقدة يعزز حجم سوق أجهزة التصوير المقطعي المحوسب الحلزونية.
يتطلب اقتناء وتركيب أنظمة التصوير المتقدمة هذه استثمارات أولية ضخمة. ونتيجة لهذا، فإن العديد من مرافق الرعاية الصحية، وخاصة تلك الموجودة في البلدان الحساسة للتكاليف أو تلك التي تتمتع بموارد مالية محدودة، تبدي تردداً في تبني هذه المعدات.تشمل النفقات الرأسمالية المرتفعة شراء الماسح الضوئي، والتكاليف المرتبطة بتخطيط الموقع، وتعديلات البنية التحتية، والتركيب، وتدريب الموظفين. بالإضافة إلى ذلك، تساهم نفقات الصيانة والترقيات وتدريب الموظفين في إجمالي تكلفة الملكية. غالبًا ما تشكل مثل هذه الالتزامات المالية تحديات لمقدمي الرعاية الصحية، وخاصة في العيادات والمرافق الأصغر حجمًا، في تبني أجهزة المسح الضوئي المقطعي الحلزوني، مما يحد من توفرها على نطاق واسع وإمكانية الوصول إليها. قد تتضمن الجهود المبذولة لمعالجة حاجز التكلفة استكشاف خيارات التمويل ونماذج الشراء الفعالة من حيث التكلفة والشراكات التعاونية لجعل هذه الأدوات التشخيصية الأساسية أكثر قابلية للوصول لمجموعة أوسع من إعدادات الرعاية الصحية. ومع ذلك، فإن تكلفة التركيب المرتفعة المرتبطة بأنظمة المسح هذه تعيق نمو سوق الماسح الضوئي المقطعي الحلزوني.
قم بتخصيص هذا التقرير ليناسب متطلباتك
ستحصل على تخصيص لأي تقرير - مجانًا - بما في ذلك أجزاء من هذا التقرير، أو تحليل على مستوى الدولة، وحزمة بيانات Excel، بالإضافة إلى الاستفادة من العروض والخصومات الرائعة للشركات الناشئة والجامعات
- احصل على أهم اتجاهات السوق الرئيسية لهذا التقرير.ستتضمن هذه العينة المجانية تحليلاً للبيانات، بدءًا من اتجاهات السوق وحتى التقديرات والتوقعات.
تقسيم التقرير ونطاقه:
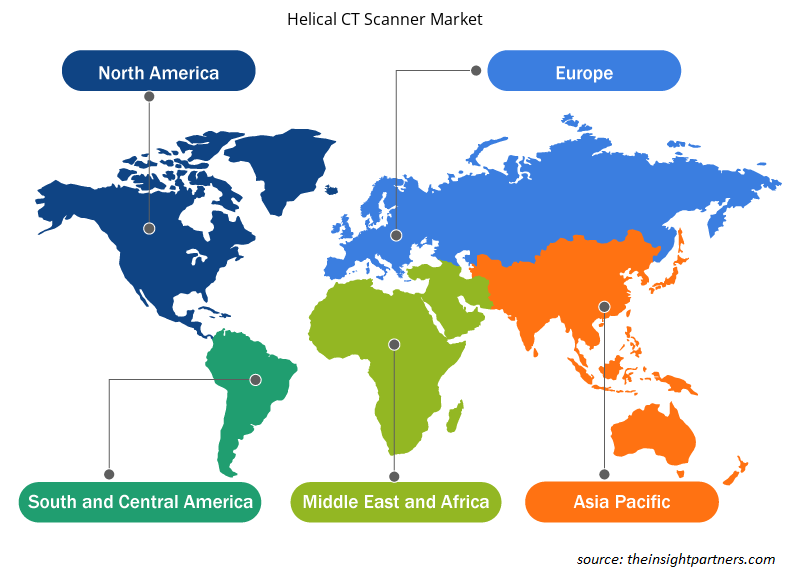
تم إجراء تحليل سوق ماسح الأشعة المقطعية الحلزوني من خلال النظر في القطاعات التالية:بناءً على النوع ونوع الشريحة والمستخدم النهائي. حسب النوع، ينقسم السوق إلى طبقتين ومتعددة الطبقات. بناءً على نوع الشريحة، ينقسم السوق إلى 1-16 شريحة، و17-64 شريحة، و128-160 شريحة، و> 160 شريحة. حسب المستخدم النهائي، يتم تقسيم السوق إلى مستشفيات ومراكز طبية ومراكز جراحية متنقلة. بناءً على الجغرافيا، يتم تقسيم سوق ماسح التصوير المقطعي الحلزوني إلى أمريكا الشمالية (الولايات المتحدة وكندا والمكسيك) وأوروبا (المملكة المتحدة وألمانيا وفرنسا وإيطاليا وإسبانيا وبقية أوروبا) وآسيا والمحيط الهادئ (الصين واليابان والهند وأستراليا وكوريا الجنوبية وبقية آسيا والمحيط الهادئ) والشرق الأوسط وأفريقيا (الإمارات العربية المتحدة والمملكة العربية السعودية وجنوب إفريقيا وبقية الشرق الأوسط وأفريقيا) وأمريكا الجنوبية والوسطى (البرازيل والأرجنتين وبقية أمريكا الجنوبية والوسطى).
التحليل القطاعي:
رؤى مبنية على النوع
بناءً على النوع، يتم تقسيم سوق ماسح التصوير المقطعي المحوسب الحلزوني بناءً على النوع إلى ماسحات ضوئية مقطعية ثابتة ومحمولة ثنائية الطبقات ومتعددة الطبقات. احتفظ قطاع الطبقات المتعددة بحصة سوقية أكبر لماسح التصوير المقطعي المحوسب الحلزوني في عام 2022. ومن المتوقع أن يسجل معدل نمو سنوي مركب أعلى خلال الفترة 2022-2030.
رؤى تعتمد على نوع الشريحة
ينقسم سوق ماسح التصوير المقطعي الحلزوني، بناءً على نوع الشريحة، إلى 1-16 شريحة، و17-64 شريحة، و128-160 شريحة، و> 160 شريحة. ومن المتوقع أن تحظى شريحة 17-63 شريحة بحصة كبيرة بحلول عام 2030.
رؤى تعتمد على المستخدم النهائي
من حيث المستخدمين النهائيين، يتم تصنيف سوق ماسح التصوير المقطعي الحلزوني إلى المستشفيات والمراكز الطبية ومراكز الجراحة الخارجية. من حيث المستخدمين النهائيين، احتل قطاع المستشفيات أكبر حصة في سوق ماسح التصوير المقطعي الحلزوني في عام 2022. ومن المتوقع أن يسجل أعلى معدل نمو سنوي مركب خلال الفترة 2022-2030.
رؤى إقليمية حول سوق أجهزة التصوير المقطعي الحلزوني
لقد قام المحللون في Insight Partners بشرح الاتجاهات والعوامل الإقليمية المؤثرة على سوق Helical CT Scanner طوال فترة التنبؤ بشكل شامل. يناقش هذا القسم أيضًا قطاعات سوق Helical CT Scanner والجغرافيا في جميع أنحاء أمريكا الشمالية وأوروبا ومنطقة آسيا والمحيط الهادئ والشرق الأوسط وأفريقيا وأمريكا الجنوبية والوسطى.

- احصل على البيانات الإقليمية المحددة لسوق أجهزة المسح المقطعي الحلزوني
نطاق تقرير سوق أجهزة التصوير المقطعي الحلزوني
| سمة التقرير | تفاصيل |
|---|---|
| حجم السوق في عام 2022 | 842.35 مليون دولار أمريكي |
| حجم السوق بحلول عام 2030 | 1,236.29 مليون دولار أمريكي |
| معدل النمو السنوي المركب العالمي (2022 - 2030) | 4.91% |
| البيانات التاريخية | 2020-2022 |
| فترة التنبؤ | 2022-2030 |
| القطاعات المغطاة | حسب النوع
|
| المناطق والدول المغطاة | أمريكا الشمالية
|
| قادة السوق وملفات تعريف الشركات الرئيسية |
|
كثافة اللاعبين في السوق: فهم تأثيرها على ديناميكيات الأعمال
يشهد سوق أجهزة المسح المقطعي الحلزوني نموًا سريعًا، مدفوعًا بالطلب المتزايد من المستخدم النهائي بسبب عوامل مثل تفضيلات المستهلكين المتطورة والتقدم التكنولوجي والوعي المتزايد بفوائد المنتج. ومع ارتفاع الطلب، تعمل الشركات على توسيع عروضها والابتكار لتلبية احتياجات المستهلكين والاستفادة من الاتجاهات الناشئة، مما يؤدي إلى زيادة نمو السوق.
تشير كثافة اللاعبين في السوق إلى توزيع الشركات أو المؤسسات العاملة في سوق أو صناعة معينة. وهي تشير إلى عدد المنافسين (اللاعبين في السوق) الموجودين في مساحة سوق معينة نسبة إلى حجمها أو قيمتها السوقية الإجمالية.
الشركات الرئيسية العاملة في سوق الماسح الضوئي المقطعي الحلزوني هي:
- شركة كانون للأنظمة الطبية
- شركة ترينيتي اكسيم المحدودة
- فوجي فيلم القابضة
- جنرال إلكتريك للرعاية الصحية
- شركة كارل زايس ايه جي
إخلاء المسؤولية : الشركات المذكورة أعلاه ليست مرتبة بأي ترتيب معين.

- احصل على نظرة عامة على أهم اللاعبين الرئيسيين في سوق الماسح الضوئي المقطعي الحلزوني
التحليل الإقليمي:
من حيث الجغرافيا، يشمل نطاق تقرير سوق ماسح التصوير المقطعي المحوسب الحلزوني أمريكا الشمالية وأوروبا ومنطقة آسيا والمحيط الهادئ والشرق الأوسط وأفريقيا وأمريكا الجنوبية والوسطى. استحوذت أمريكا الشمالية على أكبر حصة في سوق ماسح التصوير المقطعي المحوسب الحلزوني في عام 2022، ومن المتوقع أن تحافظ على هيمنتها (من حيث الحصة) خلال فترة التنبؤ. ينقسم السوق في أمريكا الشمالية إلى الولايات المتحدة وكندا والمكسيك. تمتلك الولايات المتحدة أكبر حصة من السوق في أمريكا الشمالية والعالم. يُعزى نمو السوق في هذا البلد إلى زيادة انتشار الأمراض الالتهابية، ووجود لاعبين رئيسيين في السوق، والتقدم المستمر في قطاع الرعاية الصحية، والوصول إلى أنظمة التصوير المقطعي المحوسب الحلزونية المبتكرة، والتطورات في تكنولوجيا التصوير المقطعي المحوسب.
المنافسة والشركات الرئيسية:
تعد شركة Canon Medical Systems Corporation، وTrinity Exim Limited، وFujifilm Holdings، وGE Healthcare، وCarl Zeiss AG، وPhilips، وShenzhen Anke، وShimadzu Corporation، وSiemens AG، وSternMed GmbH من بين الشركات الرئيسية التي تم عرضها في تقرير سوق أجهزة المسح المقطعي الحلزوني. تركز هذه الشركات على توسيع عروضها لتلبية الطلب المتزايد من المستهلكين في جميع أنحاء العالم. يسمح لها وجودها العالمي بخدمة العديد من العملاء، مما يسمح لها لاحقًا بتوسيع وجودها في السوق.
- التحليل التاريخي (سنتان)، السنة الأساسية، التوقعات (7 سنوات) مع معدل النمو السنوي المركب
- تحليل PEST و SWOT
- حجم السوق والقيمة / الحجم - عالميًا وإقليميًا وقطريًا
- الصناعة والمنافسة
- مجموعة بيانات Excel


Report Coverage
Revenue forecast, Company Analysis, Industry landscape, Growth factors, and Trends

Segment Covered
This text is related
to segments covered.

Regional Scope
North America, Europe, Asia Pacific, Middle East & Africa, South & Central America

Country Scope
This text is related
to country scope.
الأسئلة الشائعة
Increasing focus on advanced imaging capabilities and the demand for higher spatial resolution are the key factors driving the the helical CT scanner market growth. Furthermore, helical CT scanner market trends include increasing adoption of AI (Artificial Intelligence) and ML (Machine Learning) in helical CT scanners.
The helical CT scanner market is segmented based on type into double-layer and multi-layer stationary and portable CT scanners. The multi-layer segment held a larger market share in 2022 and is anticipated to register the highest CAGR during 2022–2030.
The helical CT scanner market, based on slice type, is bifurcated into 1-16 Slices 17-64 Slices,128-160 Slices, and >160 Slices. 17-63 Slices segment is anticipated to hold a significant helical CT scanner market share by 2030.
Helical CT scanners, or spiral CT scanners, are advanced medical imaging devices that utilize a helical scanning method to produce detailed cross-sectional images of the body. Unlike traditional CT scanners, helical scanners feature a continuous rotation of the X-ray source and detectors around the patient. In contrast, the patient table moves through the scanner in a helical or spiral path. This continuous data acquisition allows for the creation of high-resolution three-dimensional images, enabling enhanced visualization of internal structures.
The helical CT scanner market was valued at US$ 842.35 million in 2022.
The helical CT scanner market has major market players, including Canon Medical Systems Corporation, Trinity Exim Limited, Fujifilm Holdings, GE Healthcare, Carl Zeiss AG, Philips, Shenzhen Anke, Shimadzu Corporation, Siemens AG, and SternMed GmbH.
The helical CT scanner market is expected to be valued at US$ 1,236.29 million in 2030.
Trends and growth analysis reports related to Life Sciences : READ MORE..
The List of Companies - Helical CT Scanner Market
- Canon Medical Systems Corporation
- Trinity Exim Limited
- Fujifilm Holdings
- GE Healthcare
- Carl Zeiss AG
- Philips
- Shenzhen Anke
- Shimadzu Corporation
- Siemens AG
- SternMed GmbH
The Insight Partners performs research in 4 major stages: Data Collection & Secondary Research, Primary Research, Data Analysis and Data Triangulation & Final Review.
- Data Collection and Secondary Research:
As a market research and consulting firm operating from a decade, we have published and advised several client across the globe. First step for any study will start with an assessment of currently available data and insights from existing reports. Further, historical and current market information is collected from Investor Presentations, Annual Reports, SEC Filings, etc., and other information related to company’s performance and market positioning are gathered from Paid Databases (Factiva, Hoovers, and Reuters) and various other publications available in public domain.
Several associations trade associates, technical forums, institutes, societies and organization are accessed to gain technical as well as market related insights through their publications such as research papers, blogs and press releases related to the studies are referred to get cues about the market. Further, white papers, journals, magazines, and other news articles published in last 3 years are scrutinized and analyzed to understand the current market trends.
- Primary Research:
The primarily interview analysis comprise of data obtained from industry participants interview and answers to survey questions gathered by in-house primary team.
For primary research, interviews are conducted with industry experts/CEOs/Marketing Managers/VPs/Subject Matter Experts from both demand and supply side to get a 360-degree view of the market. The primary team conducts several interviews based on the complexity of the markets to understand the various market trends and dynamics which makes research more credible and precise.
A typical research interview fulfils the following functions:
- Provides first-hand information on the market size, market trends, growth trends, competitive landscape, and outlook
- Validates and strengthens in-house secondary research findings
- Develops the analysis team’s expertise and market understanding
Primary research involves email interactions and telephone interviews for each market, category, segment, and sub-segment across geographies. The participants who typically take part in such a process include, but are not limited to:
- Industry participants: VPs, business development managers, market intelligence managers and national sales managers
- Outside experts: Valuation experts, research analysts and key opinion leaders specializing in the electronics and semiconductor industry.
Below is the breakup of our primary respondents by company, designation, and region:

Once we receive the confirmation from primary research sources or primary respondents, we finalize the base year market estimation and forecast the data as per the macroeconomic and microeconomic factors assessed during data collection.
- Data Analysis:
Once data is validated through both secondary as well as primary respondents, we finalize the market estimations by hypothesis formulation and factor analysis at regional and country level.
- Macro-Economic Factor Analysis:
We analyse macroeconomic indicators such the gross domestic product (GDP), increase in the demand for goods and services across industries, technological advancement, regional economic growth, governmental policies, the influence of COVID-19, PEST analysis, and other aspects. This analysis aids in setting benchmarks for various nations/regions and approximating market splits. Additionally, the general trend of the aforementioned components aid in determining the market's development possibilities.
- Country Level Data:
Various factors that are especially aligned to the country are taken into account to determine the market size for a certain area and country, including the presence of vendors, such as headquarters and offices, the country's GDP, demand patterns, and industry growth. To comprehend the market dynamics for the nation, a number of growth variables, inhibitors, application areas, and current market trends are researched. The aforementioned elements aid in determining the country's overall market's growth potential.
- Company Profile:
The “Table of Contents” is formulated by listing and analyzing more than 25 - 30 companies operating in the market ecosystem across geographies. However, we profile only 10 companies as a standard practice in our syndicate reports. These 10 companies comprise leading, emerging, and regional players. Nonetheless, our analysis is not restricted to the 10 listed companies, we also analyze other companies present in the market to develop a holistic view and understand the prevailing trends. The “Company Profiles” section in the report covers key facts, business description, products & services, financial information, SWOT analysis, and key developments. The financial information presented is extracted from the annual reports and official documents of the publicly listed companies. Upon collecting the information for the sections of respective companies, we verify them via various primary sources and then compile the data in respective company profiles. The company level information helps us in deriving the base number as well as in forecasting the market size.
- Developing Base Number:
Aggregation of sales statistics (2020-2022) and macro-economic factor, and other secondary and primary research insights are utilized to arrive at base number and related market shares for 2022. The data gaps are identified in this step and relevant market data is analyzed, collected from paid primary interviews or databases. On finalizing the base year market size, forecasts are developed on the basis of macro-economic, industry and market growth factors and company level analysis.
- Data Triangulation and Final Review:
The market findings and base year market size calculations are validated from supply as well as demand side. Demand side validations are based on macro-economic factor analysis and benchmarks for respective regions and countries. In case of supply side validations, revenues of major companies are estimated (in case not available) based on industry benchmark, approximate number of employees, product portfolio, and primary interviews revenues are gathered. Further revenue from target product/service segment is assessed to avoid overshooting of market statistics. In case of heavy deviations between supply and demand side values, all thes steps are repeated to achieve synchronization.
We follow an iterative model, wherein we share our research findings with Subject Matter Experts (SME’s) and Key Opinion Leaders (KOLs) until consensus view of the market is not formulated – this model negates any drastic deviation in the opinions of experts. Only validated and universally acceptable research findings are quoted in our reports.
We have important check points that we use to validate our research findings – which we call – data triangulation, where we validate the information, we generate from secondary sources with primary interviews and then we re-validate with our internal data bases and Subject matter experts. This comprehensive model enables us to deliver high quality, reliable data in shortest possible time.


 احصل على عينة مجانية لهذا التقرير