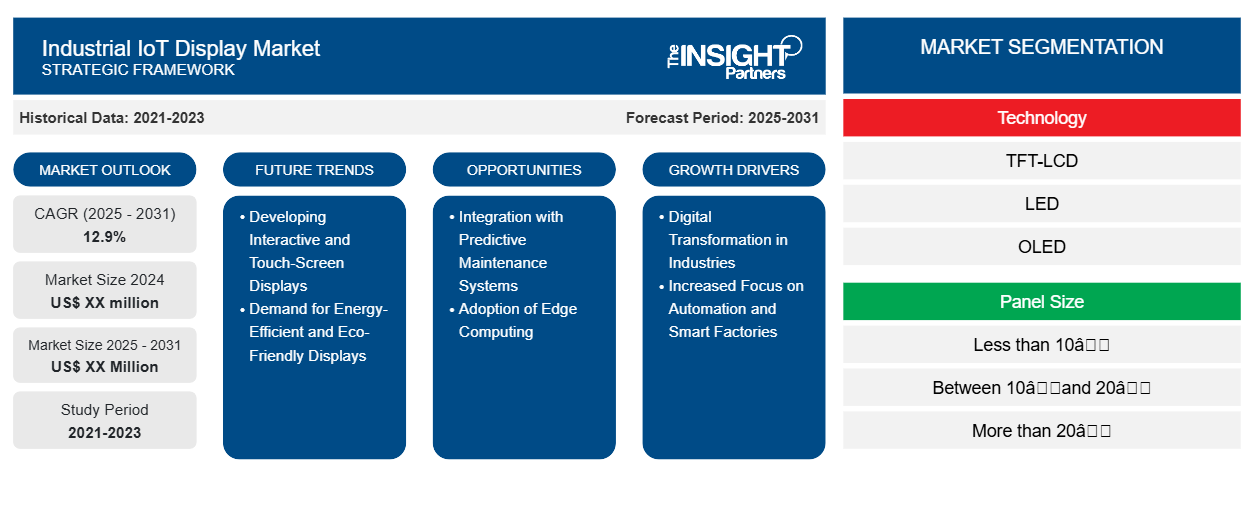
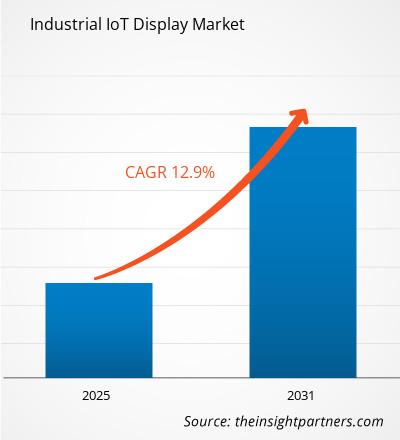
من المتوقع أن يسجل سوق شاشات إنترنت الأشياء الصناعية معدل نمو سنوي مركب بنسبة 12.9٪ من عام 2025 إلى عام 2031، مع توسع حجم السوق من XX مليون دولار أمريكي في عام 2024 إلى XX مليون دولار أمريكي بحلول عام 2031.
يُقسّم التقرير حسب التكنولوجيا (شاشات TFT-LCD، LED، OLED، شاشات الورق الإلكتروني)؛ حجم الشاشة (أقل من 10 بوصات، بين 10 بوصات و20 بوصة، وأكثر من 20 بوصة)؛ التطبيق (واجهة الإنسان والآلة، المراقبة عن بُعد، الشاشات التفاعلية، ملصقات الرفوف الإلكترونية، وغيرها)؛ الصناعة (التصنيع، الرعاية الصحية، الطاقة والكهرباء، النقل، وغيرها). ويُفصّل التحليل العالمي بشكل أكبر على المستوى الإقليمي والدول الرئيسية. يُقدّم التقرير القيمة بالدولار الأمريكي للتحليل والقطاعات المذكورة أعلاه.
غرض التقرير
يهدف تقرير "سوق شاشات إنترنت الأشياء الصناعية" الصادر عن "ذا إنسايت بارتنرز" إلى وصف المشهد الحالي والنمو المستقبلي، وأهم العوامل المحفزة، والتحديات، والفرص المتاحة. وسيوفر هذا التقرير رؤى ثاقبة لمختلف أصحاب المصلحة في قطاع الأعمال، مثل:
- مزودي التكنولوجيا/المصنعين: لفهم ديناميكيات السوق المتطورة ومعرفة فرص النمو المحتملة، وتمكينهم من اتخاذ قرارات استراتيجية مستنيرة.
- المستثمرون: إجراء تحليل شامل للاتجاهات فيما يتعلق بمعدل نمو السوق، والتوقعات المالية للسوق، والفرص المتاحة عبر سلسلة القيمة.
- الهيئات التنظيمية: لتنظيم السياسات ومراقبة الأنشطة في السوق بهدف تقليل الانتهاكات والحفاظ على ثقة المستثمرين ودعم سلامة السوق واستقرارها.
تجزئة سوق شاشات إنترنت الأشياء الصناعية
تكنولوجيا
- شاشة TFT-LCD
- قاد
- شاشة OLED
- عرض الورق الإلكتروني
حجم اللوحة
- أقل من 10 بوصة
- بين 10 و 20 بوصة
- أكثر من 20 بوصة
طلب
- واجهة الإنسان والآلة
- المراقبة عن بعد
- شاشة عرض تفاعلية
- ملصقات الرفوف الإلكترونية
صناعة
- تصنيع
- الرعاية الصحية
- الطاقة والقوة
- مواصلات
قم بتخصيص هذا التقرير ليناسب متطلباتك
ستحصل على تخصيص لأي تقرير - مجانًا - بما في ذلك أجزاء من هذا التقرير، أو تحليل على مستوى الدولة، وحزمة بيانات Excel، بالإضافة إلى الاستفادة من العروض والخصومات الرائعة للشركات الناشئة والجامعات
سوق شاشات إنترنت الأشياء الصناعية: رؤى استراتيجية
- احصل على أهم اتجاهات السوق الرئيسية لهذا التقرير.ستتضمن هذه العينة المجانية تحليل البيانات، بدءًا من اتجاهات السوق وحتى التقديرات والتوقعات.
عوامل نمو سوق شاشات إنترنت الأشياء الصناعية
- التحول الرقمي في الصناعات: تتبنى قطاعات مثل التصنيع والخدمات اللوجستية والنفط والغاز والطاقة التقنيات الرقمية بشكل متزايد لتعزيز الكفاءة التشغيلية وتقليل فترات التوقف. وقد ازدادت أهمية التصور الفوري للبيانات مع دمج مستشعرات إنترنت الأشياء والأجهزة المتصلة في بيئات الإنتاج. وتلعب الشاشات دورًا هامًا في هذه العملية، إذ تزود المشغلين والعمال برؤى أساسية، وتمكّنهم من مراقبة العمليات بكفاءة. كما تعرض الشاشات بيانات من الأجهزة والأنظمة المتصلة، مما يسمح للمستخدمين باتخاذ قرارات مبنية على البيانات للصيانة التنبؤية، وتحسين العمليات، والمراقبة عن بُعد.
- زيادة التركيز على الأتمتة والمصانع الذكية: أدى صعود الصناعة 4.0، التي تركز على الأتمتة والمصانع الذكية، إلى زيادة الطلب على حلول إنترنت الأشياء الصناعي (IIoT)، بما في ذلك الشاشات المتطورة. تتطلب الأنظمة الآلية والروبوتات والتطبيقات المدعومة بالذكاء الاصطناعي واجهات مستخدم بديهية (UI) لتوفير تغذية راجعة آنية. تساعد شاشات إنترنت الأشياء الصناعي، التي تتكامل مع مختلف أجهزة الاستشعار ووحدات التحكم وأنظمة المؤسسات، المشغلين والمديرين على تصور مقاييس الأداء، وإعدادات التحكم، واستكشاف الأخطاء وإصلاحها عن بُعد، مما يعزز الكفاءة ويقلل من الأخطاء البشرية.
اتجاهات مستقبل سوق شاشات إنترنت الأشياء الصناعية
- تطوير شاشات العرض التفاعلية واللمسية: شهدنا تحولًا ملحوظًا نحو شاشات العرض التفاعلية التي تعمل باللمس، والتي تتيح للمشغلين التفاعل بفعالية مع البيانات المعروضة. توفر هذه الشاشات واجهة استخدام أكثر سهولة، مما يتيح تحكمًا سلسًا والوصول إلى البيانات في الوقت الفعلي. يُعد هذا التوجه بالغ الأهمية في السياقات التي تتطلب اتخاذ قرارات سريعة والتفاعل السلس مع البيانات المعقدة. تتميز واجهات العرض اللمسية بسهولة الاستخدام، مما يقلل من وقت التدريب ويزيد من كفاءة التشغيل.
- الطلب على شاشات موفرة للطاقة وصديقة للبيئة: مع تزايد أهمية الاستدامة في العمليات الصناعية، يتزايد الطلب على الشاشات الموفرة للطاقة التي تستهلك طاقة أقل وتأثيرها البيئي أقل. يعمل مصنعو شاشات إنترنت الأشياء الصناعي على ابتكار شاشات صديقة للبيئة تستخدم مكونات منخفضة الطاقة، وتقنيات إضاءة خلفية موفرة للطاقة (مثل OLED و LED)، ومواد قابلة لإعادة التدوير. يتماشى هذا التوجه مع أهداف الاستدامة العامة للصناعة، وقد يحفز الطلب على المنتجات الصديقة للبيئة.
فرص سوق شاشات إنترنت الأشياء الصناعية
- التكامل مع أنظمة الصيانة التنبؤية: تكتسب حلول الصيانة التنبؤية (PdM) زخمًا متزايدًا مع سعي الشركات إلى تقليل فترات التوقف وزيادة الإنتاجية. تُوفر شاشات إنترنت الأشياء الصناعي (IIoT) المدمجة مع أنظمة الصيانة التنبؤية للمشغلين تنبيهات آنية ومعلومات ثاقبة حول حالة المعدات. تكمن الفرصة في تصميم شاشات تعمل بسلاسة مع خوارزميات الصيانة التنبؤية، مما يوفر للمستخدمين تشخيصات مفصلة وعلامات تحذيرية وبيانات عملية لمنع الأعطال قبل وقوعها.
- اعتماد الحوسبة الطرفية: مع تطور تكنولوجيا الحوسبة الطرفية، أصبح بالإمكان إجراء المزيد من عمليات المعالجة والتحليلات في مواقع أقرب إلى مصدر البيانات، مما يقلل من زمن الوصول. وتتصل شاشات إنترنت الأشياء الصناعي (IIoT) مباشرةً بأجهزة الحافة لتقديم معلومات آنية للمشغلين دون الاعتماد على الأنظمة السحابية. يُسرّع هذا التحول من الحوسبة السحابية إلى الحوسبة الطرفية عملية اتخاذ القرار، مما يتيح استجابات أسرع وقرارات محلية أكثر على مستوى الجهاز أو الآلة. وهذا يُعزز نمو سوق شاشات إنترنت الأشياء الصناعي (IIoT).
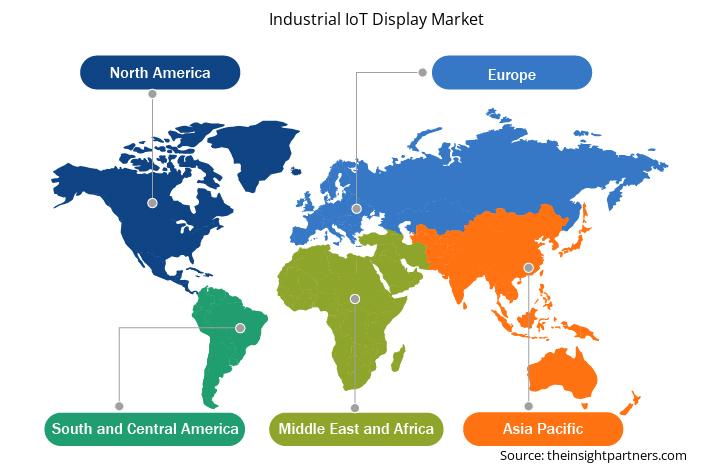
رؤى إقليمية حول سوق شاشات إنترنت الأشياء الصناعية
قام محللو إنسايت بارتنرز بشرح شامل للاتجاهات الإقليمية والعوامل المؤثرة في سوق شاشات إنترنت الأشياء الصناعية خلال فترة التوقعات. ويناقش هذا القسم أيضًا قطاعات سوق شاشات إنترنت الأشياء الصناعية ونطاقها الجغرافي في أمريكا الشمالية، وأوروبا، وآسيا والمحيط الهادئ، والشرق الأوسط وأفريقيا، وأمريكا الجنوبية والوسطى.
- احصل على البيانات الإقليمية المحددة لسوق شاشات إنترنت الأشياء الصناعية
نطاق تقرير سوق شاشات إنترنت الأشياء الصناعية
| سمة التقرير | تفاصيل |
|---|---|
| حجم السوق في عام 2024 | XX مليون دولار أمريكي |
| حجم السوق بحلول عام 2031 | XX مليون دولار أمريكي |
| معدل النمو السنوي المركب العالمي (2025 - 2031) | 12.9% |
| البيانات التاريخية | 2021-2023 |
| فترة التنبؤ | 2025-2031 |
| القطاعات المغطاة | حسب التكنولوجيا
|
| المناطق والدول المغطاة | أمريكا الشمالية
|
| قادة السوق وملفات تعريف الشركات الرئيسية |
|
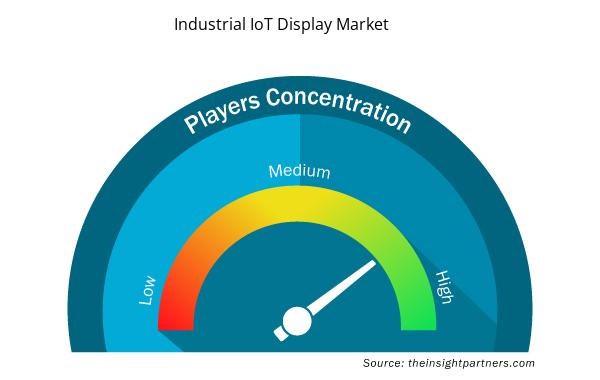
كثافة اللاعبين في سوق شاشات إنترنت الأشياء الصناعية: فهم تأثيرها على ديناميكيات الأعمال
يشهد سوق شاشات إنترنت الأشياء الصناعية نموًا سريعًا، مدفوعًا بتزايد طلب المستخدم النهائي نتيجةً لعوامل مثل تطور تفضيلات المستهلكين، والتقدم التكنولوجي، وزيادة الوعي بمزايا المنتج. ومع تزايد الطلب، تعمل الشركات على توسيع عروضها، والابتكار لتلبية احتياجات المستهلكين، والاستفادة من الاتجاهات الناشئة، مما يعزز نمو السوق.
تشير كثافة اللاعبين في السوق إلى توزيع الشركات العاملة في سوق أو قطاع معين. وتشير إلى عدد المنافسين (اللاعبين في السوق) الموجودين في سوق معين نسبةً إلى حجمه أو قيمته السوقية الإجمالية.
الشركات الرئيسية العاملة في سوق شاشات إنترنت الأشياء الصناعية هي:
- شركة إي إنك القابضة
- مجموعة بي أو إي للتكنولوجيا المحدودة
- شركة أدفانتيك المحدودة
- بيبرل+فوكس إس إي
- شركة شارب
- شركة بلانار سيستمز
إخلاء المسؤولية : الشركات المذكورة أعلاه ليست مرتبة بأي ترتيب معين.
- احصل على نظرة عامة على أهم اللاعبين الرئيسيين في سوق شاشات إنترنت الأشياء الصناعية
نقاط البيع الرئيسية
- التغطية الشاملة: يغطي التقرير بشكل شامل تحليل المنتجات والخدمات والأنواع والمستخدمين النهائيين لسوق شاشات إنترنت الأشياء الصناعية، مما يوفر مشهدًا شاملاً.
- تحليل الخبراء: تم تجميع التقرير على أساس الفهم العميق لخبراء الصناعة والمحللين.
- معلومات محدثة: يضمن التقرير أهمية الأعمال التجارية بسبب تغطيته للمعلومات الحديثة واتجاهات البيانات.
- خيارات التخصيص: يمكن تخصيص هذا التقرير لتلبية متطلبات العملاء المحددة وتلبية استراتيجيات العمل بشكل مناسب.
لذا، يُمكن لتقرير البحث حول سوق شاشات إنترنت الأشياء الصناعية أن يُساعد في تمهيد الطريق لفهم سيناريوهات الصناعة وآفاق نموها. ورغم وجود بعض المخاوف المُبررة، إلا أن فوائد هذا التقرير الإجمالية تفوق عيوبه.
- التحليل التاريخي (سنتان)، السنة الأساسية، التوقعات (7 سنوات) مع معدل النمو السنوي المركب
- تحليل PEST و SWOT
- حجم السوق والقيمة / الحجم - عالميًا وإقليميًا وقطريًا
- الصناعة والمنافسة
- مجموعة بيانات Excel


- Virtual Pipeline Systems Market
- Explosion-Proof Equipment Market
- USB Device Market
- Railway Braking System Market
- Fish Protein Hydrolysate Market
- Aircraft Wire and Cable Market
- Health Economics and Outcome Research (HEOR) Services Market
- Smart Mining Market
- Dairy Flavors Market
- Formwork System Market

Report Coverage
Revenue forecast, Company Analysis, Industry landscape, Growth factors, and Trends

Segment Covered
This text is related
to segments covered.

Regional Scope
North America, Europe, Asia Pacific, Middle East & Africa, South & Central America

Country Scope
This text is related
to country scope.
الأسئلة الشائعة
Some of the customization options available based on the request are an additional 3–5 company profiles and country-specific analysis of 3–5 countries of your choice. Customizations are to be requested/discussed before making final order confirmation# as our team would review the same and check the feasibility
The report can be delivered in PDF/PPT format; we can also share excel dataset based on the request
Development of interactive and touch-screen displays and demand for energy-efficient and eco-friendly displays is likely to remain a key trend in the market.
Digital transformation in industries and increased focus on automation and smart factories are the major factors driving the industrial IoT display market.
Global industrial IoT display market is expected to grow at a CAGR of 12.9% during the forecast period 2024 - 2031.
Trends and growth analysis reports related to Electronics and Semiconductor : READ MORE..
The Insight Partners performs research in 4 major stages: Data Collection & Secondary Research, Primary Research, Data Analysis and Data Triangulation & Final Review.
- Data Collection and Secondary Research:
As a market research and consulting firm operating from a decade, we have published and advised several client across the globe. First step for any study will start with an assessment of currently available data and insights from existing reports. Further, historical and current market information is collected from Investor Presentations, Annual Reports, SEC Filings, etc., and other information related to company’s performance and market positioning are gathered from Paid Databases (Factiva, Hoovers, and Reuters) and various other publications available in public domain.
Several associations trade associates, technical forums, institutes, societies and organization are accessed to gain technical as well as market related insights through their publications such as research papers, blogs and press releases related to the studies are referred to get cues about the market. Further, white papers, journals, magazines, and other news articles published in last 3 years are scrutinized and analyzed to understand the current market trends.
- Primary Research:
The primarily interview analysis comprise of data obtained from industry participants interview and answers to survey questions gathered by in-house primary team.
For primary research, interviews are conducted with industry experts/CEOs/Marketing Managers/VPs/Subject Matter Experts from both demand and supply side to get a 360-degree view of the market. The primary team conducts several interviews based on the complexity of the markets to understand the various market trends and dynamics which makes research more credible and precise.
A typical research interview fulfils the following functions:
- Provides first-hand information on the market size, market trends, growth trends, competitive landscape, and outlook
- Validates and strengthens in-house secondary research findings
- Develops the analysis team’s expertise and market understanding
Primary research involves email interactions and telephone interviews for each market, category, segment, and sub-segment across geographies. The participants who typically take part in such a process include, but are not limited to:
- Industry participants: VPs, business development managers, market intelligence managers and national sales managers
- Outside experts: Valuation experts, research analysts and key opinion leaders specializing in the electronics and semiconductor industry.
Below is the breakup of our primary respondents by company, designation, and region:

Once we receive the confirmation from primary research sources or primary respondents, we finalize the base year market estimation and forecast the data as per the macroeconomic and microeconomic factors assessed during data collection.
- Data Analysis:
Once data is validated through both secondary as well as primary respondents, we finalize the market estimations by hypothesis formulation and factor analysis at regional and country level.
- Macro-Economic Factor Analysis:
We analyse macroeconomic indicators such the gross domestic product (GDP), increase in the demand for goods and services across industries, technological advancement, regional economic growth, governmental policies, the influence of COVID-19, PEST analysis, and other aspects. This analysis aids in setting benchmarks for various nations/regions and approximating market splits. Additionally, the general trend of the aforementioned components aid in determining the market's development possibilities.
- Country Level Data:
Various factors that are especially aligned to the country are taken into account to determine the market size for a certain area and country, including the presence of vendors, such as headquarters and offices, the country's GDP, demand patterns, and industry growth. To comprehend the market dynamics for the nation, a number of growth variables, inhibitors, application areas, and current market trends are researched. The aforementioned elements aid in determining the country's overall market's growth potential.
- Company Profile:
The “Table of Contents” is formulated by listing and analyzing more than 25 - 30 companies operating in the market ecosystem across geographies. However, we profile only 10 companies as a standard practice in our syndicate reports. These 10 companies comprise leading, emerging, and regional players. Nonetheless, our analysis is not restricted to the 10 listed companies, we also analyze other companies present in the market to develop a holistic view and understand the prevailing trends. The “Company Profiles” section in the report covers key facts, business description, products & services, financial information, SWOT analysis, and key developments. The financial information presented is extracted from the annual reports and official documents of the publicly listed companies. Upon collecting the information for the sections of respective companies, we verify them via various primary sources and then compile the data in respective company profiles. The company level information helps us in deriving the base number as well as in forecasting the market size.
- Developing Base Number:
Aggregation of sales statistics (2020-2022) and macro-economic factor, and other secondary and primary research insights are utilized to arrive at base number and related market shares for 2022. The data gaps are identified in this step and relevant market data is analyzed, collected from paid primary interviews or databases. On finalizing the base year market size, forecasts are developed on the basis of macro-economic, industry and market growth factors and company level analysis.
- Data Triangulation and Final Review:
The market findings and base year market size calculations are validated from supply as well as demand side. Demand side validations are based on macro-economic factor analysis and benchmarks for respective regions and countries. In case of supply side validations, revenues of major companies are estimated (in case not available) based on industry benchmark, approximate number of employees, product portfolio, and primary interviews revenues are gathered. Further revenue from target product/service segment is assessed to avoid overshooting of market statistics. In case of heavy deviations between supply and demand side values, all thes steps are repeated to achieve synchronization.
We follow an iterative model, wherein we share our research findings with Subject Matter Experts (SME’s) and Key Opinion Leaders (KOLs) until consensus view of the market is not formulated – this model negates any drastic deviation in the opinions of experts. Only validated and universally acceptable research findings are quoted in our reports.
We have important check points that we use to validate our research findings – which we call – data triangulation, where we validate the information, we generate from secondary sources with primary interviews and then we re-validate with our internal data bases and Subject matter experts. This comprehensive model enables us to deliver high quality, reliable data in shortest possible time.
 احصل على عينة مجانية لهذا التقرير