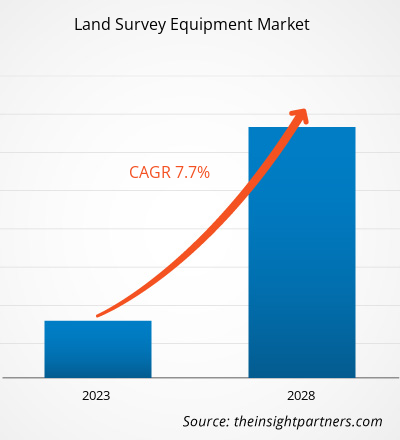
من المتوقع أن يصل سوق معدات مسح الأراضي إلى 12،568.4 مليون دولار أمريكي بحلول عام 2028؛ ومن المتوقع أن ينمو بمعدل نمو سنوي مركب قدره 7.7٪ من عام 2022 إلى عام 2028.
تشمل معدات المسح الأدوات المستخدمة في المسح ورسم الخرائط وقياس الأراضي باستخدام التقنيات المتخصصة والرياضيات. تشمل هذه الأدوات حوامل أدوات المسح، والمستويات، وعلامات مسح الأراضي، وآلات وضع العلامات، ومعدات نظام تحديد المواقع العالمي (GPS)، ومناشير المسح، وطائرات المسح بدون طيار، وقضبان مسح الأراضي، والعبور، والأوتاد، وقضبان الدرجات، وما إلى ذلك. يستخدم مقاولو المسح الذين يعملون في الميدان نظام تحديد المواقع العالمي (GPS)، والكاميرات، وأجهزة الحوسبة، إلى جانب حلول برمجية مختلفة لمعالجة بيانات المسح ومسودات الخرائط والخطط وتقارير المسح. تُستخدم معدات مسح الأراضي في تطبيقات مختلفة، بما في ذلك الحساب الحجمي، والتفتيش، ونقاط التخطيط، والمراقبة. يتم دفع سوق معدات مسح الأراضي من خلال الطلب المتزايد على هذه المعدات في صناعات البناء والطاقة المتجددة والتعدين والنفط والغاز والغابات والزراعة الدقيقة وإدارة الكوارث والنقل؛ البحث العلمي والجيولوجي؛ والمرافق.
إن التوسع الحضري المتزايد في البلدان النامية هو عامل رئيسي في تغذية نمو سوق معدات مسح الأراضي . تخطط حكومات البلدان النامية مثل الهند وبيرو والصين لمشاريع مختلفة للمدن الذكية، والتي قد تتطلب أنشطة المسح والتفتيش قبل عملية البناء الفعلية. علاوة على ذلك، تتوسع المدن الكبرى في الولايات المتحدة والهند والصين بسرعة، ويتم إنشاء العديد من البنى التحتية الجديدة في أجزاء مختلفة من هذه البلدان. يتم طرح العديد من الخطط لتطوير المدن الذكية، وتلعب معدات مسح الأراضي دورًا حاسمًا في مسح مواقع التطوير في مرحلة التخطيط.
تُستخدم الطائرات بدون طيار بشكل متزايد لالتقاط الصور ومقاطع الفيديو، حيث يمكنها توفير بيانات بصرية في الوقت الفعلي دون الحاجة إلى تدخل بشري. علاوة على ذلك، يسهل التحكم في الطائرات بدون طيار باستخدام أجهزة الكمبيوتر أو الهواتف الذكية، مما يدفع الطلب عليها لأغراض المسح. تُستخدم الطائرات بدون طيار أيضًا في المسح والمراقبة في القطاعات التجارية والدفاعية. تُستخدم مقاطع الفيديو والصور التي تلتقطها الطائرات بدون طيار والطائرات بدون طيار أيضًا في عمليات البحث والتخطيط. علاوة على ذلك، تساعد معدات مسح الأراضي في توفير الكثير من الوقت عند استخدامها في الميدان وتوفر إخراجًا دقيقًا باستخدام برنامج معالجة البيانات.
قم بتخصيص هذا التقرير ليناسب متطلباتك
ستحصل على تخصيص لأي تقرير - مجانًا - بما في ذلك أجزاء من هذا التقرير، أو تحليل على مستوى الدولة، وحزمة بيانات Excel، بالإضافة إلى الاستفادة من العروض والخصومات الرائعة للشركات الناشئة والجامعات
- احصل على أهم اتجاهات السوق الرئيسية لهذا التقرير.ستتضمن هذه العينة المجانية تحليلاً للبيانات، بدءًا من اتجاهات السوق وحتى التقديرات والتوقعات.
تأثير جائحة كوفيد-19 على سوق معدات مسح الأراضي
حث الانتشار الهائل لفيروس كورونا المستجد حكومات دول مختلفة على فرض قيود صارمة على المركبات والحركة البشرية في عام 2020. وقد أثرت قيود السفر اللاحقة والإغلاقات الجماعية وإغلاق الشركات على الاقتصادات والعديد من الصناعات في دول مختلفة. أدى فرض الإغلاق إلى انخفاض إنتاج السلع والخدمات. وشهدت صناعات التصنيع والسيارات والأغذية والمشروبات والنفط والغاز والمنسوجات وغيرها من الصناعات انخفاضًا في عملياتها بسبب التعليق المؤقت لأنشطة الإنتاج. كما شهد لاعبو سوق معدات مسح الأراضي تباطؤًا لأن مرافق التصنيع كانت تعمل بقوة عاملة محدودة أو تم إغلاقها مؤقتًا في عام 2020.
رؤى السوق – سوق معدات مسح الأراضي
ينقسم سوق معدات مسح الأراضي في أمريكا الشمالية إلى الولايات المتحدة والمكسيك. وفقًا لمكتب الإحصاء الأمريكي ووزارة الإسكان والتنمية الحضرية، في عام 2021، تم بيع حوالي 762000 منزل جديد في الولايات المتحدة، معظمها منازل عائلية واحدة. يعتمد نمو سوق معدات مسح الأراضي في أمريكا الشمالية على عدة عوامل، مثل نمو أعمال العقارات في الولايات المتحدة والمكسيك، واستخدام برامج البناء المتقدمة، والاعتماد على الزراعة، وتطوير السيارات التي زادت من حركة المرور وأدت إلى تطوير طرق جديدة. على سبيل المثال، وفقًا لتقرير نشرته World Highways في يونيو 2022، كان هناك طريق سريع قيد الإنشاء في المكسيك، ومن المتوقع أن يكتمل بحلول ديسمبر 2022. سيربط هذا الطريق السريع بين غوادالوبي وكالفو وباديراغواتو ويوفر رابطًا بين ولاية شيواوا وولاية سينالوا. نظرًا لوجود تضاريس جبلية، كان بناء الطريق السريع بطول 140 كيلومترًا أمرًا صعبًا وسيكلف حوالي 117 مليون دولار أمريكي حتى اكتماله. من بين 140 كيلومترًا، لا يزال هناك حوالي 13 كيلومترًا من أعمال إنشاء الطرق السريعة معلقة. يتطلب تطوير البنية التحتية هذا استخدام معدات مسح الأراضي لحساب المساحة والمسار والموقع وتخطيط الموقع وما إلى ذلك.
علاوة على ذلك، تعد الولايات المتحدة واحدة من الدول الرائدة التي تم أخذها في الاعتبار في دراسة سوق معدات مسح الأراضي، وذلك بسبب الاستهلاك العالي لمعدات مسح الأراضي الذي أدى إلى زيادة الإنتاج من قبل العديد من اللاعبين الرائدين في السوق مثل Allenbuild Instruments. علاوة على ذلك، فإن التقدم التكنولوجي المتزايد الذي يؤدي إلى زيادة الإنتاج وأنشطة البحث والتطوير هي بعض العوامل التي تدعم نمو سوق معدات مسح الأراضي. مع الطلب المتزايد على معدات مسح الأراضي في أمريكا الشمالية، من المتوقع أن ينمو سوق معدات مسح الأراضي خلال فترة التنبؤ.
رؤى تعتمد على الأجهزة
بناءً على الأجهزة، يتم تقسيم سوق معدات مسح الأراضي إلى أنظمة GNSS، والمستويات، والماسحات الضوئية بالليزر ثلاثية الأبعاد، والمحطات الكلية، والمزواة، والمركبات الجوية غير المأهولة، وأنظمة التحكم الآلي ، وأنظمة التوجيه الآلي، وغيرها. يتم تقسيم الجزء الآخر إلى سلاسل وأشرطة؛ البوصلات ومقاييس الميل؛ معدات السلامة؛ المنشورات والعاكسات؛ محددات مغناطيسية؛ والأعمدة والحوامل الثلاثية والحوامل. احتل جزء أنظمة GNSS أكبر حصة في سوق معدات مسح الأراضي في عام 2021. تعد معدات مسح GNSS أسرع من أدوات المسح التقليدية وتوفر نتائج أكثر دقة للمسوحات الطبوغرافية الكبيرة، مما يطغى على عامل التكلفة. في أغسطس 2018، أطلقت Trimble جهاز استقبال GNSS Trimble R 10 Model 2 GNSS System.
تعد شركة Hexagon AB؛ وشركة GUANGDONG KOLIDA INSTRUMENT CO., LTD.؛ وشركة Shanghai Huace Navigation Technology Ltd.؛ وشركة South Surveying & Mapping Technology CO., LTD.؛ وشركة Topcon Corporation؛ وشركة Trimble Inc.؛ وشركة Hi-Target؛ وشركة PENTAX Surveying؛ وشركة Suzhou FOIF Co., Ltd.؛ وشركة Robert Bosch Tool Corporation من بين اللاعبين الرئيسيين الذين تم تسليط الضوء عليهم خلال دراسة سوق معدات مسح الأراضي. علاوة على ذلك، تم تحليل أداء العديد من اللاعبين الأساسيين الآخرين للحصول على نظرة شاملة لتقرير سوق معدات مسح الأراضي ونظامها البيئي.
في تقرير سوق معدات مسح الأراضي، يتبنى اللاعبون بشكل أساسي مبادرات السوق الاستراتيجية، والتي تنطوي على توسيع البصمة عالميًا وتلبية الزيادة في الطلب من العملاء. يركز لاعبو سوق معدات مسح الأراضي بشكل أساسي على تحسينات المنتجات والخدمات من خلال دمج الميزات والتقنيات المتقدمة في عروضهم.
رؤى إقليمية حول سوق معدات مسح الأراضي
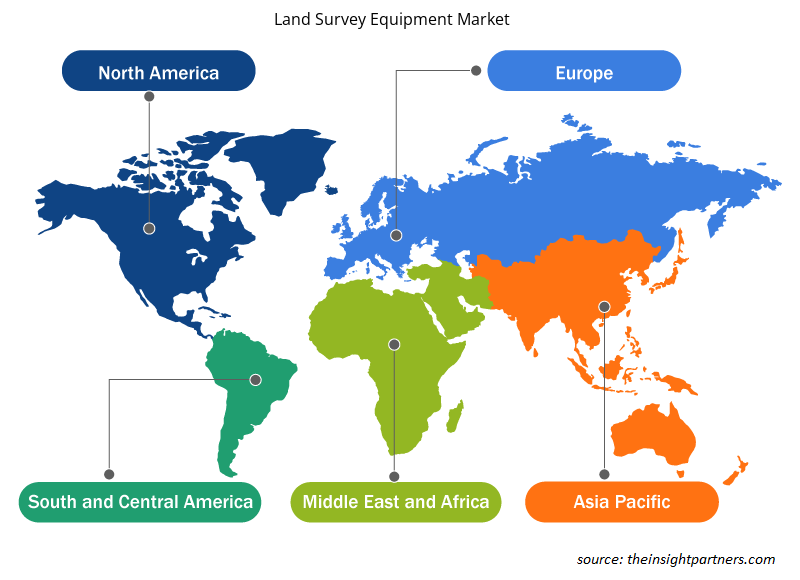
لقد قام المحللون في Insight Partners بشرح الاتجاهات والعوامل الإقليمية المؤثرة على سوق معدات مسح الأراضي طوال فترة التوقعات بشكل شامل. يناقش هذا القسم أيضًا قطاعات سوق معدات مسح الأراضي والجغرافيا في جميع أنحاء أمريكا الشمالية وأوروبا ومنطقة آسيا والمحيط الهادئ والشرق الأوسط وأفريقيا وأمريكا الجنوبية والوسطى.

- احصل على البيانات الإقليمية المحددة لسوق معدات مسح الأراضي
نطاق تقرير سوق معدات مسح الأراضي
| سمة التقرير | تفاصيل |
|---|---|
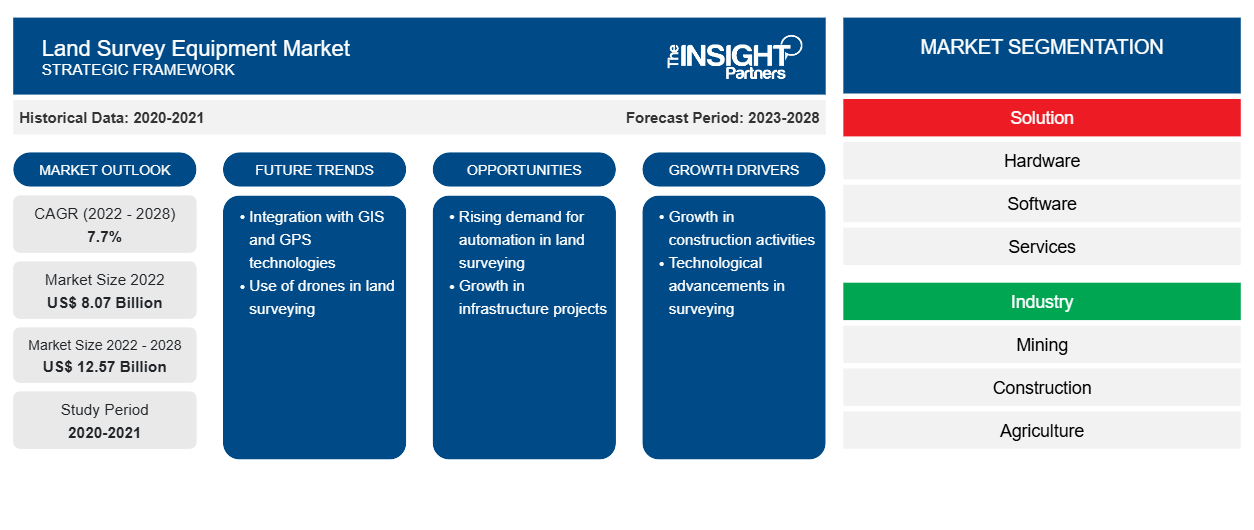
| حجم السوق في عام 2022 | 8.07 مليار دولار أمريكي |
| حجم السوق بحلول عام 2028 | 12.57 مليار دولار أمريكي |
| معدل النمو السنوي المركب العالمي (2022 - 2028) | 7.7% |
| البيانات التاريخية | 2020-2021 |
| فترة التنبؤ | 2023-2028 |
| القطاعات المغطاة | حسب الحل
|
| المناطق والدول المغطاة | أمريكا الشمالية
|
| قادة السوق وملفات تعريف الشركات الرئيسية |
|
كثافة اللاعبين في سوق معدات مسح الأراضي: فهم تأثيرها على ديناميكيات الأعمال
يشهد سوق معدات مسح الأراضي نموًا سريعًا، مدفوعًا بالطلب المتزايد من المستخدم النهائي بسبب عوامل مثل تفضيلات المستهلكين المتطورة والتقدم التكنولوجي والوعي المتزايد بفوائد المنتج. ومع ارتفاع الطلب، تعمل الشركات على توسيع عروضها والابتكار لتلبية احتياجات المستهلكين والاستفادة من الاتجاهات الناشئة، مما يؤدي إلى زيادة نمو السوق.
تشير كثافة اللاعبين في السوق إلى توزيع الشركات أو المؤسسات العاملة في سوق أو صناعة معينة. وهي تشير إلى عدد المنافسين (اللاعبين في السوق) الموجودين في مساحة سوق معينة نسبة إلى حجمها أو قيمتها السوقية الإجمالية.
الشركات الرئيسية العاملة في سوق معدات مسح الأراضي هي:
- سداسي AB
- شركة قوانغدونغ كوليدا للأدوات المحدودة.
- شركة شنغهاي هواس لتكنولوجيا الملاحة المحدودة
- شركة الجنوب لتكنولوجيا المساحة والخرائط المحدودة
- شركة توبكون
إخلاء المسؤولية : الشركات المذكورة أعلاه ليست مرتبة بأي ترتيب معين.

- احصل على نظرة عامة على أهم اللاعبين الرئيسيين في سوق معدات مسح الأراضي
- في عام 2022، أعلنت شركة South Surveying & Mapping Technology CO., LTD. أنها سلمت 200 مجموعة أخرى من Total Station NTS-332RU إلى إدارة الأراضي في تايلاند. يوفر 332RU عاكسًا سريعًا وقويًا مع أقل قدر من EDM، وسهولة الاتصال، وردود الفعل الواضحة لبرمجياته الموجودة على متن الطائرة. وبالتالي، فإن الاعتراف من قبل كل من القطاعين الحكومي والخاص سيساعد الشركة على جذب المزيد من العملاء في السوق.
- في عام 2021، أعلنت شركة Hi-Target أنها وقعت مذكرة تفاهم مع AFLAG. وبموجب هذه المذكرة، سيعمل الطرفان بشكل مشترك على إنشاء مركز لتبادل التكنولوجيا لتنفيذ تعاون معمق في تدريب المواهب المهنية، والترويج لتقنيات المنتجات وتطبيقها، وإعادة التوزيع والتوزيع.
- التحليل التاريخي (سنتان)، السنة الأساسية، التوقعات (7 سنوات) مع معدل النمو السنوي المركب
- تحليل PEST و SWOT
- حجم السوق والقيمة / الحجم - عالميًا وإقليميًا وقطريًا
- الصناعة والمنافسة
- مجموعة بيانات Excel


Report Coverage
Revenue forecast, Company Analysis, Industry landscape, Growth factors, and Trends

Segment Covered
This text is related
to segments covered.

Regional Scope
North America, Europe, Asia Pacific, Middle East & Africa, South & Central America

Country Scope
This text is related
to country scope.
الأسئلة الشائعة
The US, China and India are registering a high growth rate during the forecast period.
Hardware segment held the largest share land survey equipment market. The constantly rising use of hardware for measurement and surveying at construction sites are the reason behind this segment’s growth.
China holds the major market share of land survey equipment market in 2022.
Hexagon AB, Trimble Inc., Topcon, South Surveying & Mapping Technology CO., LTD., and Hi-Target are the five key market players operating in the land survey equipment market.
The increasing trend of unmanned aerial vehicles and remote control drones are some of the major trends anticipated to propel the market growth during the forecast period.
Rising developments in real estate and increasing growth of industrial ad agriculture sectors are major driving factors contributing towards the growth of land survey equipment market.
The global land survey equipment market is expected to be valued at US$ 8,068.0 million in 2022.
By 2028, the global market size of land survey equipment market will be US$ 12,568.4 million.
Trends and growth analysis reports related to Electronics and Semiconductor : READ MORE..
The List of Companies - Land Survey Equipment Market
- Hexagon AB
- GUANGDONG KOLIDA INSTRUMENT CO. LTD.
- Shanghai Huace Navigation Technology Ltd.
- South Surveying & Mapping Technology CO., LTD.
- Topcon Corporation
- Trimble Inc.
- Hi-Target
- PENTAX Surveying
- Suzhou FOIF Co., Ltd.
- Robert Bosch Tool Corporation
The Insight Partners performs research in 4 major stages: Data Collection & Secondary Research, Primary Research, Data Analysis and Data Triangulation & Final Review.
- Data Collection and Secondary Research:
As a market research and consulting firm operating from a decade, we have published and advised several client across the globe. First step for any study will start with an assessment of currently available data and insights from existing reports. Further, historical and current market information is collected from Investor Presentations, Annual Reports, SEC Filings, etc., and other information related to company’s performance and market positioning are gathered from Paid Databases (Factiva, Hoovers, and Reuters) and various other publications available in public domain.
Several associations trade associates, technical forums, institutes, societies and organization are accessed to gain technical as well as market related insights through their publications such as research papers, blogs and press releases related to the studies are referred to get cues about the market. Further, white papers, journals, magazines, and other news articles published in last 3 years are scrutinized and analyzed to understand the current market trends.
- Primary Research:
The primarily interview analysis comprise of data obtained from industry participants interview and answers to survey questions gathered by in-house primary team.
For primary research, interviews are conducted with industry experts/CEOs/Marketing Managers/VPs/Subject Matter Experts from both demand and supply side to get a 360-degree view of the market. The primary team conducts several interviews based on the complexity of the markets to understand the various market trends and dynamics which makes research more credible and precise.
A typical research interview fulfils the following functions:
- Provides first-hand information on the market size, market trends, growth trends, competitive landscape, and outlook
- Validates and strengthens in-house secondary research findings
- Develops the analysis team’s expertise and market understanding
Primary research involves email interactions and telephone interviews for each market, category, segment, and sub-segment across geographies. The participants who typically take part in such a process include, but are not limited to:
- Industry participants: VPs, business development managers, market intelligence managers and national sales managers
- Outside experts: Valuation experts, research analysts and key opinion leaders specializing in the electronics and semiconductor industry.
Below is the breakup of our primary respondents by company, designation, and region:

Once we receive the confirmation from primary research sources or primary respondents, we finalize the base year market estimation and forecast the data as per the macroeconomic and microeconomic factors assessed during data collection.
- Data Analysis:
Once data is validated through both secondary as well as primary respondents, we finalize the market estimations by hypothesis formulation and factor analysis at regional and country level.
- Macro-Economic Factor Analysis:
We analyse macroeconomic indicators such the gross domestic product (GDP), increase in the demand for goods and services across industries, technological advancement, regional economic growth, governmental policies, the influence of COVID-19, PEST analysis, and other aspects. This analysis aids in setting benchmarks for various nations/regions and approximating market splits. Additionally, the general trend of the aforementioned components aid in determining the market's development possibilities.
- Country Level Data:
Various factors that are especially aligned to the country are taken into account to determine the market size for a certain area and country, including the presence of vendors, such as headquarters and offices, the country's GDP, demand patterns, and industry growth. To comprehend the market dynamics for the nation, a number of growth variables, inhibitors, application areas, and current market trends are researched. The aforementioned elements aid in determining the country's overall market's growth potential.
- Company Profile:
The “Table of Contents” is formulated by listing and analyzing more than 25 - 30 companies operating in the market ecosystem across geographies. However, we profile only 10 companies as a standard practice in our syndicate reports. These 10 companies comprise leading, emerging, and regional players. Nonetheless, our analysis is not restricted to the 10 listed companies, we also analyze other companies present in the market to develop a holistic view and understand the prevailing trends. The “Company Profiles” section in the report covers key facts, business description, products & services, financial information, SWOT analysis, and key developments. The financial information presented is extracted from the annual reports and official documents of the publicly listed companies. Upon collecting the information for the sections of respective companies, we verify them via various primary sources and then compile the data in respective company profiles. The company level information helps us in deriving the base number as well as in forecasting the market size.
- Developing Base Number:
Aggregation of sales statistics (2020-2022) and macro-economic factor, and other secondary and primary research insights are utilized to arrive at base number and related market shares for 2022. The data gaps are identified in this step and relevant market data is analyzed, collected from paid primary interviews or databases. On finalizing the base year market size, forecasts are developed on the basis of macro-economic, industry and market growth factors and company level analysis.
- Data Triangulation and Final Review:
The market findings and base year market size calculations are validated from supply as well as demand side. Demand side validations are based on macro-economic factor analysis and benchmarks for respective regions and countries. In case of supply side validations, revenues of major companies are estimated (in case not available) based on industry benchmark, approximate number of employees, product portfolio, and primary interviews revenues are gathered. Further revenue from target product/service segment is assessed to avoid overshooting of market statistics. In case of heavy deviations between supply and demand side values, all thes steps are repeated to achieve synchronization.
We follow an iterative model, wherein we share our research findings with Subject Matter Experts (SME’s) and Key Opinion Leaders (KOLs) until consensus view of the market is not formulated – this model negates any drastic deviation in the opinions of experts. Only validated and universally acceptable research findings are quoted in our reports.
We have important check points that we use to validate our research findings – which we call – data triangulation, where we validate the information, we generate from secondary sources with primary interviews and then we re-validate with our internal data bases and Subject matter experts. This comprehensive model enables us to deliver high quality, reliable data in shortest possible time.


 احصل على عينة مجانية لهذا التقرير