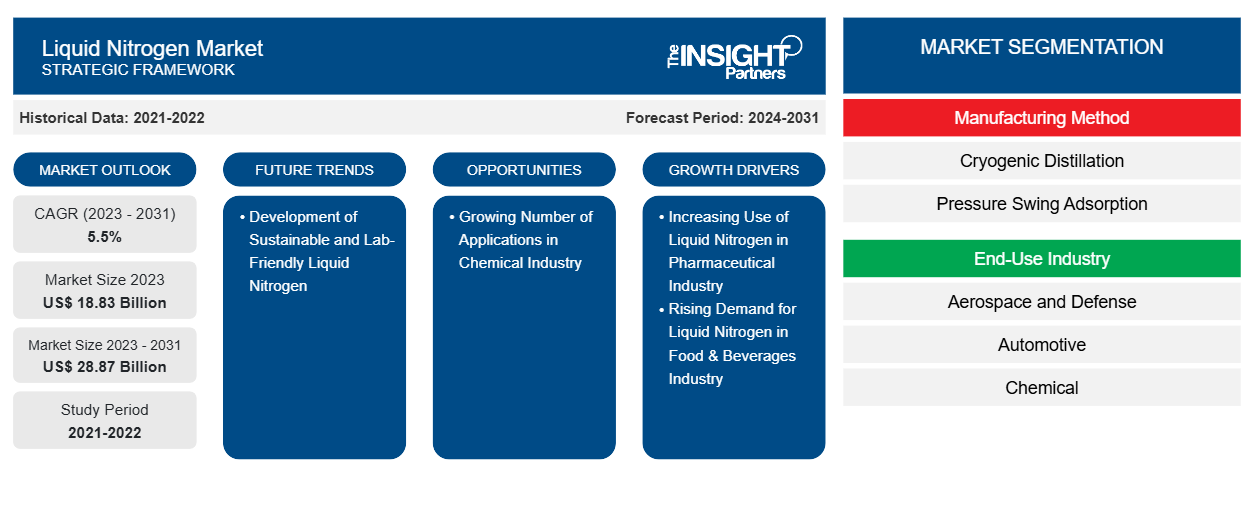
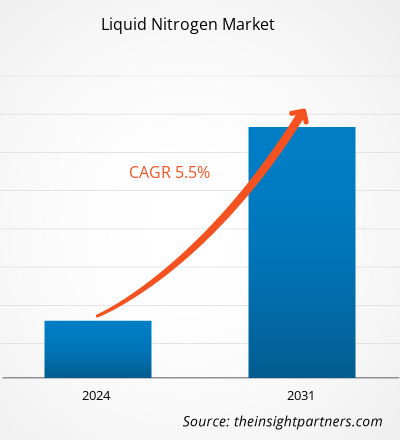
من المتوقع أن يصل حجم سوق النيتروجين السائل إلى 28.87 مليار دولار أمريكي بحلول عام 2031 من 18.83 مليار دولار أمريكي في عام 2023؛ ومن المتوقع أن يسجل السوق معدل نمو سنوي مركب بنسبة 5.5٪ خلال الفترة 2023-2031. ومن المرجح أن يؤدي تطوير النيتروجين السائل المستدام والصديق للمختبرات إلى ظهور اتجاهات جديدة في السوق.
تحليل سوق النيتروجين السائل
يستخدم النيتروجين السائل على نطاق واسع في تطبيقات صيدلانية مختلفة. فهو يعمل كمادة مضافة عضوية لتطوير الأدوية العامة والعلاجية ومكون صيدلاني فعال. ويستخدم النيتروجين في شكله النقي أو مخاليطه لمجموعة واسعة من تطبيقات مراقبة الجودة والتحليل الطبي وغير الطبي ، وكذلك للحفاظ على الأنسجة والخلايا الحية في درجات حرارة منخفضة. كما يستخدم لتخزين الخلايا في درجات حرارة منخفضة للعمل في المختبر، والتعقيم (طريقة للتخلص من بقايا الإنسان من خلال التجفيف بالتجميد)، والحفظ بالتبريد . يعمل النيتروجين السائل كمبرد، ليصبح مخدرًا شائع الاستخدام للإجراءات الجراحية البسيطة. وبالتالي، فإن الاستخدام الواسع النطاق للنيتروجين السائل في صناعة الأدوية يغذي نمو السوق.
نظرة عامة على سوق النيتروجين السائل
النيتروجين السائل هو سائل مبرد، خامل، غير تآكلي، عديم اللون والرائحة، غير قابل للاشتعال، وبارد للغاية. وعلى الرغم من استخدامه بشكل أكثر شيوعًا في الحالة الغازية، يتم تخزين النيتروجين ونقله كسائل، مما يجعله طريقة أكثر فعالية من حيث التكلفة لتوفير إمدادات المنتج. يستخدم النيتروجين السائل على نطاق واسع في العديد من التطبيقات التجارية والفنية. فهو يستخدم في تجميد الأطعمة، وإزالة الوميض من البلاستيك والمطاط وطحنهما، والتبريد، ومعالجة المعادن، وحفظ العينات البيولوجية، والطحن، وغيرها من التطبيقات المرتبطة بالحرارة.
قم بتخصيص هذا التقرير ليناسب متطلباتك
ستحصل على تخصيص لأي تقرير - مجانًا - بما في ذلك أجزاء من هذا التقرير، أو تحليل على مستوى الدولة، وحزمة بيانات Excel، بالإضافة إلى الاستفادة من العروض والخصومات الرائعة للشركات الناشئة والجامعات
- احصل على أهم اتجاهات السوق الرئيسية لهذا التقرير.ستتضمن هذه العينة المجانية تحليلاً للبيانات، بدءًا من اتجاهات السوق وحتى التقديرات والتوقعات.
محركات وفرص سوق النيتروجين السائل
ارتفاع الطلب على النيتروجين السائل في صناعة الأغذية والمشروبات
إن صناعة الأغذية والمشروبات المتنامية في مختلف الاقتصادات تعمل على تعزيز الطلب على النيتروجين السائل. وفي قطاع الأغذية والمشروبات، يستخدم النيتروجين السائل بشكل رئيسي لتبريد وتجميد وحفظ المنتجات. ويتم استخدامه في تجميد المخبوزات واللحوم والدواجن والأسماك والأطعمة المحضرة والفواكه والخضروات مع الاحتفاظ بلونها ورائحتها ونكهتها الأصلية. وتتضمن عملية الحفظ تبريد المنتج الغذائي أو تجميده بمساعدة النيتروجين السائل، وبالتالي تحسين مدة صلاحية المنتج. كما يتم استخدامه لتخزين ونقل المنتجات الغذائية القابلة للتلف. وعلى عكس المجمدات الميكانيكية التقليدية، فإن النيتروجين السائل له آثار بيئية ضارة ضئيلة ويتطلب استثمارًا أوليًا محدودًا في المعدات.
علاوة على ذلك، يتزايد اعتماد التجميد بالتبريد العميق في صناعة الأغذية والمشروبات بسبب المخاوف المتزايدة بشأن سلامة المنتجات الغذائية. لا يؤثر التجميد بالتبريد العميق على جودة المنتج النهائي وهو أكثر ملاءمة للبيئة وأكثر كفاءة في الوقت. تستخدم أنظمة التجميد بالتبريد العميق النيتروجين السائل كمبرد. وبالتالي، فإن تفضيل النيتروجين السائل بين مختلف مصنعي الأغذية والمشروبات آخذ في الازدياد بسبب الاعتماد المتزايد على التجميد بالتبريد العميق.
تزايد عدد التطبيقات في الصناعة الكيميائية
في الصناعة الكيميائية، يستخدم النيتروجين السائل غالبًا في التصنيع والمعالجة والمناولة والتخزين والنقل. يتم استخدامه كعامل حفظ بالتبريد ويعمل كمادة خام لعمليات الاستنساخ. يستخدم النيتروجين السائل كغاز ضغط، يدفع السوائل عبر خطوط الأنابيب. كما يستخدم لحماية المواد الحساسة للأكسجين من الهواء وكذلك لإزالة المواد الكيميائية العضوية المتطايرة من تيارات العملية. في التحليل الكيميائي، يستخدم النيتروجين السائل عادةً أثناء تحضير العينة. يتم استخدامه للحفاظ على التركيز وتقليل حجم العينات السائلة. يساعد النيتروجين السائل في إنتاج الأسمدة والأصباغ وحمض النيتريك والمتفجرات.
علاوة على ذلك، تعمل شركات تصنيع المواد الكيميائية المتخصصة على توسيع قدراتها لتلبية الطلب المتزايد من الأسواق المحلية والدولية. يشهد قطاع الكيماويات في اليابان والهند والدول الأوروبية والولايات المتحدة نموًا كبيرًا. ووفقًا لمؤسسة India Brand Equity Foundation (IBEF)، أصبحت الهند سادس أكبر منتج للمواد الكيميائية في جميع أنحاء العالم واحتلت المرتبة الثالثة في آسيا؛ ساهمت الصناعة الكيميائية بنسبة 7٪ في الناتج المحلي الإجمالي للبلاد في عام 2023. وبالتالي، من المتوقع أن يؤدي الاستخدام المتزايد للنيتروجين السائل في التطبيقات الكيميائية عبر مختلف الاقتصادات إلى خلق فرص مربحة لنمو سوق النيتروجين السائل خلال الفترة المتوقعة.IBEF), India became the sixth-largest producer of chemicals worldwide and ranked third in Asia; the chemical industry contributed 7% to the country's GDP in 2023. Thus, the growing liquid nitrogen usage in chemical applications across various economies is expected to create lucrative opportunities for the
تقرير تحليل تجزئة سوق النيتروجين السائل
إن القطاعات الرئيسية التي ساهمت في استخلاص تحليل سوق النيتروجين السائل هي طريقة التصنيع وصناعة الاستخدام النهائي.
- وفقًا لطريقة التصنيع، ينقسم سوق النيتروجين السائل إلى التقطير بالتبريد العميق والامتصاص بالضغط المتأرجح. احتل قطاع التقطير بالتبريد العميق حصة سوقية أكبر في عام 2023.
- بحسب صناعة الاستخدام النهائي، يتم تقسيم السوق إلى صناعة الطيران والدفاع، وصناعة السيارات، والصناعات الكيميائية، والأغذية والمشروبات، وتصنيع المعادن، والصناعات الدوائية، والإلكترونيات وأشباه الموصلات، وغيرها. وقد هيمن قطاع تصنيع المعادن على السوق في عام 2023.
تحليل حصة سوق النيتروجين السائل حسب المنطقة الجغرافية
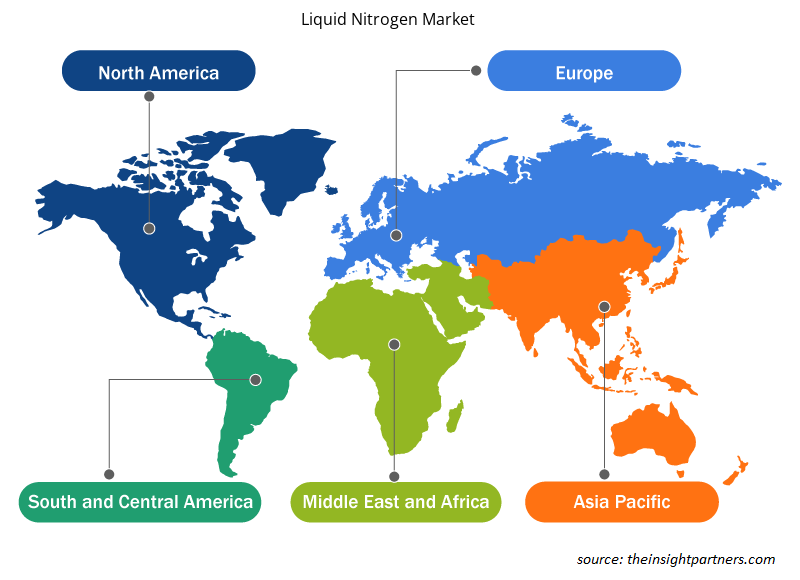
ينقسم النطاق الجغرافي لتقرير سوق النيتروجين السائل بشكل أساسي إلى خمس مناطق: أمريكا الشمالية، وآسيا والمحيط الهادئ، وأوروبا، والشرق الأوسط وأفريقيا، وأمريكا الجنوبية والوسطى.
استحوذت منطقة آسيا والمحيط الهادئ على أكبر حصة سوقية في عام 2023 ومن المتوقع أن تسجل أعلى معدل نمو سنوي مركب خلال الفترة المتوقعة. احتلت أمريكا الشمالية ثاني أكبر حصة سوقية للنيتروجين السائل في عام 2023. من حيث الإيرادات، احتلت الصين أكبر حصة في السوق في منطقة آسيا والمحيط الهادئ في عام 2023. تشهد الصين نموًا كبيرًا في صناعة الأغذية والمشروبات بسبب زيادة الدخل المتاح والنمو السكاني. وفقًا لوزارة الزراعة الأمريكية، في عام 2023، نما إنتاج الغذاء في الصين بنسبة 2.9٪، وهو أعلى بنسبة 1.9٪ من متوسط معدل نمو الإنتاج الصناعي. تشهد البلاد أيضًا زيادة في الطلب على الأغذية المصنعة ومنتجات الأغذية المعبأة بسبب التركيز المتزايد على الراحة بين المستهلكين. يلعب النيتروجين السائل دورًا حاسمًا في تقليل اتساخ الطعام وتغير لون المنتجات الغذائية وإعطاء قوة لتغليف المواد الغذائية بالتجزئة. وبالتالي، فإن صناعة الأغذية والمشروبات المتنامية تغذي الطلب على النيتروجين السائل في الصين.
رؤى إقليمية حول سوق النيتروجين السائل
لقد قام المحللون في Insight Partners بشرح الاتجاهات والعوامل الإقليمية المؤثرة على سوق النيتروجين السائل طوال فترة التوقعات بشكل شامل. يناقش هذا القسم أيضًا قطاعات سوق النيتروجين السائل والجغرافيا في جميع أنحاء أمريكا الشمالية وأوروبا ومنطقة آسيا والمحيط الهادئ والشرق الأوسط وأفريقيا وأمريكا الجنوبية والوسطى.

- احصل على البيانات الإقليمية المحددة لسوق النيتروجين السائل
نطاق تقرير سوق النيتروجين السائل
| سمة التقرير | تفاصيل |
|---|---|
| حجم السوق في عام 2023 | 18.83 مليار دولار أمريكي |
| حجم السوق بحلول عام 2031 | 28.87 مليار دولار أمريكي |
| معدل النمو السنوي المركب العالمي (2023 - 2031) | 5.5% |
| البيانات التاريخية | 2021-2022 |
| فترة التنبؤ | 2024-2031 |
| القطاعات المغطاة | حسب طريقة التصنيع
|
| المناطق والدول المغطاة | أمريكا الشمالية
|
| قادة السوق وملفات تعريف الشركات الرئيسية |
|
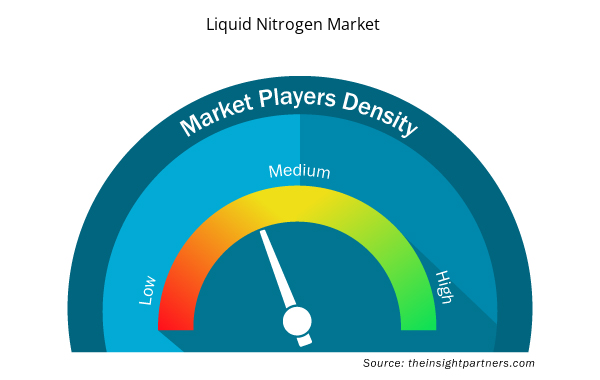
كثافة اللاعبين في السوق: فهم تأثيرها على ديناميكيات الأعمال
يشهد سوق النيتروجين السائل نموًا سريعًا، مدفوعًا بالطلب المتزايد من المستخدم النهائي بسبب عوامل مثل تفضيلات المستهلكين المتطورة والتقدم التكنولوجي والوعي المتزايد بفوائد المنتج. ومع ارتفاع الطلب، تعمل الشركات على توسيع عروضها والابتكار لتلبية احتياجات المستهلكين والاستفادة من الاتجاهات الناشئة، مما يؤدي إلى زيادة نمو السوق.
تشير كثافة اللاعبين في السوق إلى توزيع الشركات أو المؤسسات العاملة في سوق أو صناعة معينة. وهي تشير إلى عدد المنافسين (اللاعبين في السوق) الموجودين في مساحة سوق معينة نسبة إلى حجمها أو قيمتها السوقية الإجمالية.
الشركات الرئيسية العاملة في سوق النيتروجين السائل هي:
- شركة ليندي المحدودة
- شركة إير ليكويد إس إيه
- شركة المنتجات الجوية والمواد الكيميائية
- شركة سول سبا
- شركة براكسير للتكنولوجيا
- شركة نيبون سانسو القابضة
إخلاء المسؤولية : الشركات المذكورة أعلاه ليست مرتبة بأي ترتيب معين.

- احصل على نظرة عامة على أهم اللاعبين الرئيسيين في سوق النيتروجين السائل
أخبار سوق النيتروجين السائل والتطورات الأخيرة
يتم تقييم سوق النيتروجين السائل من خلال جمع البيانات النوعية والكمية بعد الأبحاث الأولية والثانوية، والتي تتضمن منشورات الشركات المهمة وبيانات الجمعيات وقواعد البيانات. فيما يلي بعض التطورات في سوق النيتروجين السائل:
- أعلنت شركة لينده عن توقيع اتفاقية طويلة الأجل مع شركة H2 Green Steel لتوريد الغازات الصناعية إلى أول مصنع لإنتاج الصلب الأخضر على نطاق واسع في العالم. (Linde PLC، موقع الشركة على الإنترنت، مايو 2024)
- أعلنت شركة سافران أنها دخلت في مفاوضات حصرية مع شركة إير ليكيد لشراء أنشطة الأكسجين والنيتروجين في مجال الطيران التابعة لشركة إير ليكيد للتكنولوجيا المتقدمة، باستثناء الأنشطة المبردة المتعلقة بالتطبيقات البحرية. (مجموعة سافران، موقع الشركة على الإنترنت، يونيو 2023)
تغطية تقرير سوق النيتروجين السائل والمنتجات النهائية
يوفر تقرير "حجم سوق النيتروجين السائل والتوقعات (2021-2031)" تحليلاً مفصلاً للسوق يغطي المجالات التالية:
- حجم سوق النيتروجين السائل وتوقعاته لجميع قطاعات السوق الرئيسية التي يغطيها النطاق
- اتجاهات سوق النيتروجين السائل، بالإضافة إلى ديناميكيات السوق مثل المحركات والقيود والفرص الرئيسية
- تحليل مفصل لقوى بورتر الخمس ونقاط القوة والضعف والفرص والتهديدات
- تحليل سوق النيتروجين السائل يغطي اتجاهات السوق الرئيسية وإطار الدولة واللاعبين الرئيسيين واللوائح والتطورات الأخيرة في السوق.
- تحليل المشهد الصناعي والمنافسة الذي يغطي تركيز السوق، وتحليل خريطة الحرارة، واللاعبين البارزين، والتطورات الأخيرة في سوق النيتروجين السائل
- ملفات تعريف الشركة التفصيلية
- التحليل التاريخي (سنتان)، السنة الأساسية، التوقعات (7 سنوات) مع معدل النمو السنوي المركب
- تحليل PEST و SWOT
- حجم السوق والقيمة / الحجم - عالميًا وإقليميًا وقطريًا
- الصناعة والمنافسة
- مجموعة بيانات Excel


- Fill Finish Manufacturing Market
- Single-Use Negative Pressure Wound Therapy Devices Market
- Frozen Potato Market
- Social Employee Recognition System Market
- Medical Devices Market
- Visualization and 3D Rendering Software Market
- Personality Assessment Solution Market
- Electronic Data Interchange Market
- Playout Solutions Market
- Pipe Relining Market

Report Coverage
Revenue forecast, Company Analysis, Industry landscape, Growth factors, and Trends

Segment Covered
This text is related
to segments covered.

Regional Scope
North America, Europe, Asia Pacific, Middle East & Africa, South & Central America

Country Scope
This text is related
to country scope.
الأسئلة الشائعة
The increasing use of liquid nitrogen in the pharmaceutical industry and the rising demand for liquid nitrogen in the food & beverages industry are driving the market.
A few of the key players in the liquid nitrogen market include Linde Plc, L'Air Liquide SA, Air Products and Chemicals Inc, SOL SpA, Praxair Technology Inc, Nippon Sanso Holdings Corp, Ube Corporation, AIR WATER INC, Gulf Cryo LLC, Osaka Gas Co Ltd, Tokyo Gas Chemicals Co Ltd, Messer SE & Co KGaA, nexAir LLC, ADNOC Gas, and Matheson Tri-Gas Inc.
The market is expected to register a CAGR of 5.5% during 2023–2031.
The cryogenic distillation segment held the largest share of the global liquid nitrogen market in 2023. The principle of the cryogenic distillation method is based on a cryogenic distillation of liquefied air. The cryogenic distillation method is considered efficient and it is instrumental in generating high-purity nitrogen.
In 2023, Asia Pacific held the largest share of the global liquid nitrogen market. Asia Pacific is experiencing substantial growth in the metal fabrication industry. According to the World Steel Association AISBL, the region produced 1,367.2 metric tons of steel as of 2023. This growing steel production in the region boosts the demand for liquid nitrogen.
The List of Companies - Liquid Nitrogen Market
- Linde Plc
- L’Air Liquide SA
- Air Products and Chemicals Inc
- SOL SpA
- Praxair Technology Inc
- Nippon Sanso Holdings Corp
- Ube Corporation
- AIR WATER INC
- Gulf Cryo LLC
- Osaka Gas Co Ltd
- Tokyo Gas Chemicals Co Ltd
- Messer SE & Co KGaA
- nexAir LLC
- ADNOC Gas
- Matheson Tri-Gas Inc.
The Insight Partners performs research in 4 major stages: Data Collection & Secondary Research, Primary Research, Data Analysis and Data Triangulation & Final Review.
- Data Collection and Secondary Research:
As a market research and consulting firm operating from a decade, we have published and advised several client across the globe. First step for any study will start with an assessment of currently available data and insights from existing reports. Further, historical and current market information is collected from Investor Presentations, Annual Reports, SEC Filings, etc., and other information related to company’s performance and market positioning are gathered from Paid Databases (Factiva, Hoovers, and Reuters) and various other publications available in public domain.
Several associations trade associates, technical forums, institutes, societies and organization are accessed to gain technical as well as market related insights through their publications such as research papers, blogs and press releases related to the studies are referred to get cues about the market. Further, white papers, journals, magazines, and other news articles published in last 3 years are scrutinized and analyzed to understand the current market trends.
- Primary Research:
The primarily interview analysis comprise of data obtained from industry participants interview and answers to survey questions gathered by in-house primary team.
For primary research, interviews are conducted with industry experts/CEOs/Marketing Managers/VPs/Subject Matter Experts from both demand and supply side to get a 360-degree view of the market. The primary team conducts several interviews based on the complexity of the markets to understand the various market trends and dynamics which makes research more credible and precise.
A typical research interview fulfils the following functions:
- Provides first-hand information on the market size, market trends, growth trends, competitive landscape, and outlook
- Validates and strengthens in-house secondary research findings
- Develops the analysis team’s expertise and market understanding
Primary research involves email interactions and telephone interviews for each market, category, segment, and sub-segment across geographies. The participants who typically take part in such a process include, but are not limited to:
- Industry participants: VPs, business development managers, market intelligence managers and national sales managers
- Outside experts: Valuation experts, research analysts and key opinion leaders specializing in the electronics and semiconductor industry.
Below is the breakup of our primary respondents by company, designation, and region:

Once we receive the confirmation from primary research sources or primary respondents, we finalize the base year market estimation and forecast the data as per the macroeconomic and microeconomic factors assessed during data collection.
- Data Analysis:
Once data is validated through both secondary as well as primary respondents, we finalize the market estimations by hypothesis formulation and factor analysis at regional and country level.
- Macro-Economic Factor Analysis:
We analyse macroeconomic indicators such the gross domestic product (GDP), increase in the demand for goods and services across industries, technological advancement, regional economic growth, governmental policies, the influence of COVID-19, PEST analysis, and other aspects. This analysis aids in setting benchmarks for various nations/regions and approximating market splits. Additionally, the general trend of the aforementioned components aid in determining the market's development possibilities.
- Country Level Data:
Various factors that are especially aligned to the country are taken into account to determine the market size for a certain area and country, including the presence of vendors, such as headquarters and offices, the country's GDP, demand patterns, and industry growth. To comprehend the market dynamics for the nation, a number of growth variables, inhibitors, application areas, and current market trends are researched. The aforementioned elements aid in determining the country's overall market's growth potential.
- Company Profile:
The “Table of Contents” is formulated by listing and analyzing more than 25 - 30 companies operating in the market ecosystem across geographies. However, we profile only 10 companies as a standard practice in our syndicate reports. These 10 companies comprise leading, emerging, and regional players. Nonetheless, our analysis is not restricted to the 10 listed companies, we also analyze other companies present in the market to develop a holistic view and understand the prevailing trends. The “Company Profiles” section in the report covers key facts, business description, products & services, financial information, SWOT analysis, and key developments. The financial information presented is extracted from the annual reports and official documents of the publicly listed companies. Upon collecting the information for the sections of respective companies, we verify them via various primary sources and then compile the data in respective company profiles. The company level information helps us in deriving the base number as well as in forecasting the market size.
- Developing Base Number:
Aggregation of sales statistics (2020-2022) and macro-economic factor, and other secondary and primary research insights are utilized to arrive at base number and related market shares for 2022. The data gaps are identified in this step and relevant market data is analyzed, collected from paid primary interviews or databases. On finalizing the base year market size, forecasts are developed on the basis of macro-economic, industry and market growth factors and company level analysis.
- Data Triangulation and Final Review:
The market findings and base year market size calculations are validated from supply as well as demand side. Demand side validations are based on macro-economic factor analysis and benchmarks for respective regions and countries. In case of supply side validations, revenues of major companies are estimated (in case not available) based on industry benchmark, approximate number of employees, product portfolio, and primary interviews revenues are gathered. Further revenue from target product/service segment is assessed to avoid overshooting of market statistics. In case of heavy deviations between supply and demand side values, all thes steps are repeated to achieve synchronization.
We follow an iterative model, wherein we share our research findings with Subject Matter Experts (SME’s) and Key Opinion Leaders (KOLs) until consensus view of the market is not formulated – this model negates any drastic deviation in the opinions of experts. Only validated and universally acceptable research findings are quoted in our reports.
We have important check points that we use to validate our research findings – which we call – data triangulation, where we validate the information, we generate from secondary sources with primary interviews and then we re-validate with our internal data bases and Subject matter experts. This comprehensive model enables us to deliver high quality, reliable data in shortest possible time.


 احصل على عينة مجانية لهذا التقرير