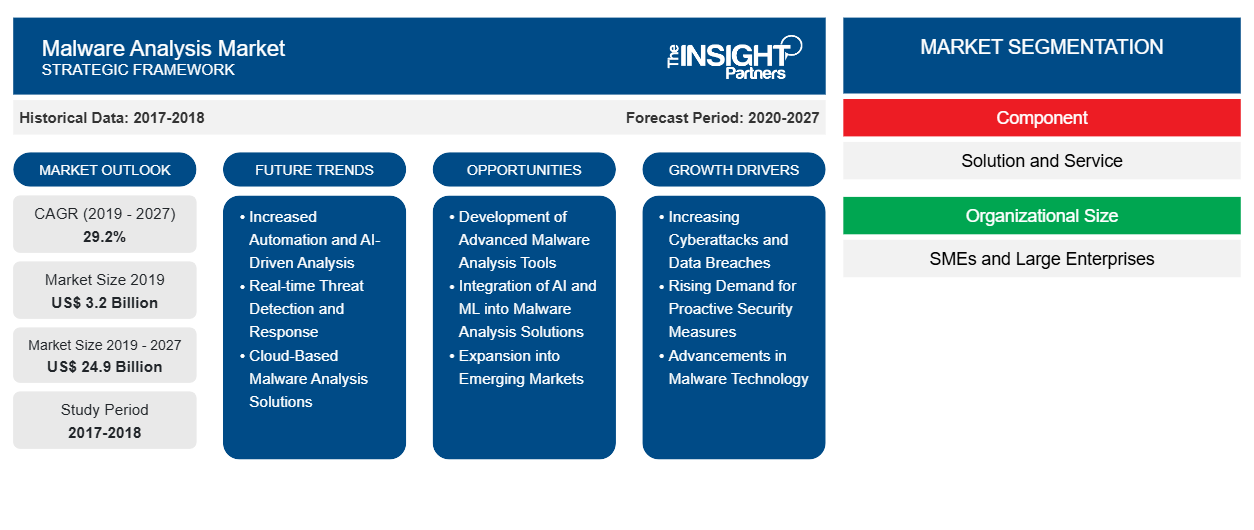
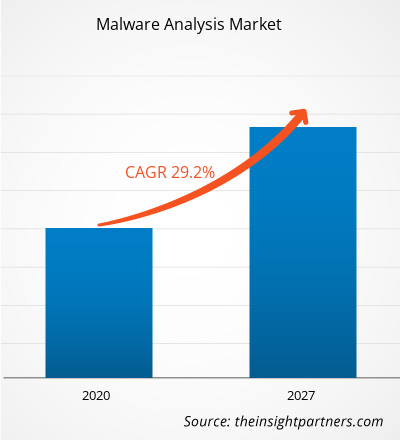
[تقرير بحثي] من المتوقع أن ينمو سوق تحليل البرامج الضارة من 3،204.4 مليون دولار أمريكي في عام 2019 إلى 24،898.3 مليون دولار أمريكي بحلول عام 2027؛ ومن المتوقع أن ينمو بمعدل نمو سنوي مركب قدره 29.2٪ من عام 2019 إلى عام 2027.
إن زيادة المبادرات الحكومية تعزى إلى نمو السوق. تتخذ الحكومات في العديد من البلدان في جميع أنحاء العالم مبادرات لدعم اعتماد أداة تحليل البرامج الضارة من قبل الشركات. على سبيل المثال، في عام 2017، أطلقت الحكومة الهندية Cyber Swachhta Kendra، وهو مركز لتنظيف شبكات الروبوتات وتحليل البرامج الضارة. يهدف المركز إلى اكتشاف إصابات شبكات الروبوتات في البلاد، وتجنب المزيد من الإصابات من خلال الإخطار وتمكين التنظيف وكذلك تأمين أنظمة المستخدمين النهائيين. أيضًا، في مارس 2019، وافق البرلمان الأوروبي على "قانون الأمن السيبراني" الجديد للاتحاد الأوروبي. ينشئ التنظيم الجديد إطارًا لشهادة الأمن السيبراني في الاتحاد الأوروبي. من المتصور أن يعمل هذا الإطار على تصعيد شفافية ضمان الأمن السيبراني لمنتجات وخدمات تكنولوجيا المعلومات والاتصالات وكذلك العمليات، وبالتالي تعزيز الثقة ومساعدة المستخدمين النهائيين على اتخاذ خيارات مستنيرة. سبب حاسم آخر للإطار هو التهرب من زيادة الشهادات الوطنية المتناقضة أو المتداخلة وبالتالي تقليل التكاليف. وبموجب اللائحة، يحق للمفوضية الأوروبية اعتماد مخططات اعتماد الأمن السيبراني الأوروبية، التي وضعتها وكالة الأمن السيبراني الأوروبية، فيما يتعلق بمجموعات معينة من منتجات وخدمات وعمليات تكنولوجيا المعلومات والاتصالات. ويمكن أن تغطي المخططات، على سبيل المثال، منتجات وخدمات وعمليات تكنولوجيا المعلومات والاتصالات المستخدمة في الطائرات والسيارات والأجهزة الطبية ومحطات الطاقة، فضلاً عن الأجهزة الاستهلاكية المتصلة بالإنترنت.
في عام 2018، أطلقت هيئة النقد في سنغافورة منحة بقيمة 22 مليون دولار أمريكي لتعزيز قدرات الأمن السيبراني لمساعدة المؤسسات المالية في البلاد على تعزيز مرونتها السيبرانية بالإضافة إلى رفع مهارات المواهب المحلية من خلال برامج التدريب المتعلقة بالأمن السيبراني مثل تحليل البرامج الضارة، والعمليات الأمنية، والطب الشرعي للكمبيوتر، ومراقبة التهديدات السيبرانية، ومطاردة التهديدات السيبرانية. ومن المتوقع أن تعزز مثل هذه المبادرات الحكومية نمو سوق تحليل البرامج الضارة
قم بتخصيص هذا التقرير ليناسب متطلباتك
ستحصل على تخصيص لأي تقرير - مجانًا - بما في ذلك أجزاء من هذا التقرير، أو تحليل على مستوى الدولة، وحزمة بيانات Excel، بالإضافة إلى الاستفادة من العروض والخصومات الرائعة للشركات الناشئة والجامعات
- احصل على أهم اتجاهات السوق الرئيسية لهذا التقرير.ستتضمن هذه العينة المجانية تحليلاً للبيانات، بدءًا من اتجاهات السوق وحتى التقديرات والتوقعات.
رؤى السوق
سوق تحليل البرمجيات الخبيثة
زيادة اعتماد الحلول الرقمية من قبل القطاعات الصناعية المتنوعة
إن تنفيذ الحلول الرقمية يكتسب زخمًا في مختلف الصناعات بما في ذلك التصنيع والرعاية الصحية والسيارات والخدمات المصرفية والمالية والتأمين والإعلام والترفيه والتجزئة وغيرها. تستفيد هذه الصناعات بشكل متزايد من التحول الرقمي. تمكنها التحليلات من فهم وخدمة العملاء بشكل أفضل. علاوة على ذلك، يؤدي الوصول إلى المعلومات في الوقت الفعلي إلى اتخاذ قرارات فعالة. تسهل أتمتة العمليات التجارية زيادة الإنتاجية. على سبيل المثال، أحدث مصنعو السيارات ثورة في عملية التصنيع الخاصة بهم باستخدام الروبوتات؛ وأصبحت شركات الطيران بارعة في التسعير من خلال المعلومات في الوقت الفعلي للعرض والطلب. علاوة على ذلك، صممت شركات التجزئة ذات القدرات الرقمية القوية بيئات متعددة القنوات سلسة. كما تم تحديث صناعة الرعاية الصحية من خلال السجلات الصحية الإلكترونية (EHR)، والأدوات الرقمية التي تتبع العلامات الحيوية للمرضى، بالإضافة إلى الاستشارات الافتراضية بين المرضى والأطباء. ومع ذلك، مع التبني المتزايد للتقنيات الرقمية مثل إنترنت الأشياء والبيانات الضخمة والذكاء الاصطناعي، في جميع أنحاء الأعمال وكذلك المجتمع ككل، أدى الاتصال المتزايد لكل شيء إلى خلق تحديات من حيث الامتثال والأمن وحماية البيانات. ومن ثم، فإن معالجة اتجاهات البرمجيات الخبيثة الجديدة تدفع إلى اعتماد أدوات تحليل البرمجيات الخبيثة.
رؤى قائمة على المكونات
استنادًا إلى المكونات، يتم تقسيم سوق تحليل البرامج الضارة إلى حلول وخدمات. احتل قطاع الحلول الحصة الأكبر في السوق في عام 2018.
رؤى مبنية على حجم المنظمة
بناءً على حجم المنظمة، يتم تقسيم سوق تحليل البرامج الضارة إلى شركات كبيرة وشركات صغيرة ومتوسطة الحجم. احتلت شريحة الشركات الكبيرة الحصة الأكبر في السوق في عام 2018.
يركز اللاعبون العاملون في سوق تحليل البرامج الضارة بشكل أساسي على تطوير المنتجات المتقدمة والفعالة.
- في عام 2019، أعلنت Google Cloud وPalo Alto Networks عن حلول جديدة لمساعدة العملاء على البقاء آمنين. ستتعاون الشركتان لتقديم عروض جديدة إلى السوق وتشغيل العديد من خدمات Palo Alto Networks على Google Cloud.
- في عام 2019، أعلنت كاسبيرسكي عن إنشاء أول مركز شفافية لها في منطقة آسيا والمحيط الهادئ بالشراكة مع CyberSecurity Malaysia ليكون بمثابة منشأة موثوقة لشركاء الشركة وأصحاب المصلحة الحكوميين للحضور والتحقق من الكود المصدر لحلول كاسبيرسكي.
رؤى إقليمية حول سوق تحليل البرمجيات الخبيثة
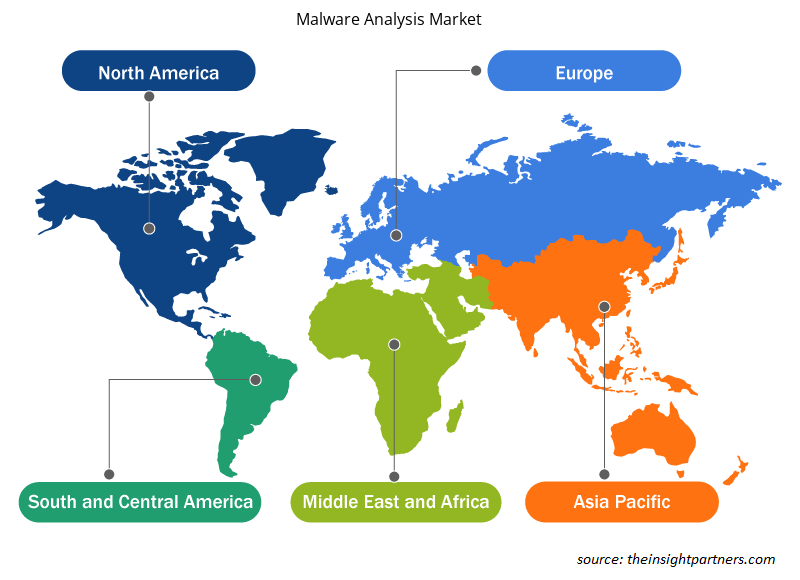
لقد قام المحللون في Insight Partners بشرح الاتجاهات والعوامل الإقليمية المؤثرة على سوق تحليل البرامج الضارة طوال فترة التنبؤ بشكل شامل. يناقش هذا القسم أيضًا قطاعات سوق تحليل البرامج الضارة والجغرافيا في جميع أنحاء أمريكا الشمالية وأوروبا ومنطقة آسيا والمحيط الهادئ والشرق الأوسط وأفريقيا وأمريكا الجنوبية والوسطى.

- احصل على بيانات إقليمية محددة لسوق تحليل البرامج الضارة
نطاق تقرير سوق تحليل البرمجيات الخبيثة
| سمة التقرير | تفاصيل |
|---|---|
| حجم السوق في عام 2019 | 3.2 مليار دولار أمريكي |
| حجم السوق بحلول عام 2027 | 24.9 مليار دولار أمريكي |
| معدل النمو السنوي المركب العالمي (2019 - 2027) | 29.2% |
| البيانات التاريخية | 2017-2018 |
| فترة التنبؤ | 2020-2027 |
| القطاعات المغطاة | حسب المكون
|
| المناطق والدول المغطاة | أمريكا الشمالية
|
| قادة السوق وملفات تعريف الشركات الرئيسية |
|
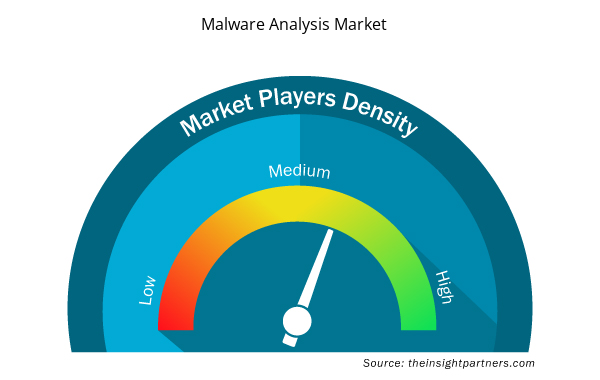
كثافة اللاعبين في السوق: فهم تأثيرها على ديناميكيات الأعمال
يشهد سوق تحليل البرمجيات الخبيثة نموًا سريعًا، مدفوعًا بالطلب المتزايد من المستخدم النهائي بسبب عوامل مثل تفضيلات المستهلكين المتطورة والتقدم التكنولوجي والوعي المتزايد بفوائد المنتج. ومع ارتفاع الطلب، تعمل الشركات على توسيع عروضها والابتكار لتلبية احتياجات المستهلكين والاستفادة من الاتجاهات الناشئة، مما يؤدي إلى زيادة نمو السوق.
تشير كثافة اللاعبين في السوق إلى توزيع الشركات أو المؤسسات العاملة في سوق أو صناعة معينة. وهي تشير إلى عدد المنافسين (اللاعبين في السوق) الموجودين في مساحة سوق معينة نسبة إلى حجمها أو قيمتها السوقية الإجمالية.
الشركات الرئيسية العاملة في سوق تحليل البرامج الضارة هي:
- شركة AT&T
- AO كاسبيرسكي لاب
- شركة برودكوم
- شركة سيسكو سيستمز
- شركة كراود سترايك القابضة
إخلاء المسؤولية : الشركات المذكورة أعلاه ليست مرتبة بأي ترتيب معين.

- احصل على نظرة عامة على أهم اللاعبين الرئيسيين في سوق تحليل البرامج الضارة
تم تقسيم سوق تحليل البرامج الضارة على النحو التالي:
سوق تحليل البرمجيات الخبيثة – حسب المكون
- حل
- خدمة
سوق تحليل البرمجيات الخبيثة – حسب حجم المنظمة
- الشركات الصغيرة والمتوسطة
- الشركات الكبيرة
سوق تحليل البرمجيات الخبيثة – حسب النشر
- في الموقع
- مبني على السحابة
سوق تحليل البرمجيات الخبيثة – حسب صناعة المستخدم النهائي
- الخدمات المالية والمصرفية والتأمين
- حكومة
- الرعاية الصحية
- تكنولوجيا المعلومات والاتصالات
- تصنيع
- آحرون
سوق تحليل البرمجيات الخبيثة – حسب المنطقة الجغرافية
- أمريكا الشمالية
- نحن
- كندا
- المكسيك
- أوروبا
- فرنسا
- ألمانيا
- إيطاليا
- روسيا
- المملكة المتحدة
- بقية أوروبا
- آسيا والمحيط الهادئ (APAC)
- اليابان
- الصين
- أستراليا
- الهند
- كوريا الجنوبية
- بقية منطقة آسيا والمحيط الهادئ
- الشرق الأوسط وأفريقيا
- المملكة العربية السعودية
- الامارات العربية المتحدة
- جنوب أفريقيا
- باقي منطقة الشرق الأوسط وأفريقيا
- أمريكا الجنوبية (SAM)
- البرازيل
- الأرجنتين
- بقية سام
سوق تحليل البرمجيات الخبيثة – نبذة عن الشركة
- AO كاسبيرسكي لاب
- ايه تي اند تي
- برودكوم
- سيسكو
- كراود سترايك
- فاير آي
- فورتينت
- شبكات بالو ألتو
- كواليس
- تريند مايكرو
- التحليل التاريخي (سنتان)، السنة الأساسية، التوقعات (7 سنوات) مع معدل النمو السنوي المركب
- تحليل PEST و SWOT
- حجم السوق والقيمة / الحجم - عالميًا وإقليميًا وقطريًا
- الصناعة والمنافسة
- مجموعة بيانات Excel


Report Coverage
Revenue forecast, Company Analysis, Industry landscape, Growth factors, and Trends

Segment Covered
This text is related
to segments covered.

Regional Scope
North America, Europe, Asia Pacific, Middle East & Africa, South & Central America

Country Scope
This text is related
to country scope.
الأسئلة الشائعة
BFSI dominated the malware analysis market in 2018. BFSI organizations are more vulnerable to cyber-attacks due to huge financial and personal data of customers on systems. In this sector, a massive amount of sensitive data is generated and exchanged daily. With the growing volume of data, end-points are also increasing at a rapid pace and monitoring these end points poses a huge challenge for this sector.
In past few years, cybercrime in the APAC region has grown to be a greater risk as compared to other leading regions. This is majorly because of rapidly increasing connectivity and rushing pace of digital transformation in the region, resulting into sharpening concern for technological threats among the businesses.
Rapid adoption of digitalization among diverse industries, implementation of IoT, and high adoption of connected devices offers lucrative opportunities to the market players. Also, rising trend of BYOD is another significant market opportunity.
Trends and growth analysis reports related to Technology, Media and Telecommunications : READ MORE..
The List of Companies - Malware Analysis Market
- AT&T Inc.
- AO Kaspersky Lab
- Broadcom, Inc.
- Cisco Systems, Inc.
- CrowdStrike Holdings Inc
- FireEye, Inc.
- Fortinet, Inc.
- Palo Alto Networks, Inc.
- Qualys, Inc.
- Trend Micro Incorporated, among others.
The Insight Partners performs research in 4 major stages: Data Collection & Secondary Research, Primary Research, Data Analysis and Data Triangulation & Final Review.
- Data Collection and Secondary Research:
As a market research and consulting firm operating from a decade, we have published and advised several client across the globe. First step for any study will start with an assessment of currently available data and insights from existing reports. Further, historical and current market information is collected from Investor Presentations, Annual Reports, SEC Filings, etc., and other information related to company’s performance and market positioning are gathered from Paid Databases (Factiva, Hoovers, and Reuters) and various other publications available in public domain.
Several associations trade associates, technical forums, institutes, societies and organization are accessed to gain technical as well as market related insights through their publications such as research papers, blogs and press releases related to the studies are referred to get cues about the market. Further, white papers, journals, magazines, and other news articles published in last 3 years are scrutinized and analyzed to understand the current market trends.
- Primary Research:
The primarily interview analysis comprise of data obtained from industry participants interview and answers to survey questions gathered by in-house primary team.
For primary research, interviews are conducted with industry experts/CEOs/Marketing Managers/VPs/Subject Matter Experts from both demand and supply side to get a 360-degree view of the market. The primary team conducts several interviews based on the complexity of the markets to understand the various market trends and dynamics which makes research more credible and precise.
A typical research interview fulfils the following functions:
- Provides first-hand information on the market size, market trends, growth trends, competitive landscape, and outlook
- Validates and strengthens in-house secondary research findings
- Develops the analysis team’s expertise and market understanding
Primary research involves email interactions and telephone interviews for each market, category, segment, and sub-segment across geographies. The participants who typically take part in such a process include, but are not limited to:
- Industry participants: VPs, business development managers, market intelligence managers and national sales managers
- Outside experts: Valuation experts, research analysts and key opinion leaders specializing in the electronics and semiconductor industry.
Below is the breakup of our primary respondents by company, designation, and region:

Once we receive the confirmation from primary research sources or primary respondents, we finalize the base year market estimation and forecast the data as per the macroeconomic and microeconomic factors assessed during data collection.
- Data Analysis:
Once data is validated through both secondary as well as primary respondents, we finalize the market estimations by hypothesis formulation and factor analysis at regional and country level.
- Macro-Economic Factor Analysis:
We analyse macroeconomic indicators such the gross domestic product (GDP), increase in the demand for goods and services across industries, technological advancement, regional economic growth, governmental policies, the influence of COVID-19, PEST analysis, and other aspects. This analysis aids in setting benchmarks for various nations/regions and approximating market splits. Additionally, the general trend of the aforementioned components aid in determining the market's development possibilities.
- Country Level Data:
Various factors that are especially aligned to the country are taken into account to determine the market size for a certain area and country, including the presence of vendors, such as headquarters and offices, the country's GDP, demand patterns, and industry growth. To comprehend the market dynamics for the nation, a number of growth variables, inhibitors, application areas, and current market trends are researched. The aforementioned elements aid in determining the country's overall market's growth potential.
- Company Profile:
The “Table of Contents” is formulated by listing and analyzing more than 25 - 30 companies operating in the market ecosystem across geographies. However, we profile only 10 companies as a standard practice in our syndicate reports. These 10 companies comprise leading, emerging, and regional players. Nonetheless, our analysis is not restricted to the 10 listed companies, we also analyze other companies present in the market to develop a holistic view and understand the prevailing trends. The “Company Profiles” section in the report covers key facts, business description, products & services, financial information, SWOT analysis, and key developments. The financial information presented is extracted from the annual reports and official documents of the publicly listed companies. Upon collecting the information for the sections of respective companies, we verify them via various primary sources and then compile the data in respective company profiles. The company level information helps us in deriving the base number as well as in forecasting the market size.
- Developing Base Number:
Aggregation of sales statistics (2020-2022) and macro-economic factor, and other secondary and primary research insights are utilized to arrive at base number and related market shares for 2022. The data gaps are identified in this step and relevant market data is analyzed, collected from paid primary interviews or databases. On finalizing the base year market size, forecasts are developed on the basis of macro-economic, industry and market growth factors and company level analysis.
- Data Triangulation and Final Review:
The market findings and base year market size calculations are validated from supply as well as demand side. Demand side validations are based on macro-economic factor analysis and benchmarks for respective regions and countries. In case of supply side validations, revenues of major companies are estimated (in case not available) based on industry benchmark, approximate number of employees, product portfolio, and primary interviews revenues are gathered. Further revenue from target product/service segment is assessed to avoid overshooting of market statistics. In case of heavy deviations between supply and demand side values, all thes steps are repeated to achieve synchronization.
We follow an iterative model, wherein we share our research findings with Subject Matter Experts (SME’s) and Key Opinion Leaders (KOLs) until consensus view of the market is not formulated – this model negates any drastic deviation in the opinions of experts. Only validated and universally acceptable research findings are quoted in our reports.
We have important check points that we use to validate our research findings – which we call – data triangulation, where we validate the information, we generate from secondary sources with primary interviews and then we re-validate with our internal data bases and Subject matter experts. This comprehensive model enables us to deliver high quality, reliable data in shortest possible time.


 احصل على عينة مجانية لهذا التقرير