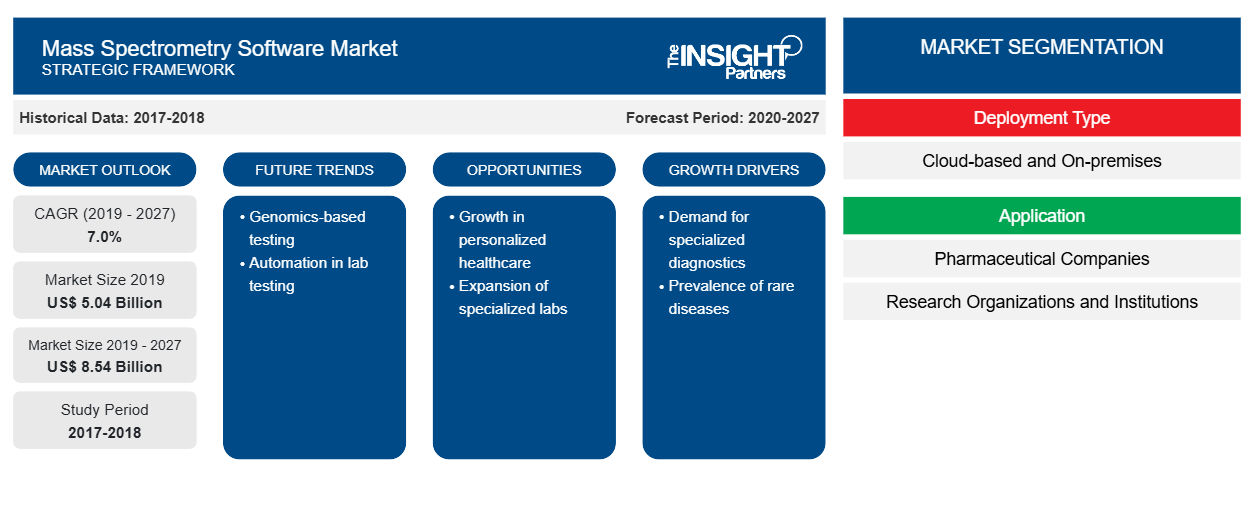
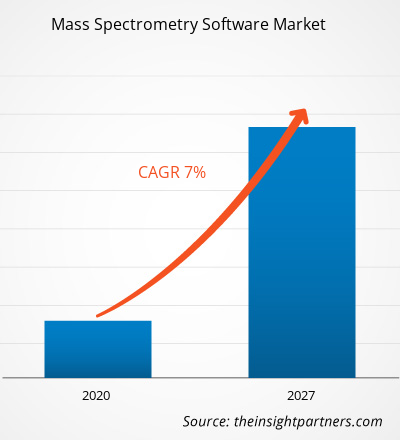
بلغت قيمة سوق برمجيات مطياف الكتلة 5,037.56 مليون دولار أمريكي في عام 2019 ومن المتوقع أن تصل إلى 8,541.36 مليون دولار أمريكي بحلول عام 2027؛ ومن المتوقع أن ينمو بمعدل نمو سنوي مركب قدره 7.0٪ من عام 2020 إلى عام 2027.
تساعد برامج مطياف الكتلة في جمع أدوات وأدوات رقمية مختلفة توفر العديد من الميزات والفوائد لعمليات مطياف الكتلة. تساعد برامج مطياف الكتلة في تحليل البيانات من خلال أدواتها المتخصصة وتساعد في تحديد المؤشرات الحيوية للبروتين وانحرافات البروتين بشكل أفضل. يشمل
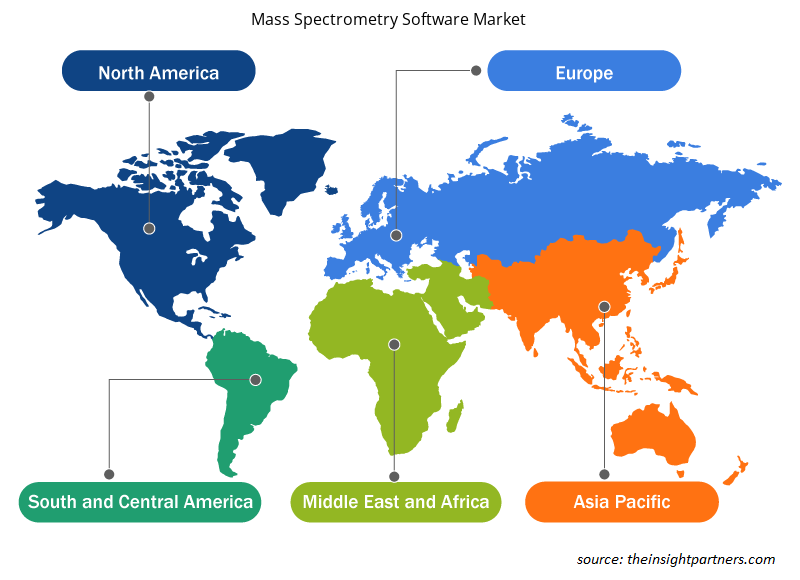
نطاق سوق برامج مطياف الكتلة نوع النشر والتطبيق والمنطقة. يتم تحليل سوق برامج مطياف الكتلة بناءً على مناطق مثل أمريكا الشمالية وأوروبا وآسيا والمحيط الهادئ والشرق الأوسط وأفريقيا وأمريكا الجنوبية والوسطى. يقدم التقرير رؤى وتحليلًا متعمقًا لسوق برامج مطياف الكتلة مع التركيز على معايير مختلفة، مثل اتجاهات السوق والتقدم التكنولوجي وديناميكيات السوق وتحليل المشهد التنافسي للاعبين الرئيسيين في السوق في جميع أنحاء العالم.
قم بتخصيص هذا التقرير ليناسب متطلباتك
ستحصل على تخصيص لأي تقرير - مجانًا - بما في ذلك أجزاء من هذا التقرير، أو تحليل على مستوى الدولة، وحزمة بيانات Excel، بالإضافة إلى الاستفادة من العروض والخصومات الرائعة للشركات الناشئة والجامعات
سوق برمجيات مطياف الكتلة:
- احصل على أهم اتجاهات السوق الرئيسية لهذا التقرير.ستتضمن هذه العينة المجانية تحليلاً للبيانات، بدءًا من اتجاهات السوق وحتى التقديرات والتوقعات.
رؤى السوق
تزايد تطبيقات علم الجينوم والتحليل البروتيني
لقد أدى التقدم المتزايد في التكنولوجيا إلى تعزيز التطبيقات الجينومية والبروتينية في صناعة التكنولوجيا الحيوية. تعتمد هذه التطبيقات بشكل أساسي على نتائج تحديد الهوية والقياس الكمي القائمة على مطياف الكتلة. وقد سمح دمج تكنولوجيا المعلومات مع التكنولوجيا الحيوية بتلقي قواعد بيانات تسلسل الجينوم تلقائيًا من خلال تحديد ملف تعريف البروتين السريع. كما يوفر فوائد مثل التحليل في الوقت الفعلي لعينات البروتين المتدفقة باستمرار والتي يمكن استخدامها للتطبيقات الطبية.
وقد أدى تزايد استخدام علم الجينوم والبروتينات في الصناعة الطبية لتشخيص وعلاج الأمراض المزمنة إلى زيادة استخدام مطيافية الكتلة. وقد مكّن مطياف الكتلة من اختراع تقنيات علاجية لتصميم علاجات مخصصة لأمراض مثل السرطان والسكري والاضطرابات الوراثية. وقد تلقت العديد من الابتكارات الدعم من المنظمات الحكومية في جميع أنحاء العالم لتعزيز البحث والتطوير في صناعة التكنولوجيا الحيوية. على سبيل المثال، في عام 2006، تعاون المعهد الوطني للسرطان والمعهد الوطني لأبحاث الجينوم البشري لقيادة مبادرات مهمة - مثل أطلس جينوم السرطان - لتطوير أدوية مخصصة لعلم الأورام. وبموجب البرنامج، تمت الموافقة على حوالي 47 دواء من قبل إدارة الغذاء والدواء في عام 2018، ونحو 20 دواء بحلول منتصف عام 2019.
وبالمثل، في عام 2016، تم إطلاق اتحاد البروتيوجينوم السرطاني الدولي (ICPC) لتوفير منصة لمراكز أبحاث السرطان والبروتينات الجينية الرائدة في العالم لتعزيز أبحاثها في مجال الطب الدقيق وتحدياته فيما يتعلق بالسرطان. يتواجد ICPC في 13 دولة تضم 33 معهدًا و11 عضوًا في اتحاد تحليل الأورام البروتينية السريرية. يؤدي زيادة البحث أو تطبيق البروتيوجينوم في الصناعة الطبية إلى زيادة الطلب على مطيافية الكتلة الآلية. بالإضافة إلى ذلك، يزداد الطلب على برامج مطيافية الكتلة من قبل العديد من المعاهد الأكاديمية وكذلك شركات الأدوية والمستحضرات الصيدلانية الحيوية لتعزيز أنشطتها البحثية وتطوير الأدوية. وبالتالي، من المتوقع أن تؤدي زيادة تطبيقات الجينوميات والبروتينات إلى دفع السوق خلال فترة التنبؤ.
رؤى تعتمد على نوع النشر
بناءً على نوع النشر، يتم تقسيم سوق برامج قياس الطيف الكتلي إلى برامج قائمة على السحابة وبرامج محلية. استحوذت البرامج القائمة على السحابة على أكبر حصة في السوق في عام 2019. كما يُقدر أن تسجل البرامج القائمة على السحابة أعلى معدل نمو سنوي مركب في السوق خلال فترة التوقعات بسبب سهولة الوصول إلى البيانات من أي مكان وفي أي وقت. بالإضافة إلى ذلك، توفر مستويات عالية من الأمان وقابلية التوسع وإمكانية الوصول والقدرة على تحمل التكاليف وتكاليف الطاقة المنخفضة والنشر السريع. ومن المتوقع أن يؤدي هذا إلى تسريع نمو السوق.
رؤى قائمة على التطبيق
بناءً على التطبيق، يتم تقسيم سوق برامج مطياف الكتلة إلى شركات الأدوية ومنظمات ومؤسسات البحث وغيرها. احتل قطاع شركات الأدوية الحصة الأكبر من السوق في عام 2019. ومن المتوقع أن يسجل نفس القطاع أعلى معدل نمو سنوي مركب في السوق خلال فترة التنبؤ.
تتبنى الشركات عادة استراتيجيات غير عضوية، مثل الشراكات والاندماج والاستحواذ، لتلبية الطلب المتغير للعملاء في جميع أنحاء العالم، وهو ما يسمح أيضًا للاعبين بالحفاظ على اسم علامتهم التجارية عالميًا. كما تبنى اللاعبون في السوق العاملون في سوق برمجيات مطياف الكتلة استراتيجيات عضوية، مثل إطلاق المنتجات والتوسع، لتوسيع نطاق بصمتهم ومحفظة منتجاتهم في جميع أنحاء العالم وكذلك لتلبية الطلب المتزايد.
رؤى إقليمية حول سوق برامج قياس الطيف الكتلي
لقد قام المحللون في Insight Partners بشرح الاتجاهات والعوامل الإقليمية المؤثرة على سوق برامج قياس الطيف الكتلي طوال فترة التوقعات بشكل شامل. يناقش هذا القسم أيضًا قطاعات سوق برامج قياس الطيف الكتلي والجغرافيا في جميع أنحاء أمريكا الشمالية وأوروبا ومنطقة آسيا والمحيط الهادئ والشرق الأوسط وأفريقيا وأمريكا الجنوبية والوسطى.
- احصل على البيانات الإقليمية المحددة لسوق برامج قياس الطيف الكتلي
نطاق تقرير سوق برامج مطياف الكتلة
| سمة التقرير | تفاصيل |
|---|---|
| حجم السوق في عام 2019 | 5.04 مليار دولار أمريكي |
| حجم السوق بحلول عام 2027 | 8.54 مليار دولار أمريكي |
| معدل النمو السنوي المركب العالمي (2019 - 2027) | 7.0% |
| البيانات التاريخية | 2017-2018 |
| فترة التنبؤ | 2020-2027 |
| القطاعات المغطاة | حسب نوع النشر
|
| المناطق والدول المغطاة | أمريكا الشمالية
|
| قادة السوق وملفات تعريف الشركات الرئيسية |
|
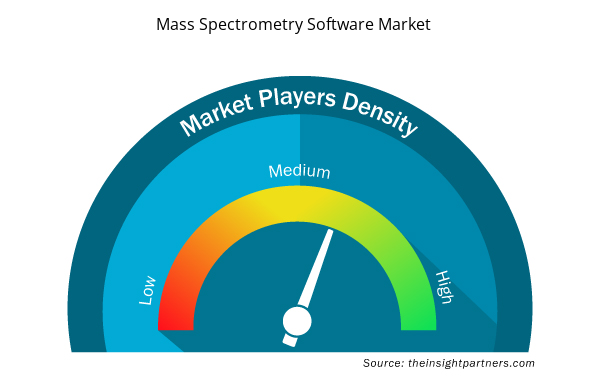
كثافة اللاعبين في سوق برمجيات مطياف الكتلة: فهم تأثيرها على ديناميكيات الأعمال
يشهد سوق برامج قياس الطيف الكتلي نموًا سريعًا، مدفوعًا بالطلب المتزايد من المستخدم النهائي بسبب عوامل مثل تفضيلات المستهلك المتطورة والتقدم التكنولوجي والوعي المتزايد بفوائد المنتج. ومع ارتفاع الطلب، تعمل الشركات على توسيع عروضها والابتكار لتلبية احتياجات المستهلكين والاستفادة من الاتجاهات الناشئة، مما يؤدي إلى زيادة نمو السوق.
تشير كثافة اللاعبين في السوق إلى توزيع الشركات أو المؤسسات العاملة في سوق أو صناعة معينة. وهي تشير إلى عدد المنافسين (اللاعبين في السوق) الموجودين في مساحة سوق معينة نسبة إلى حجمها أو قيمتها السوقية الإجمالية.
الشركات الرئيسية العاملة في سوق برمجيات مطياف الكتلة هي:
- شركة ووترز
- شركة ثيرمو فيشر العلمية
- شركة اجيلنت للتكنولوجيا
- شركة سايكس (داناهير كوربوريشن)
- تطوير الكيمياء المتقدمة
إخلاء المسؤولية : الشركات المذكورة أعلاه ليست مرتبة بأي ترتيب معين.
- احصل على نظرة عامة على أهم اللاعبين الرئيسيين في سوق برامج قياس الطيف الكتلي
حسب نوع النشر
- مبني على السحابة
- في الموقع
حسب الطلب
- شركات الأدوية
- المنظمات والمؤسسات البحثية
- آحرون
بواسطة
الجغرافيا
أمريكا الشمالية
- نحن
- كندا
- المكسيك
أوروبا
- فرنسا
- ألمانيا
- إيطاليا
- المملكة المتحدة
- روسيا
- بقية أوروبا
آسيا والمحيط الهادئ (APAC)
- الصين
- الهند
- كوريا الجنوبية
- اليابان
- أستراليا
- بقية منطقة آسيا والمحيط الهادئ
الشرق الأوسط وأفريقيا
- جنوب أفريقيا
- المملكة العربية السعودية
- الامارات العربية المتحدة
- باقي منطقة الشرق الأوسط وأفريقيا
أمريكا الجنوبية والوسطى (SCAM)
- البرازيل
- الأرجنتين
- بقية الاحتيال
نبذة عن الشركة
- شركة المياه
- شركة ثيرمو فيشر العلمية
- شركة اجيلنت للتكنولوجيا
- شركة سايكس (داناهير كوربوريشن)
- تطوير الكيمياء المتقدمة
- بروكر
- حلول أدابتاس
- شركة سبكترال ووركس المحدودة
- شركة شيمادزو للأجهزة العلمية
- شركة بيركين إلمر
- التحليل التاريخي (سنتان)، السنة الأساسية، التوقعات (7 سنوات) مع معدل النمو السنوي المركب
- تحليل PEST و SWOT
- حجم السوق والقيمة / الحجم - عالميًا وإقليميًا وقطريًا
- الصناعة والمنافسة
- مجموعة بيانات Excel


Report Coverage
Revenue forecast, Company Analysis, Industry landscape, Growth factors, and Trends

Segment Covered
This text is related
to segments covered.

Regional Scope
North America, Europe, Asia Pacific, Middle East & Africa, South & Central America

Country Scope
This text is related
to country scope.
Trends and growth analysis reports related to Technology, Media and Telecommunications : READ MORE..
The List of Companies - Mass Spectrometry Software Market
- Waters. Corporation
- Thermo Fisher Scientific Inc.
- Agilent Technologies, Inc.
- Sciex (Danaher Corporation)
- Advanced Chemistry Development
- Bruker
- Adaptas Solutions
- SpectralWorks Ltd.
- Shimadzu Scientific Instruments
- PerkinElmer, Inc.
The Insight Partners performs research in 4 major stages: Data Collection & Secondary Research, Primary Research, Data Analysis and Data Triangulation & Final Review.
- Data Collection and Secondary Research:
As a market research and consulting firm operating from a decade, we have published and advised several client across the globe. First step for any study will start with an assessment of currently available data and insights from existing reports. Further, historical and current market information is collected from Investor Presentations, Annual Reports, SEC Filings, etc., and other information related to company’s performance and market positioning are gathered from Paid Databases (Factiva, Hoovers, and Reuters) and various other publications available in public domain.
Several associations trade associates, technical forums, institutes, societies and organization are accessed to gain technical as well as market related insights through their publications such as research papers, blogs and press releases related to the studies are referred to get cues about the market. Further, white papers, journals, magazines, and other news articles published in last 3 years are scrutinized and analyzed to understand the current market trends.
- Primary Research:
The primarily interview analysis comprise of data obtained from industry participants interview and answers to survey questions gathered by in-house primary team.
For primary research, interviews are conducted with industry experts/CEOs/Marketing Managers/VPs/Subject Matter Experts from both demand and supply side to get a 360-degree view of the market. The primary team conducts several interviews based on the complexity of the markets to understand the various market trends and dynamics which makes research more credible and precise.
A typical research interview fulfils the following functions:
- Provides first-hand information on the market size, market trends, growth trends, competitive landscape, and outlook
- Validates and strengthens in-house secondary research findings
- Develops the analysis team’s expertise and market understanding
Primary research involves email interactions and telephone interviews for each market, category, segment, and sub-segment across geographies. The participants who typically take part in such a process include, but are not limited to:
- Industry participants: VPs, business development managers, market intelligence managers and national sales managers
- Outside experts: Valuation experts, research analysts and key opinion leaders specializing in the electronics and semiconductor industry.
Below is the breakup of our primary respondents by company, designation, and region:

Once we receive the confirmation from primary research sources or primary respondents, we finalize the base year market estimation and forecast the data as per the macroeconomic and microeconomic factors assessed during data collection.
- Data Analysis:
Once data is validated through both secondary as well as primary respondents, we finalize the market estimations by hypothesis formulation and factor analysis at regional and country level.
- Macro-Economic Factor Analysis:
We analyse macroeconomic indicators such the gross domestic product (GDP), increase in the demand for goods and services across industries, technological advancement, regional economic growth, governmental policies, the influence of COVID-19, PEST analysis, and other aspects. This analysis aids in setting benchmarks for various nations/regions and approximating market splits. Additionally, the general trend of the aforementioned components aid in determining the market's development possibilities.
- Country Level Data:
Various factors that are especially aligned to the country are taken into account to determine the market size for a certain area and country, including the presence of vendors, such as headquarters and offices, the country's GDP, demand patterns, and industry growth. To comprehend the market dynamics for the nation, a number of growth variables, inhibitors, application areas, and current market trends are researched. The aforementioned elements aid in determining the country's overall market's growth potential.
- Company Profile:
The “Table of Contents” is formulated by listing and analyzing more than 25 - 30 companies operating in the market ecosystem across geographies. However, we profile only 10 companies as a standard practice in our syndicate reports. These 10 companies comprise leading, emerging, and regional players. Nonetheless, our analysis is not restricted to the 10 listed companies, we also analyze other companies present in the market to develop a holistic view and understand the prevailing trends. The “Company Profiles” section in the report covers key facts, business description, products & services, financial information, SWOT analysis, and key developments. The financial information presented is extracted from the annual reports and official documents of the publicly listed companies. Upon collecting the information for the sections of respective companies, we verify them via various primary sources and then compile the data in respective company profiles. The company level information helps us in deriving the base number as well as in forecasting the market size.
- Developing Base Number:
Aggregation of sales statistics (2020-2022) and macro-economic factor, and other secondary and primary research insights are utilized to arrive at base number and related market shares for 2022. The data gaps are identified in this step and relevant market data is analyzed, collected from paid primary interviews or databases. On finalizing the base year market size, forecasts are developed on the basis of macro-economic, industry and market growth factors and company level analysis.
- Data Triangulation and Final Review:
The market findings and base year market size calculations are validated from supply as well as demand side. Demand side validations are based on macro-economic factor analysis and benchmarks for respective regions and countries. In case of supply side validations, revenues of major companies are estimated (in case not available) based on industry benchmark, approximate number of employees, product portfolio, and primary interviews revenues are gathered. Further revenue from target product/service segment is assessed to avoid overshooting of market statistics. In case of heavy deviations between supply and demand side values, all thes steps are repeated to achieve synchronization.
We follow an iterative model, wherein we share our research findings with Subject Matter Experts (SME’s) and Key Opinion Leaders (KOLs) until consensus view of the market is not formulated – this model negates any drastic deviation in the opinions of experts. Only validated and universally acceptable research findings are quoted in our reports.
We have important check points that we use to validate our research findings – which we call – data triangulation, where we validate the information, we generate from secondary sources with primary interviews and then we re-validate with our internal data bases and Subject matter experts. This comprehensive model enables us to deliver high quality, reliable data in shortest possible time.
 احصل على عينة مجانية لهذا التقرير