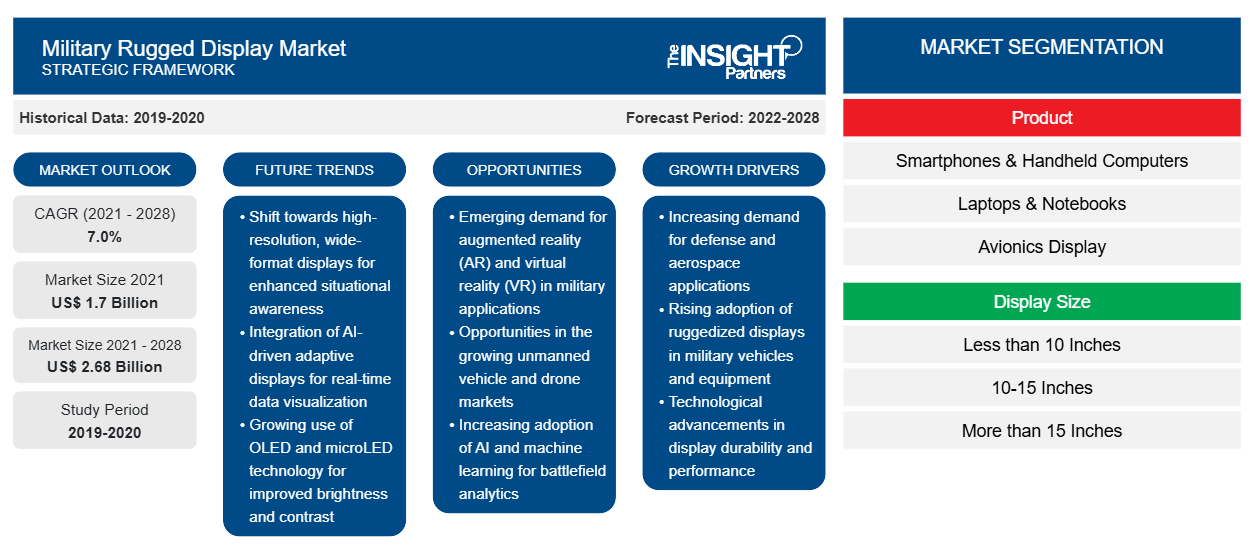
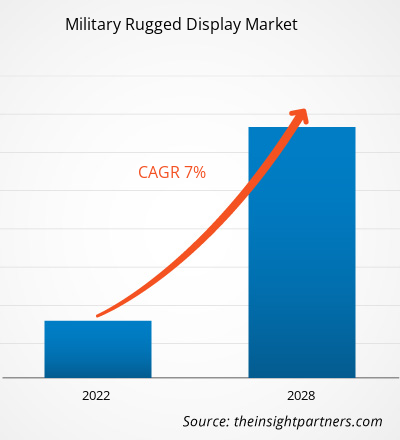
من المتوقع أن ينمو سوق شاشات العرض العسكرية المتينة من 1،699.42 مليون دولار أمريكي في عام 2021 إلى 2،680.85 مليون دولار أمريكي بحلول عام 2028؛ ومن المتوقع أن ينمو بمعدل نمو سنوي مركب قدره 7.0٪ من عام 2021 إلى عام 2028.
يستخدم الجنود النازلون والقوات المسلحة الأخرى عدة أنواع من الأجهزة المتينة التي تساعدهم على فهم السيناريو القريب وتسمح لهم بالتنقل في مساراتهم بسرعة. يمكن تحقيق الاستجابة السريعة للمستخدمين من البيانات المنقولة على شاشات الأجهزة المتينة. يقوم لاعبو سوق شاشات العرض العسكرية المتينة بشكل متزايد بتصميم وتطوير شاشات متينة متقدمة تقنيًا لصالح المستخدمين العسكريين المختلفين. على سبيل المثال، كانت شاشات اللمس المقاومة هي القاعدة بين القوات العسكرية ومصنعي شاشات العرض المتينة على مر السنين. ومع ذلك، في الآونة الأخيرة، يحول لاعبو سوق شاشات العرض العسكرية المتينة تركيزهم من شاشات اللمس المقاومة إلى شاشات اللمس السعوية، حيث أن شاشات اللمس السعوية متقدمة تقنيًا وحساسة للغاية للمس. تسمح الحساسية العالية للمستخدم بالتنقل عبر الخرائط على الأجهزة بسلاسة وسرعة، مما يساعدهم على الانتقال إلى منطقة أكثر أمانًا. الشاشات السعوية أكثر سطوعًا، ويمكن قراءة البيانات بسهولة تحت أشعة الشمس التي تعمل على تحسين الوعي الظرفي في ساحة المعركة. لذلك، تتبنى العديد من القوات العسكرية في جميع أنحاء العالم مثل هذه التطورات، مما يؤدي إلى نمو سوق شاشات العرض العسكرية القوية .
قم بتخصيص هذا التقرير ليناسب متطلباتك
ستحصل على تخصيص لأي تقرير - مجانًا - بما في ذلك أجزاء من هذا التقرير، أو تحليل على مستوى الدولة، وحزمة بيانات Excel، بالإضافة إلى الاستفادة من العروض والخصومات الرائعة للشركات الناشئة والجامعات
- احصل على أهم اتجاهات السوق الرئيسية لهذا التقرير.ستتضمن هذه العينة المجانية تحليلاً للبيانات، بدءًا من اتجاهات السوق وحتى التقديرات والتوقعات.
يتم تصنيف سوق شاشات العرض العسكرية المتينة العالمية على أساس المنتج وحجم العرض ونوع الشاشة والدقة والمستخدمين والجغرافيا. يتم تحليل شريحة المنتج في سوق شاشات العرض العسكرية المتينة على أساس الهواتف الذكية وأجهزة الكمبيوتر المحمولة وأجهزة الكمبيوتر المحمولة وأجهزة الكمبيوتر المحمولة وشاشات الطيران وشاشات المركبة على المركبات وأجهزة الكمبيوتر اللوحية وأجهزة الكمبيوتر المهمة. على أساس حجم الشاشة، يتم تقسيم سوق شاشات العرض العسكرية المتينة إلى أقل من 10 بوصات و10 - 15 بوصة وأكثر من 15 بوصة. يتم تحليل شريحة نوع الشاشة في سوق شاشات العرض العسكرية المتينة على أساس شاشات اللمس وغير اللمسية. يتم تقسيم شريحة الدقة إلى عالية الدقة (HD) وعالية الدقة بالكامل (FHD). المستخدمون الذين تم أخذهم في الاعتبار في سوق شاشات العرض العسكرية المتينة هم القوات الجوية والقوات البرية والقوات البحرية. علاوة على ذلك، يتم إجراء التحليل الجغرافي على أساس أمريكا الشمالية وأوروبا ومنطقة آسيا والمحيط الهادئ والشرق الأوسط وأفريقيا وسام.
لقد أثرت أزمة جائحة كوفيد-19 الأخيرة سلبًا على العالم وتواصل تحطيم العديد من البلدان. وحتى اندلاع الجائحة، كانت صناعة الدفاع تشهد نموًا كبيرًا من حيث الإنتاج والخدمات؛ إلا أن الأزمة تعطل سلسلة التوريد وتصنيع معدات المنتجات الدفاعية.
تعتمد صناعة التصنيع الدفاعي بشكل كبير على العمالة اليدوية، وتعاني من نقص العمالة في مرافق التصنيع المعنية بسبب لوائح الإغلاق في العديد من البلدان في جميع أنحاء العالم. علاوة على ذلك، أدى ظهور فيروس COVID-19 في جميع أنحاء العالم إلى سيناريوهات الإغلاق مما دفع خبراء الصناعة إلى تحليل أن الصناعة ستواجه من 4 أسابيع إلى 12 أسبوعًا من التأخير في سلسلة توريد الأجزاء الإلكترونية العسكرية . تسبب هذا الاضطراب في حدوث هزات خلال عام 2020. وقد أدت هذه العوامل إلى تقييد إنتاج معدات الدفاع المختلفة، وبالتالي إعاقة نمو سوق شاشات العرض العسكرية المتينة.
رؤى إقليمية حول سوق الشاشات العسكرية المتينة
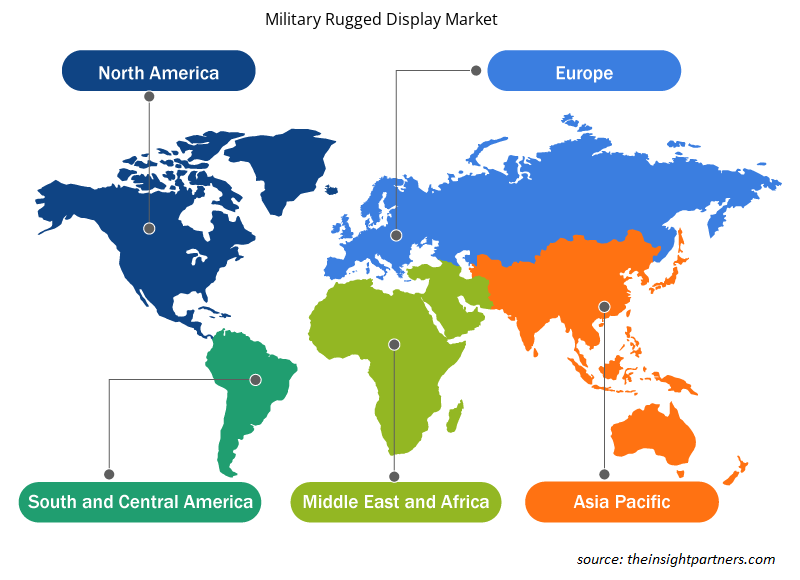
لقد قام المحللون في Insight Partners بشرح الاتجاهات والعوامل الإقليمية المؤثرة على سوق الشاشات العسكرية المتينة طوال فترة التوقعات بشكل شامل. يناقش هذا القسم أيضًا قطاعات سوق الشاشات العسكرية المتينة والجغرافيا في جميع أنحاء أمريكا الشمالية وأوروبا ومنطقة آسيا والمحيط الهادئ والشرق الأوسط وأفريقيا وأمريكا الجنوبية والوسطى.

- احصل على البيانات الإقليمية المحددة لسوق شاشات العرض العسكرية المتينة
نطاق تقرير سوق شاشات العرض العسكرية المتينة
| سمة التقرير | تفاصيل |
|---|---|
| حجم السوق في عام 2021 | 1.7 مليار دولار أمريكي |
| حجم السوق بحلول عام 2028 | 2.68 مليار دولار أمريكي |
| معدل النمو السنوي المركب العالمي (2021 - 2028) | 7.0% |
| البيانات التاريخية | 2019-2020 |
| فترة التنبؤ | 2022-2028 |
| القطاعات المغطاة | حسب المنتج
|
| المناطق والدول المغطاة | أمريكا الشمالية
|
| قادة السوق وملفات تعريف الشركات الرئيسية |
|
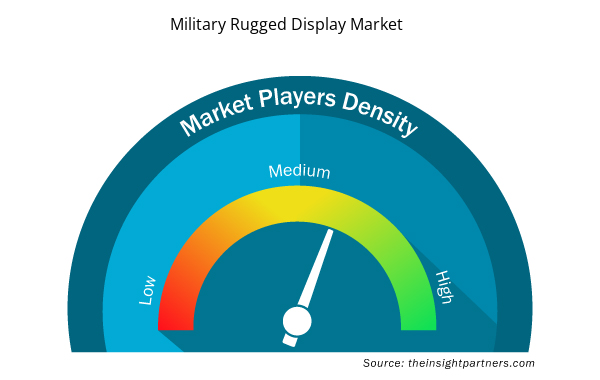
كثافة اللاعبين في سوق شاشات العرض العسكرية المتينة: فهم تأثيرها على ديناميكيات الأعمال
يشهد سوق شاشات العرض العسكرية المتينة نموًا سريعًا، مدفوعًا بالطلب المتزايد من المستخدم النهائي بسبب عوامل مثل تفضيلات المستهلكين المتطورة والتقدم التكنولوجي والوعي الأكبر بفوائد المنتج. ومع ارتفاع الطلب، تعمل الشركات على توسيع عروضها والابتكار لتلبية احتياجات المستهلكين والاستفادة من الاتجاهات الناشئة، مما يؤدي إلى زيادة نمو السوق.
تشير كثافة اللاعبين في السوق إلى توزيع الشركات أو المؤسسات العاملة في سوق أو صناعة معينة. وهي تشير إلى عدد المنافسين (اللاعبين في السوق) الموجودين في مساحة سوق معينة نسبة إلى حجمها أو قيمتها السوقية الإجمالية.
الشركات الرئيسية العاملة في سوق العرض العسكري المتين هي:
- شركة الحلول المضمنة المتقدمة المحدودة
- شركة اشورد سيستمز المحدودة
- عروض أيدين
- مجموعة كريستال المحدودة
- شركة جنرال ديجيتال
إخلاء المسؤولية : الشركات المذكورة أعلاه ليست مرتبة بأي ترتيب معين.

- احصل على نظرة عامة على أهم اللاعبين الرئيسيين في سوق شاشات العرض العسكرية المتينة
تشمل بعض الشركات الرئيسية العاملة في سوق شاشات العرض العسكرية المتينة شركة Advanced Embedded Solutions Ltd؛ وAssured Systems؛ وAydin Displays؛ وCP Technologies LLC؛ وCrystal Group Inc.؛ وGeneral Digital Corporation؛ وHatteland Technology؛ وNeuro Logic Systems, Inc.؛ وWinmate Inc.؛ وZMicro. كما تم تحليل العديد من الشركات الأخرى لفهم مساهمتها في سوق شاشات العرض العسكرية المتينة.
- التحليل التاريخي (سنتان)، السنة الأساسية، التوقعات (7 سنوات) مع معدل النمو السنوي المركب
- تحليل PEST و SWOT
- حجم السوق والقيمة / الحجم - عالميًا وإقليميًا وقطريًا
- الصناعة والمنافسة
- مجموعة بيانات Excel


- Water Pipeline Leak Detection System Market
- Nuclear Waste Management System Market
- Skin Graft Market
- Workwear Market
- Vaginal Specula Market
- Medical and Research Grade Collagen Market
- Sports Technology Market
- Virtual Pipeline Systems Market
- Machine Condition Monitoring Market
- Redistribution Layer Material Market

Report Coverage
Revenue forecast, Company Analysis, Industry landscape, Growth factors, and Trends

Segment Covered
This text is related
to segments covered.

Regional Scope
North America, Europe, Asia Pacific, Middle East & Africa, South & Central America

Country Scope
This text is related
to country scope.
الأسئلة الشائعة
Situational awareness or being aware of the location is paramount among the soldiers during the battle. The modern battlefield presents several challenges to situation awareness, which poses a substantial threat to the dismounted soldiers as well as vehicles (land, air, and naval). This is due to the fact that enemies or militant forces are using advanced technologies, which creates challenging situations for armed forces during decision making. Owing to enhance situational awareness among the on-battle soldiers, the demand for rugged devices is consistently growing, supporting the generating a generous amount of demand for the rugged display that functions smoothly under harshest environments. This factor is driving the military rugged display market.
Leonardo, Curtiss-Wright Corporation, Aydin Displays, ZMicro, and WNMATE are among the key market players operating in the global military rugged display market. The key players are listed upon considering factors such as overall revenue, current military rugged display product portfolio, geographical reach, market initiatives, investment in technology upgrades, partnerships, and other market-related activities.
North America is expected to hold the largest share of the military rugged display market during the forecast period. The growth of the market in this region is majorly driven by factors such as the growing implementation of advanced military rugged display and extensive government investments in the US defense sector. In addition, the presence of major market players such as Aydin Displays, Curtiss-Wright Corp, and General Micro Systems Inc., and reduction in the total cost of ownership (TCO) are among other factors supporting the market growth in the region.
Military rugged displays provide crystal clear picture quality in extreme environmental conditions. These displays enhance direct sunlight readability and work in extremely low light applications; moreover, they are compatible with flexible night vision operations. Based on the product, the market is segmented into a smartphone and handheld computer, laptop and notebook, avionics display, vehicle-mounted computer, panel PC and mission-critical display. The military rugged displays have escalated the demand for smartphones and handheld computers that are lightweight, thinner, and cheaper; they also feature high reliability and durability.
The defense aircraft manufacturers worldwide are focusing heavily on manufacturing and marketing advanced aircraft to the military forces. In order to support the demand for smooth aircraft operations under harsh environments, the military forces are urging the aircraft OEMs to increase the internal and external ruggedness of the aircraft models. With an objective to meet the requirements, the airframers are seeking advanced solutions such as lightweight, durable, and rugged materials for exterior and interior applications, including avionics displays. This factor is catalyzing the adoption of rugged displays for military avionics, which is propelling the military rugged display market.
The growing demand for ruggedized displays with fast response time, high resolution, and optimal picture quality is anticipated to propel military rugged display manufacturers toward significant innovations. The rising adoption of high-definition displays in smartphones, laptops, PCs, and other electronic gadgets is one of the substantial factors expected to drive the growth of the market. Features such as high picture resolution and extensive color range also escalate the demand for high-definition displays.
Trends and growth analysis reports related to Electronics and Semiconductor : READ MORE..
The List of Companies - Military Rugged Display Market
- Advanced Embedded Solutions Ltd
- Assured Systems Ltd
- Aydin Displays
- Crystal Group, Inc.
- General Digital Corporation
- Hatteland Technology AS
- Neuro Logic Systems, Inc.
- Winmate Inc.
- ZMicro, Inc.
- CP Technologies LLC
The Insight Partners performs research in 4 major stages: Data Collection & Secondary Research, Primary Research, Data Analysis and Data Triangulation & Final Review.
- Data Collection and Secondary Research:
As a market research and consulting firm operating from a decade, we have published and advised several client across the globe. First step for any study will start with an assessment of currently available data and insights from existing reports. Further, historical and current market information is collected from Investor Presentations, Annual Reports, SEC Filings, etc., and other information related to company’s performance and market positioning are gathered from Paid Databases (Factiva, Hoovers, and Reuters) and various other publications available in public domain.
Several associations trade associates, technical forums, institutes, societies and organization are accessed to gain technical as well as market related insights through their publications such as research papers, blogs and press releases related to the studies are referred to get cues about the market. Further, white papers, journals, magazines, and other news articles published in last 3 years are scrutinized and analyzed to understand the current market trends.
- Primary Research:
The primarily interview analysis comprise of data obtained from industry participants interview and answers to survey questions gathered by in-house primary team.
For primary research, interviews are conducted with industry experts/CEOs/Marketing Managers/VPs/Subject Matter Experts from both demand and supply side to get a 360-degree view of the market. The primary team conducts several interviews based on the complexity of the markets to understand the various market trends and dynamics which makes research more credible and precise.
A typical research interview fulfils the following functions:
- Provides first-hand information on the market size, market trends, growth trends, competitive landscape, and outlook
- Validates and strengthens in-house secondary research findings
- Develops the analysis team’s expertise and market understanding
Primary research involves email interactions and telephone interviews for each market, category, segment, and sub-segment across geographies. The participants who typically take part in such a process include, but are not limited to:
- Industry participants: VPs, business development managers, market intelligence managers and national sales managers
- Outside experts: Valuation experts, research analysts and key opinion leaders specializing in the electronics and semiconductor industry.
Below is the breakup of our primary respondents by company, designation, and region:

Once we receive the confirmation from primary research sources or primary respondents, we finalize the base year market estimation and forecast the data as per the macroeconomic and microeconomic factors assessed during data collection.
- Data Analysis:
Once data is validated through both secondary as well as primary respondents, we finalize the market estimations by hypothesis formulation and factor analysis at regional and country level.
- Macro-Economic Factor Analysis:
We analyse macroeconomic indicators such the gross domestic product (GDP), increase in the demand for goods and services across industries, technological advancement, regional economic growth, governmental policies, the influence of COVID-19, PEST analysis, and other aspects. This analysis aids in setting benchmarks for various nations/regions and approximating market splits. Additionally, the general trend of the aforementioned components aid in determining the market's development possibilities.
- Country Level Data:
Various factors that are especially aligned to the country are taken into account to determine the market size for a certain area and country, including the presence of vendors, such as headquarters and offices, the country's GDP, demand patterns, and industry growth. To comprehend the market dynamics for the nation, a number of growth variables, inhibitors, application areas, and current market trends are researched. The aforementioned elements aid in determining the country's overall market's growth potential.
- Company Profile:
The “Table of Contents” is formulated by listing and analyzing more than 25 - 30 companies operating in the market ecosystem across geographies. However, we profile only 10 companies as a standard practice in our syndicate reports. These 10 companies comprise leading, emerging, and regional players. Nonetheless, our analysis is not restricted to the 10 listed companies, we also analyze other companies present in the market to develop a holistic view and understand the prevailing trends. The “Company Profiles” section in the report covers key facts, business description, products & services, financial information, SWOT analysis, and key developments. The financial information presented is extracted from the annual reports and official documents of the publicly listed companies. Upon collecting the information for the sections of respective companies, we verify them via various primary sources and then compile the data in respective company profiles. The company level information helps us in deriving the base number as well as in forecasting the market size.
- Developing Base Number:
Aggregation of sales statistics (2020-2022) and macro-economic factor, and other secondary and primary research insights are utilized to arrive at base number and related market shares for 2022. The data gaps are identified in this step and relevant market data is analyzed, collected from paid primary interviews or databases. On finalizing the base year market size, forecasts are developed on the basis of macro-economic, industry and market growth factors and company level analysis.
- Data Triangulation and Final Review:
The market findings and base year market size calculations are validated from supply as well as demand side. Demand side validations are based on macro-economic factor analysis and benchmarks for respective regions and countries. In case of supply side validations, revenues of major companies are estimated (in case not available) based on industry benchmark, approximate number of employees, product portfolio, and primary interviews revenues are gathered. Further revenue from target product/service segment is assessed to avoid overshooting of market statistics. In case of heavy deviations between supply and demand side values, all thes steps are repeated to achieve synchronization.
We follow an iterative model, wherein we share our research findings with Subject Matter Experts (SME’s) and Key Opinion Leaders (KOLs) until consensus view of the market is not formulated – this model negates any drastic deviation in the opinions of experts. Only validated and universally acceptable research findings are quoted in our reports.
We have important check points that we use to validate our research findings – which we call – data triangulation, where we validate the information, we generate from secondary sources with primary interviews and then we re-validate with our internal data bases and Subject matter experts. This comprehensive model enables us to deliver high quality, reliable data in shortest possible time.


 احصل على عينة مجانية لهذا التقرير