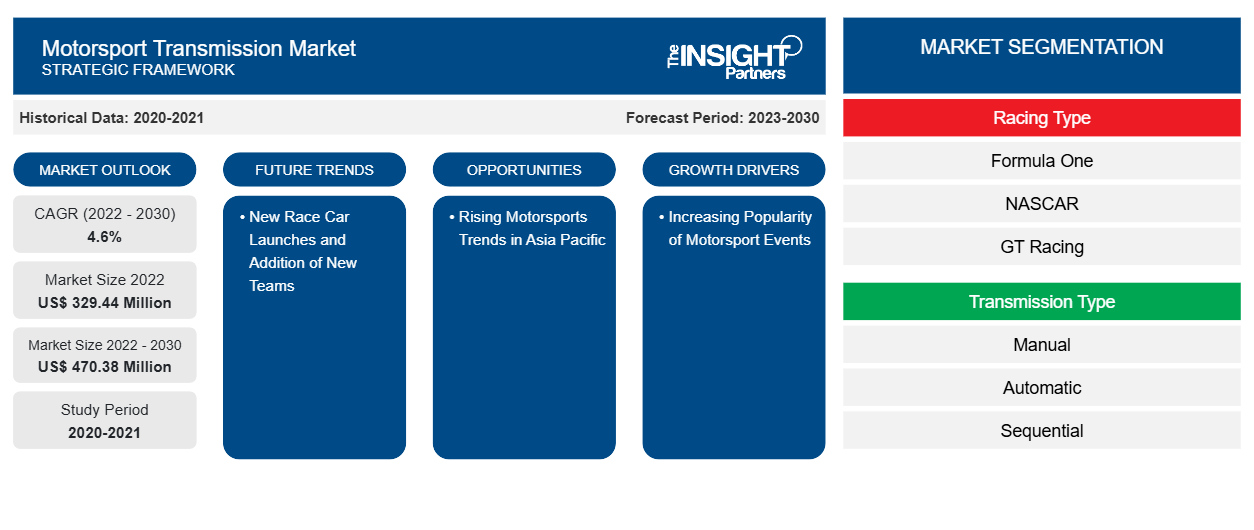
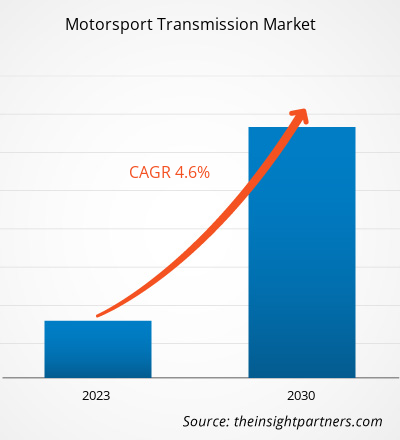
[تقرير بحثي] تم تقييم سوق ناقل الحركة الرياضي بـ 329.44 مليون دولار أمريكي في عام 2022 ومن المتوقع أن يصل إلى 470.38 مليون دولار أمريكي بحلول عام 2030؛ ومن المتوقع أن ينمو بمعدل نمو سنوي مركب قدره 4.6٪ خلال الفترة 2022-2030.
وجهة نظر المحلل:
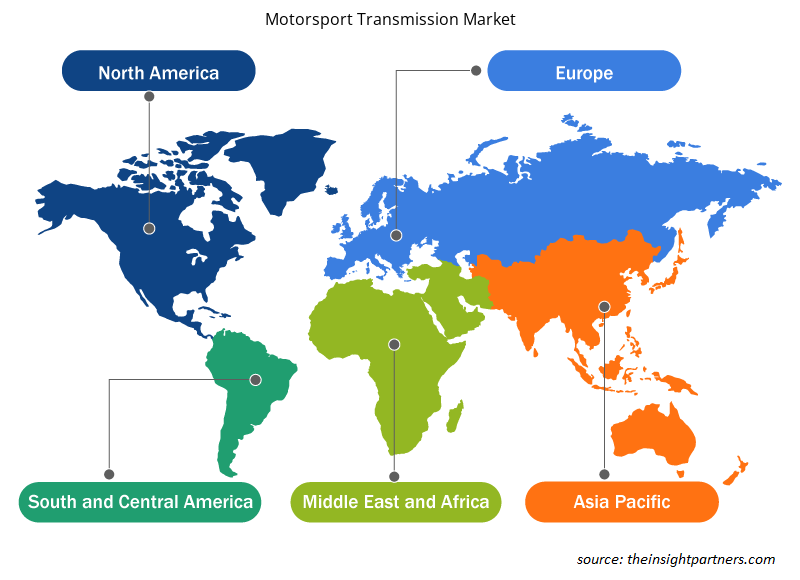
تم تقسيم سوق ناقل الحركة العالمي لرياضة السيارات إلى خمس مناطق رئيسية: أمريكا الشمالية وأوروبا وآسيا والمحيط الهادئ والشرق الأوسط وأفريقيا وجنوب أمريكا. يتم دفع سوق ناقل الحركة العالمي لرياضة السيارات من خلال زيادة بطولات سباق السيارات والشعبية المتزايدة لأحداث السيارات الرياضية على مستوى العالم. تشمل بطولات سباق السيارات الكبرى بطولة العالم للتحمل التابعة للاتحاد الدولي للسيارات، وسلسلة لومان الآسيوية، وسلسلة لومان الأوروبية، وسلسلة كأس ناسكار، وكأس العالم لسيارات السياحة، وبطولة العالم للفورمولا 1، وسوبر فورمولا، وبطولة العالم للفورمولا إي التابعة للاتحاد الدولي للسيارات، وسلسلة إندي كار. إن الشعبية المتزايدة لهذه السيارات السباق، مع الاستثمارات الكبيرة من قبل الشركات المصنعة للمعدات الأصلية لتطوير السيارات في جميع أنحاء العالم، هي العامل الرئيسي الدافع لنمو سوق ناقل الحركة لرياضة السيارات.
يتكون ناقل الحركة في رياضة السيارات من أنظمة يدوية وأوتوماتيكية ومتسلسلة. ومن بين هذه الأنظمة، استحوذ نظام ناقل الحركة المتسلسل على أكبر حصة في عام 2022، وذلك بسبب الاعتماد المتزايد على علبة التروس هذه بين سيارات الفورمولا 1. تعد بطولة سيارات الفورمولا 1 أكثر أنواع السباقات شيوعًا على مستوى العالم، تليها بطولة لومان وبطولة العالم للسياحة. تعد التطورات التكنولوجية والتركيز المتزايد على السلامة والراحة في تطوير سيارات رياضة السيارات من العوامل الرئيسية الدافعة لناقل الحركة المتسلسل في سوق ناقل الحركة العالمي لرياضة السيارات. على سبيل المثال، في ديسمبر 2020، أطلقت شركة HGT Precision علبة تروس متسلسلة لحاملي ترخيص مسابقة MotorSport New Zealand. أنتجت شركة HGT Precision علبة تروس متسلسلة 7075-T651 مع آلة CNC عالية الدقة بخمسة محاور. استخدمت الشركة مواد قوية واعتمدت عملية تصنيع دقيقة لإنتاج تروس قوية وصلبة. تنتج تروس HGT Precision تروسًا ذات أرضية ماسية ذات متانة عالية وضوضاء منخفضة وكفاءة ومقاومة للتآكل. وتساهم مثل هذه الحالات في دفع نمو سوق نقل الحركة في رياضة السيارات.
وبالمثل، في سبتمبر 2021، أطلقت نيسان طراز سيارة سباق GT-R لليابان والسوق العالمية. تم تجهيز هذا الطراز بعلبة تروس متسلسلة، وفرامل مصنوعة من مادة السيراميك الكربوني، وجناح خلفي مصنوع من مادة ألياف الكربون ، وغطاء محرك حصري. إن التطورات في أنظمة نقل الحركة من قبل اللاعبين الرئيسيين وتبني السيارات الرياضية القائمة على نظام نقل الحركة المتسلسل هي التي تدفع سوق نقل الحركة في رياضة السيارات.
قم بتخصيص هذا التقرير ليناسب متطلباتك
ستحصل على تخصيص لأي تقرير - مجانًا - بما في ذلك أجزاء من هذا التقرير، أو تحليل على مستوى الدولة، وحزمة بيانات Excel، بالإضافة إلى الاستفادة من العروض والخصومات الرائعة للشركات الناشئة والجامعات
- احصل على أهم اتجاهات السوق الرئيسية لهذا التقرير.ستتضمن هذه العينة المجانية تحليلاً للبيانات، بدءًا من اتجاهات السوق وحتى التقديرات والتوقعات.
نظرة عامة على السوق:
لقد زادت نسبة مشاهدة رياضة السيارات بشكل كبير في السنوات الأخيرة. بالنظر إلى أحداث رياضة السيارات العالمية، فإن الفورمولا 1 تقف بلا منازع من حيث الجاذبية وعدد المشاهدين، مع حوالي 1.9 مليار مشاهد في موسم 2023. وفقًا لأرقام إندي كار، بلغ متوسط عدد مشاهدي السلسلة 1.403 مليون مشاهد لكل سباق على قناة إن بي سي، بزيادة 2٪ على أساس سنوي. كانت السباقات المزدوجة في حلبة لوا سبيدواي بارزة بشكل خاص، حيث بلغ متوسط عدد مشاهديها 1.21 مليون مشاهد طوال عطلة نهاية الأسبوع، بزيادة 31٪ على أساس سنوي. كان سباق إنديانابوليس 500 أحد أكثر عوامل الجذب في الموسم، بمتوسط 4.94 مليون مشاهد. وبينما زاد هذا عن متوسط العام الماضي البالغ 4.84 مليون مشاهد، فإن عام 2023 هو أحد المواسم الأربعة فقط للسباق التي تلقت أقل من خمسة ملايين متفرج. كل هذه العوامل تدفع نمو سوق ناقل الحركة في رياضة السيارات.
زادت عائدات الأحداث في السنوات القليلة الماضية بسبب الشعبية المتزايدة والإنفاق على أحداث رياضة السيارات. وذكرت شركة Liberty Media، الشركة الأم لـ F1، أن الترويج للسباق حقق 2.5 مليار دولار أمريكي في الدخل في عام 2022، بزيادة 20٪ عن حصيلة العام السابق البالغة 2.1 مليار دولار أمريكي. وبالمقارنة بالعام السابق، زادت الإيرادات الإجمالية لـ Formula 1 بشكل كبير خلال الربع الثالث من عام 2023. استمرت عائدات Formula One في الارتفاع في الربع الثالث من عام 2023، حيث ارتفعت من 715 مليون دولار أمريكي في عام 2022 إلى 887 مليون دولار أمريكي في عام 2023، وهو ما يمثل زيادة بنسبة 24٪. وقد أثرت مثل هذه العوامل بشكل مباشر على سوق ناقل الحركة في رياضة السيارات.
محرك السوق:
إن الشعبية المتزايدة لأحداث رياضة السيارات تدفع نمو سوق ناقل الحركة في رياضة السيارات
زادت نسبة مشاهدة رياضة السيارات بشكل كبير في السنوات الأخيرة. وبالنظر إلى أحداث رياضة السيارات العالمية، فإن الفورمولا 1 تقف بلا منازع من حيث الجاذبية وعدد المشاهدين، مع حوالي 1.9 مليار مشاهد في موسم 2023. وفقًا لأرقام إندي كار، بلغ متوسط عدد مشاهدي السلسلة 1.403 مليون مشاهد لكل سباق على قناة إن بي سي، بزيادة 2٪ على أساس سنوي. كانت السباقات المزدوجة في لوا سبيدواي بارزة بشكل خاص، حيث بلغ متوسطها 1.21 مليون مشاهد طوال عطلة نهاية الأسبوع، بزيادة 31٪ على أساس سنوي. كان سباق إنديانابوليس 500 أحد أكثر عوامل الجذب في الموسم، بمتوسط 4.94 مليون مشاهد. وبينما زاد هذا عن متوسط العام الماضي البالغ 4.84 مليون مشاهد، فإن عام 2023 هو أحد المواسم الأربعة فقط للسباق التي تلقت أقل من خمسة ملايين متفرج. بلغ متوسط عدد مشاهدي موسم الفورمولا 1 في الولايات المتحدة في عام 2022 نحو 1.21 مليون مشاهد لكل سباق على شبكات ESPN وESPN2 وABC، بزيادة قدرها 28% عن الرقم القياسي السابق للتلفزيون الأمريكي والذي بلغ 949 ألف مشاهد في المتوسط في عام 2021. بالإضافة إلى ذلك، كان موسم 2022 هو الأول في تاريخ التلفزيون الأمريكي الذي بلغ متوسط عدد مشاهديه مليون مشاهد لكل سباق. وقد تجتذب قاعدة المشاهدين الضخمة هذه الاستثمار المتوقع لدفع نمو سوق نقل رياضة السيارات.
من حيث عدد المشاهدين التلفزيونيين، تحتل الولايات المتحدة المرتبة الثالثة. مع تزايد الشعبية وزيادة الأحداث المحلية في التقويم، من المرجح أن تقتحم الولايات المتحدة المراكز الخمسة الأولى في السنوات القادمة. معظم البلدان الأخرى التي تشهد نموًا سريعًا في المشاهدة مدرجة بالفعل ضمن المراكز الخمسة الأولى في العالم. ومع ذلك، شهدت الصين وروسيا زيادة كبيرة في عدد المشاهدين. أجرت شبكة موتورسبورت استطلاعًا عالميًا لمشجعي الفورمولا 1 في عام 2021 خلال شهري أغسطس وأكتوبر. تم جمع ما مجموعه 167302 استجابة مكتملة، وهو أكبر عدد على الإطلاق. كان 34٪ من المستجيبين تحت سن 24 عامًا، وكان ما يقرب من 63٪ تحت سن 34 عامًا. أثرت هذه الشعبية المتزايدة لرياضة السيارات بشكل إيجابي على عدد الأحداث. ونتيجة لذلك، ظهرت العديد من أحداث رياضة السيارات الصغيرة الجديدة التي أثرت بشكل مباشر وإيجابي على نمو سوق نقل رياضة السيارات.
التحليل القطاعي:
بناءً على نوع السباق، يتم تقسيم حصة سوق ناقل الحركة في رياضة السيارات العالمية إلى الفورمولا واحد، وناسكار، وسباقات جي تي، وبطولة العالم لسيارات السياحة (WTCC)، ولومان، والرالي والطرق الوعرة، وغيرها. ومن بين هذه السباقات، تتمتع الفورمولا واحد بأكبر حصة في سوق ناقل الحركة في رياضة السيارات نظرًا لوجود هذا الحدث في دول مثل الولايات المتحدة والصين وألمانيا وفرنسا وإيطاليا. كما أن تكلفة سيارات الفورمولا واحد أعلى من تكلفة سيارات السباق الأخرى. أيضًا، في عام 2021، حقق موسم الفورمولا واحد أعلى شعبية، حيث شاهده أكثر من 1.55 مليار مشاهد على مستوى العالم، وجذب حوالي 445 مليون مشاهد فريد في جميع أنحاء العالم.
التحليل الإقليمي:
احتلت أمريكا الشمالية المركز الثاني في سوق نواقل الحركة في رياضة السيارات العالمية. تتمتع الفورمولا 1 بأعلى شعبية في أمريكا الشمالية، بينما أصبحت ناسكار الآن ثاني أكثر رياضة سيارات شعبية في المنطقة. احتلت السوق الأمريكية الحصة القصوى بسبب الوجود القوي لمصنعي السيارات والشغف العميق برياضة السيارات. تتميز شركات مثل Xtrac و G-Force Racing Transmissions بإنتاج نواقل حركة عالية الأداء لمختلف تخصصات رياضة السيارات. يتم دفع سوق نواقل الحركة في رياضة السيارات في الولايات المتحدة بثقافة رياضة السيارات القوية والطلب المرتفع على ناسكار وإندي كار وسباقات السحب وسباقات الطرق الوعرة. تتبع كندا الاتجاه بعد الولايات المتحدة من حيث إجمالي الإيرادات. تستضيف البلاد جولة من بطولة الفورمولا 1، مما يجذب الانتباه العالمي.
تحليل اللاعب الرئيسي:
تعد شركة Marelli Holdings Co Ltd، وRicardo Plc، وDrenth Gearboxes Holland BV، وEMCO Gears Inc، وSamsonas Motorsport UAB، وHewland Engineering Ltd، وZF Friedrichshafen AG، وSADEV SAS، وHolinger Engineering Co Pty Ltd، وXtrac Ltd من بين اللاعبين الرئيسيين في سوق ناقل الحركة لرياضة السيارات الذين يعملون في السوق.
رؤى إقليمية حول سوق ناقل الحركة في رياضة السيارات
لقد قام المحللون في Insight Partners بشرح الاتجاهات والعوامل الإقليمية المؤثرة على سوق ناقل الحركة في رياضة السيارات طوال فترة التوقعات بشكل شامل. يناقش هذا القسم أيضًا قطاعات سوق ناقل الحركة في رياضة السيارات والجغرافيا في جميع أنحاء أمريكا الشمالية وأوروبا ومنطقة آسيا والمحيط الهادئ والشرق الأوسط وأفريقيا وأمريكا الجنوبية والوسطى.

- احصل على البيانات الإقليمية المحددة لسوق ناقل الحركة لرياضة السيارات
نطاق تقرير سوق ناقل الحركة في رياضة السيارات
| سمة التقرير | تفاصيل |
|---|---|
| حجم السوق في عام 2022 | 329.44 مليون دولار أمريكي |
| حجم السوق بحلول عام 2030 | 470.38 مليون دولار أمريكي |
| معدل النمو السنوي المركب العالمي (2022 - 2030) | 4.6% |
| البيانات التاريخية | 2020-2021 |
| فترة التنبؤ | 2023-2030 |
| القطاعات المغطاة | حسب نوع السباق
|
| المناطق والدول المغطاة | أمريكا الشمالية
|
| قادة السوق وملفات تعريف الشركات الرئيسية |
|
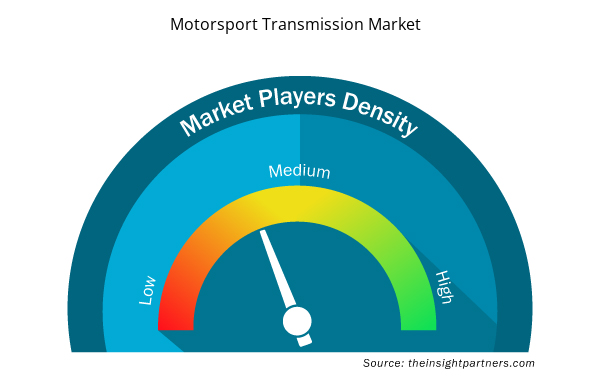
كثافة اللاعبين في سوق ناقل الحركة في رياضة السيارات: فهم تأثيرها على ديناميكيات الأعمال
يشهد سوق ناقل الحركة في رياضة السيارات نموًا سريعًا، مدفوعًا بالطلب المتزايد من المستخدم النهائي بسبب عوامل مثل تفضيلات المستهلك المتطورة والتقدم التكنولوجي والوعي المتزايد بفوائد المنتج. ومع ارتفاع الطلب، تعمل الشركات على توسيع عروضها والابتكار لتلبية احتياجات المستهلكين والاستفادة من الاتجاهات الناشئة، مما يؤدي إلى زيادة نمو السوق.
تشير كثافة اللاعبين في السوق إلى توزيع الشركات أو المؤسسات العاملة في سوق أو صناعة معينة. وهي تشير إلى عدد المنافسين (اللاعبين في السوق) الموجودين في مساحة سوق معينة نسبة إلى حجمها أو قيمتها السوقية الإجمالية.
الشركات الرئيسية العاملة في سوق ناقل الحركة الرياضي هي:
- شركة ماريللي القابضة المحدودة
- شركة ريكاردو المحدودة
- علب التروس درينث هولندا BV
- شركة إيمكو جيرز
- سامسوناس موتورسبورت يو ايه بي
إخلاء المسؤولية : الشركات المذكورة أعلاه ليست مرتبة بأي ترتيب معين.

- احصل على نظرة عامة على أهم اللاعبين الرئيسيين في سوق ناقل الحركة في رياضة السيارات
التطورات الأخيرة:
تتبنى الشركات في سوق ناقل الحركة العالمي لرياضة السيارات بشكل كبير الاستراتيجيات العضوية وغير العضوية مثل عمليات الدمج والاستحواذ. وفيما يلي قائمة ببعض التطورات الأخيرة التي قام بها كبار اللاعبين في سوق ناقل الحركة لرياضة السيارات:
سنة
|
أخبار
|
منطقة
|
مايو 2023 | أعلنت شركة ريكاردو عن شراكة لعدة سنوات مع شركة ماكلارين أوتوموتيف البريطانية المصنعة للسيارات الخارقة لإنتاج محرك V8 من الجيل التالي. | أوروبا |
يوليو 2023 | أعلنت شركة إنفلكشن عن موافقتها على بيع استثماراتها في شركة إكستراك المحدودة ("إكستراك")، الشركة الرائدة في سوق تصنيع أنظمة ناقل الحركة لقطاعات رياضة السيارات والأداء العالي، إلى شركة ميدل جراوند كابيتال، وهي شركة أسهم خاصة متوسطة الحجم في الولايات المتحدة وأوروبا. | أمريكا الشمالية |
- التحليل التاريخي (سنتان)، السنة الأساسية، التوقعات (7 سنوات) مع معدل النمو السنوي المركب
- تحليل PEST و SWOT
- حجم السوق والقيمة / الحجم - عالميًا وإقليميًا وقطريًا
- الصناعة والمنافسة
- مجموعة بيانات Excel


Report Coverage
Revenue forecast, Company Analysis, Industry landscape, Growth factors, and Trends

Segment Covered
This text is related
to segments covered.

Regional Scope
North America, Europe, Asia Pacific, Middle East & Africa, South & Central America

Country Scope
This text is related
to country scope.
الأسئلة الشائعة
Many motorsport teams and automakers across the globe are introducing new track-ready vehicles that are more efficient and effective. In February 2023, McLaren Motorsport confirmed the new 720S GT3 EVO, intended to be built on the 720S's performance at the top of the international GT3 field into the 2023 season and beyond. The 720S GT3 EVO will be homologated for the 2023 season as a new-build race vehicle or as an update package for an existing car.
The majority of the fan base for motorsports is from North America and Europe. Although many motorsport events take place in Asia Pacific, the popularity of such events is comparatively low. However, in recent years, many motorsport events have witnessed massive viewership from Asian countries.
Motorsports viewership has increased dramatically in recent years. Considering the worldwide motorsport events, Formula 1 stands unrivaled in terms of appeal and viewership, with ~1.9 billion viewers in the 2023 season. According to IndyCar numbers, the series averaged 1.403 million viewers per race on NBC, a 2% rise year over year.
The North American region has secured the second position in the global motorsport transmission market. Formula One has the highest popularity in North America, whereas NASCAR has now become the second most popular motorsport in the region. The US market held the maximum share owing to the strong presence of automotive manufacturers and deep-rooted passion for motorsports.
ZF Friedrichshafen, Hewland Engineering Ltd., Xtrac Ltd., Recardo, SADEV SAS, and Marelli Holdings Ltd. are the key market players operating in the global motorsport transmission market.
Trends and growth analysis reports related to Automotive and Transportation : READ MORE..
The List of Companies - Motorsport Transmission Market
- Marelli Holdings Co Ltd
- Ricardo Plc
- Drenth Gearboxes Holland BV
- EMCO Gears Inc
- Samsonas Motorsport UAB
- Hewland Engineering Ltd
- ZF Friedrichshafen AG
- SADEV SAS
- Holinger Engineering Co Pty Ltd
- Xtrac Ltd
The Insight Partners performs research in 4 major stages: Data Collection & Secondary Research, Primary Research, Data Analysis and Data Triangulation & Final Review.
- Data Collection and Secondary Research:
As a market research and consulting firm operating from a decade, we have published and advised several client across the globe. First step for any study will start with an assessment of currently available data and insights from existing reports. Further, historical and current market information is collected from Investor Presentations, Annual Reports, SEC Filings, etc., and other information related to company’s performance and market positioning are gathered from Paid Databases (Factiva, Hoovers, and Reuters) and various other publications available in public domain.
Several associations trade associates, technical forums, institutes, societies and organization are accessed to gain technical as well as market related insights through their publications such as research papers, blogs and press releases related to the studies are referred to get cues about the market. Further, white papers, journals, magazines, and other news articles published in last 3 years are scrutinized and analyzed to understand the current market trends.
- Primary Research:
The primarily interview analysis comprise of data obtained from industry participants interview and answers to survey questions gathered by in-house primary team.
For primary research, interviews are conducted with industry experts/CEOs/Marketing Managers/VPs/Subject Matter Experts from both demand and supply side to get a 360-degree view of the market. The primary team conducts several interviews based on the complexity of the markets to understand the various market trends and dynamics which makes research more credible and precise.
A typical research interview fulfils the following functions:
- Provides first-hand information on the market size, market trends, growth trends, competitive landscape, and outlook
- Validates and strengthens in-house secondary research findings
- Develops the analysis team’s expertise and market understanding
Primary research involves email interactions and telephone interviews for each market, category, segment, and sub-segment across geographies. The participants who typically take part in such a process include, but are not limited to:
- Industry participants: VPs, business development managers, market intelligence managers and national sales managers
- Outside experts: Valuation experts, research analysts and key opinion leaders specializing in the electronics and semiconductor industry.
Below is the breakup of our primary respondents by company, designation, and region:

Once we receive the confirmation from primary research sources or primary respondents, we finalize the base year market estimation and forecast the data as per the macroeconomic and microeconomic factors assessed during data collection.
- Data Analysis:
Once data is validated through both secondary as well as primary respondents, we finalize the market estimations by hypothesis formulation and factor analysis at regional and country level.
- Macro-Economic Factor Analysis:
We analyse macroeconomic indicators such the gross domestic product (GDP), increase in the demand for goods and services across industries, technological advancement, regional economic growth, governmental policies, the influence of COVID-19, PEST analysis, and other aspects. This analysis aids in setting benchmarks for various nations/regions and approximating market splits. Additionally, the general trend of the aforementioned components aid in determining the market's development possibilities.
- Country Level Data:
Various factors that are especially aligned to the country are taken into account to determine the market size for a certain area and country, including the presence of vendors, such as headquarters and offices, the country's GDP, demand patterns, and industry growth. To comprehend the market dynamics for the nation, a number of growth variables, inhibitors, application areas, and current market trends are researched. The aforementioned elements aid in determining the country's overall market's growth potential.
- Company Profile:
The “Table of Contents” is formulated by listing and analyzing more than 25 - 30 companies operating in the market ecosystem across geographies. However, we profile only 10 companies as a standard practice in our syndicate reports. These 10 companies comprise leading, emerging, and regional players. Nonetheless, our analysis is not restricted to the 10 listed companies, we also analyze other companies present in the market to develop a holistic view and understand the prevailing trends. The “Company Profiles” section in the report covers key facts, business description, products & services, financial information, SWOT analysis, and key developments. The financial information presented is extracted from the annual reports and official documents of the publicly listed companies. Upon collecting the information for the sections of respective companies, we verify them via various primary sources and then compile the data in respective company profiles. The company level information helps us in deriving the base number as well as in forecasting the market size.
- Developing Base Number:
Aggregation of sales statistics (2020-2022) and macro-economic factor, and other secondary and primary research insights are utilized to arrive at base number and related market shares for 2022. The data gaps are identified in this step and relevant market data is analyzed, collected from paid primary interviews or databases. On finalizing the base year market size, forecasts are developed on the basis of macro-economic, industry and market growth factors and company level analysis.
- Data Triangulation and Final Review:
The market findings and base year market size calculations are validated from supply as well as demand side. Demand side validations are based on macro-economic factor analysis and benchmarks for respective regions and countries. In case of supply side validations, revenues of major companies are estimated (in case not available) based on industry benchmark, approximate number of employees, product portfolio, and primary interviews revenues are gathered. Further revenue from target product/service segment is assessed to avoid overshooting of market statistics. In case of heavy deviations between supply and demand side values, all thes steps are repeated to achieve synchronization.
We follow an iterative model, wherein we share our research findings with Subject Matter Experts (SME’s) and Key Opinion Leaders (KOLs) until consensus view of the market is not formulated – this model negates any drastic deviation in the opinions of experts. Only validated and universally acceptable research findings are quoted in our reports.
We have important check points that we use to validate our research findings – which we call – data triangulation, where we validate the information, we generate from secondary sources with primary interviews and then we re-validate with our internal data bases and Subject matter experts. This comprehensive model enables us to deliver high quality, reliable data in shortest possible time.


 احصل على عينة مجانية لهذا التقرير