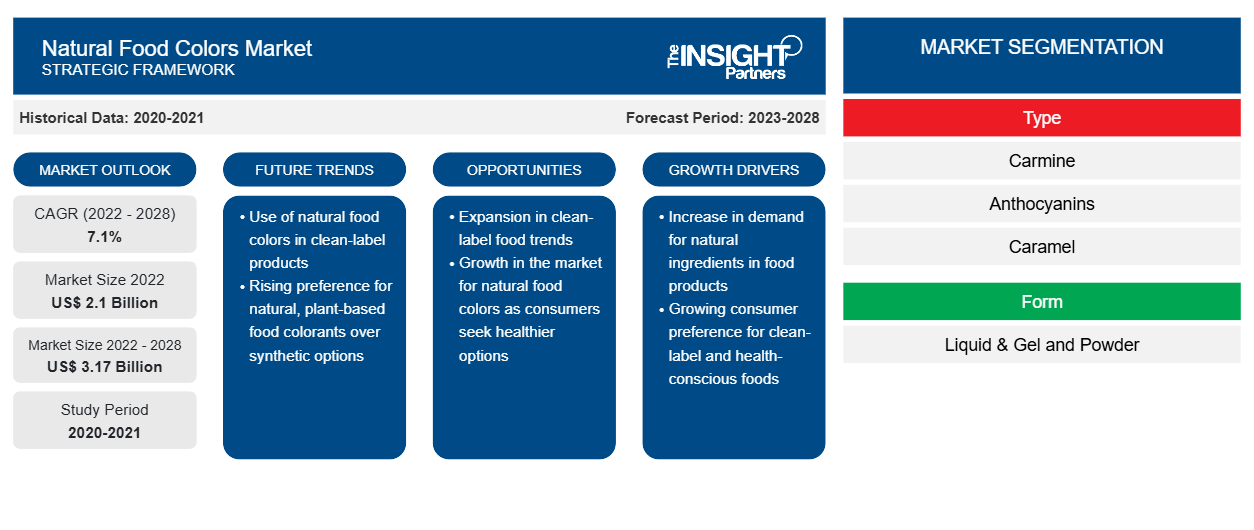
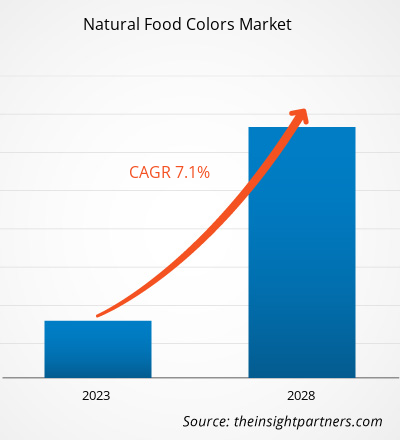
[تقرير بحثي] من المتوقع أن يصل سوق ألوان الطعام الطبيعية إلى 3.17 مليار دولار أمريكي بحلول عام 2028 من 2.10 مليار دولار أمريكي في عام 2022. ومن المتوقع أن ينمو بمعدل نمو سنوي مركب قدره 7.1٪ خلال الفترة 2022-2028.
هناك زيادة في الطلب على ألوان الطعام الطبيعية، وذلك بسبب زيادة الوعي بين المستهلكين حول الآثار الضارة للألوان الصناعية وارتفاع القواعد واللوائح الحكومية فيما يتعلق باستخدام الألوان الصناعية. أصبح معظم الناس في الوقت الحاضر واعين بصحتهم ويختارون المنتجات العضوية والطبيعية. ألوان الطعام الطبيعية آمنة للاستهلاك وتضيف إلى القيمة الغذائية للطعام. بالإضافة إلى ذلك، لا تحتوي ألوان الطعام الطبيعية على مكونات شائعة معرضة للحساسية. بدلاً من ذلك، تحتوي على مضادات الأكسدة التي تقلل من خطر الإصابة بالعديد من الأمراض. كل هذه العوامل تدفع السوق.
من المتوقع أن يشهد السوق نموًا كبيرًا في السنوات القادمة بسبب الوجود القوي للاعبين البارزين مثل Koninklijke DSM NV وSensient Technologies وArcher Daniels Midland Company. لقد اكتسبت مجموعة كبيرة ومتنوعة من ألوان الطعام الطبيعية اهتمام المستهلكين. كان هناك اتجاه متزايد نحو استهلاك منتجات الأغذية الجاهزة والمعبأة الجاهزة. ومن المتوقع أن يوفر هذا العامل فرصًا جديدة لمصنعي ألوان الطعام الطبيعية خلال فترة التنبؤ.
في عام 2021، استحوذت أوروبا على الحصة الرئيسية في سوق ألوان الطعام الطبيعية العالمية . ومع ذلك، من المتوقع أن تسجل منطقة آسيا والمحيط الهادئ أعلى معدل نمو سنوي مركب في السوق خلال فترة التوقعات. يتم تقسيم سوق آسيا والمحيط الهادئ إلى الصين والهند وأستراليا واليابان وكوريا الجنوبية وبقية منطقة آسيا والمحيط الهادئ. تعد صناعة الأغذية والمشروبات واحدة من الصناعات المزدهرة في منطقة آسيا والمحيط الهادئ بسبب ارتفاع عدد السكان وتغيير عادات الأكل لدى المستهلكين. يشهد المستهلكون في البلدان النامية زيادة حادة في دخلهم المتاح، مما يرفع قدرتهم الشرائية. يعد ارتفاع مستويات الدخل المتاح للمستهلكين ونمو الطبقة المتوسطة من بين العوامل الرئيسية التي تدفع سوق ألوان الطعام الطبيعية في المنطقة.
قم بتخصيص هذا التقرير ليناسب متطلباتك
ستحصل على تخصيص لأي تقرير - مجانًا - بما في ذلك أجزاء من هذا التقرير، أو تحليل على مستوى الدولة، وحزمة بيانات Excel، بالإضافة إلى الاستفادة من العروض والخصومات الرائعة للشركات الناشئة والجامعات
- احصل على أهم اتجاهات السوق الرئيسية لهذا التقرير.ستتضمن هذه العينة المجانية تحليلاً للبيانات، بدءًا من اتجاهات السوق وحتى التقديرات والتوقعات.
تأثير جائحة كوفيد-19 على سوق الألوان الغذائية الطبيعية
قبل جائحة كوفيد-19، كان نمو سوق ألوان الطعام الطبيعية مدفوعًا في المقام الأول بالطلب المتزايد على المنتجات الغذائية العضوية والطبيعية ذات القيمة الغذائية العالية. ومع ذلك، واجهت السوق عقبات خلال الربع الأول من عام 2020 بسبب إغلاق الأعمال ونقص المواد الخام والعمالة. أدت جائحة كوفيد-19 إلى ركود اقتصادي في الأشهر الأولى من عام 2020، مما خلق صعوبات مالية للمستهلكين من ذوي الدخل المنخفض والمتوسط.
علاوة على ذلك، وبسبب القيود، بقي الناس في منازلهم وطهوا في منازلهم، مما أدى إلى زيادة الطلب على المنتجات الغذائية المعبأة التي يسهل طهيها. وقد أدى هذا إلى زيادة الطلب على منتجات الأغذية الجاهزة والجاهزة للاستخدام، مما أدى إلى نمو سوق ألوان الطعام الطبيعية. كما أصبح المستهلكون مهتمين بالصحة ويفضلون المنتجات الغذائية الطبيعية والأكثر أمانًا للاستهلاك. وقد أدى هذا إلى نمو السوق خلال جائحة كوفيد-19.
رؤى السوق
زيادة ميل المستهلكين نحو المنتجات ذات العلامة النظيفة
يعتقد الكثير من الناس أن منتجات الأغذية والمشروبات تكون أكثر صحة فقط عندما تحمل ملصقًا يحتوي على مكونات معروفة. وقد دخلت صناعة الأغذية والمشروبات مرحلة المنتجات ذات الملصقات النظيفة، مما دفع الشركات المصنعة إلى تبني ألوان الطعام الطبيعية للحصول على ميزة تنافسية. كما تجتذب المنتجات ذات الملصقات النظيفة المزيد من العملاء، حيث يشعر المستهلكون براحة أكبر عند استهلاك المنتجات ذات المكونات المعروفة.
يتزايد ميل المستهلكين نحو المنتجات ذات العلامات التجارية النظيفة بسبب ارتفاع الوعي الصحي وغش الأغذية. ويؤدي هذا إلى قيام المستهلكين بالنظر إلى الملصقات قبل شراء أي منتج. ومن المتوقع أن يكون هذا العامل محركًا حاسمًا لسوق ألوان الطعام الطبيعية.
رؤى الفئة
بناءً على نوع المنتج، يتم تقسيم سوق ألوان الطعام الطبيعية العالمية إلى كارمين ، أنثوسيانين، كراميل، كركمين، أناتو، كاروتينات، كلوروفيل وغيرها. في عام 2021، استحوذ قطاع الكاروتينات على أكبر حصة من الإيرادات، ومن المتوقع أن يشكل قطاع الأنثوسيانين أعلى معدل نمو خلال فترة التوقعات. تُشتق ألوان الطعام الطبيعية من النباتات والحيوانات والمواد العضوية الأخرى. وهي آمنة للاستهلاك لأنها لا تحتوي على مكونات معرضة للحساسية.
تعد Koninklijke DSM NV وSensient Technologies وArcher Daniels Midland Company وDöhler Group وBASF SE وNaturex SA وAromata Group وGivaudan وDupont وOterra A/S وMane KANCOR من بين اللاعبين العاملين في السوق. توفر هذه الشركات مجموعة واسعة من محافظ المنتجات للسوق. تتمتع الشركات بحضورها في المناطق النامية، مما يوفر فرصًا مربحة في السوق. يعمل اللاعبون في السوق على تطوير منتجات عالية الجودة ومبتكرة لتلبية متطلبات العملاء.
رؤى إقليمية حول سوق الألوان الغذائية الطبيعية
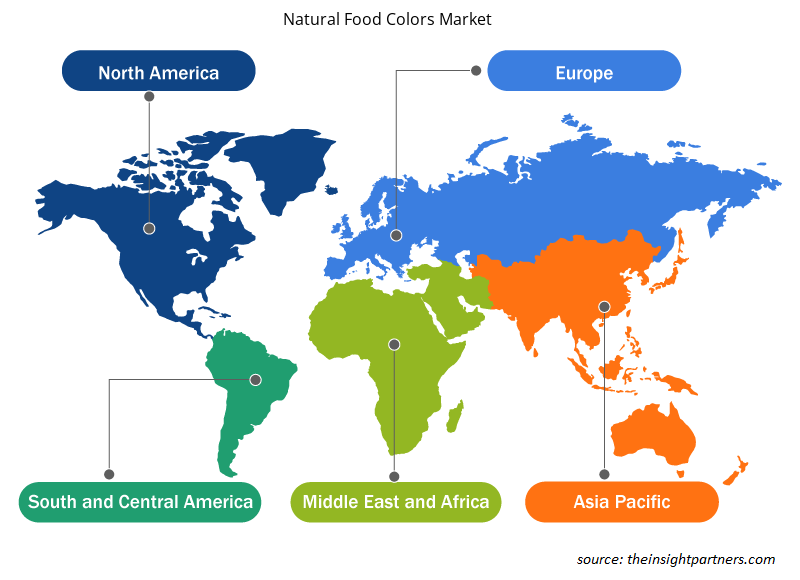
لقد قام المحللون في Insight Partners بشرح الاتجاهات والعوامل الإقليمية المؤثرة على سوق ألوان الطعام الطبيعية طوال فترة التوقعات بشكل شامل. يناقش هذا القسم أيضًا قطاعات سوق ألوان الطعام الطبيعية والجغرافيا في جميع أنحاء أمريكا الشمالية وأوروبا ومنطقة آسيا والمحيط الهادئ والشرق الأوسط وأفريقيا وأمريكا الجنوبية والوسطى.

- احصل على البيانات الإقليمية المحددة لسوق الألوان الغذائية الطبيعية
نطاق تقرير سوق الألوان الغذائية الطبيعية
| سمة التقرير | تفاصيل |
|---|---|
| حجم السوق في عام 2022 | 2.1 مليار دولار أمريكي |
| حجم السوق بحلول عام 2028 | 3.17 مليار دولار أمريكي |
| معدل النمو السنوي المركب العالمي (2022 - 2028) | 7.1% |
| البيانات التاريخية | 2020-2021 |
| فترة التنبؤ | 2023-2028 |
| القطاعات المغطاة | حسب النوع
|
| المناطق والدول المغطاة | أمريكا الشمالية
|
| قادة السوق وملفات تعريف الشركات الرئيسية |
|
كثافة اللاعبين في سوق الألوان الغذائية الطبيعية: فهم تأثيرها على ديناميكيات الأعمال
يشهد سوق ألوان الطعام الطبيعية نموًا سريعًا، مدفوعًا بالطلب المتزايد من المستخدم النهائي بسبب عوامل مثل تفضيلات المستهلك المتطورة والتقدم التكنولوجي والوعي المتزايد بفوائد المنتج. ومع ارتفاع الطلب، تعمل الشركات على توسيع عروضها والابتكار لتلبية احتياجات المستهلكين والاستفادة من الاتجاهات الناشئة، مما يؤدي إلى زيادة نمو السوق.
تشير كثافة اللاعبين في السوق إلى توزيع الشركات أو المؤسسات العاملة في سوق أو صناعة معينة. وهي تشير إلى عدد المنافسين (اللاعبين في السوق) الموجودين في مساحة سوق معينة نسبة إلى حجمها أو قيمتها السوقية الإجمالية.
الشركات الرئيسية العاملة في سوق الألوان الغذائية الطبيعية هي:
- شركة كونيكليكي دي إس إم إن في
- تقنيات حساسة
- شركة آرتشر دانييلز ميدلاند
- مجموعة دوهلر
- باسف اس اي
إخلاء المسؤولية : الشركات المذكورة أعلاه ليست مرتبة بأي ترتيب معين.

- احصل على نظرة عامة على أهم اللاعبين الرئيسيين في سوق الألوان الغذائية الطبيعية
تقرير يسلط الضوء على
- اتجاهات الصناعة التقدمية في السوق لمساعدة اللاعبين على تطوير استراتيجيات فعالة طويلة الأجل
- استراتيجيات نمو الأعمال التي تتبناها الأسواق المتقدمة والنامية
- التحليل الكمي لحجم سوق منتجات الألوان الغذائية الطبيعية من 2020 إلى 2028
- تقدير الطلب العالمي على الألوان الغذائية الطبيعية
- تحليل PEST لتوضيح فعالية المشترين والموردين العاملين في الصناعة
- التطورات الأخيرة لفهم سيناريو السوق التنافسي
- اتجاهات السوق وتوقعاته والعوامل التي تدفع وتكبح نمو سوق الألوان الغذائية الطبيعية
- المساعدة في عملية اتخاذ القرار من خلال تسليط الضوء على استراتيجيات السوق التي تدعم المصلحة التجارية، مما يؤدي إلى نمو السوق
- حجم سوق الألوان الغذائية الطبيعية في مختلف العقد
- نظرة عامة مفصلة وتقسيم السوق، بالإضافة إلى ديناميكيات صناعة ألوان الطعام الطبيعية
- حجم سوق الألوان الغذائية الطبيعية في مختلف المناطق مع فرص نمو واعدة
"تحليل سوق ألوان الطعام الطبيعية حتى عام 2028" هو دراسة متخصصة ومتعمقة لصناعة السلع الاستهلاكية مع التركيز بشكل خاص على تحليل اتجاه سوق ألوان الطعام الطبيعية العالمية. يهدف التقرير إلى تقديم نظرة عامة على السوق مع تقسيم السوق بالتفصيل.
يتم تحليل سوق ألوان الطعام الطبيعية بناءً على النوع والشكل والتطبيق والجغرافيا. بناءً على النوع، يتم تقسيم سوق ألوان الطعام الطبيعية العالمية إلى كارمين وأنثوسيانين وكراميل وكركمين وأناتو وكاروتينات وكلوروفيل وغيرها. من حيث الشكل، يتم تقسيم سوق ألوان الطعام الطبيعية العالمية إلى سائل وهلامي ومسحوق. بناءً على التطبيق، يتم تقسيم سوق ألوان الطعام الطبيعية العالمية إلى المخابز والحلويات ومنتجات الألبان والحلويات المجمدة والمشروبات والصلصات والتوابل ومنتجات RTC وRTE واللحوم والدواجن والمأكولات البحرية وغيرها. من حيث الجغرافيا، يتم تقسيم السوق على نطاق واسع إلى أمريكا الشمالية وأوروبا وآسيا والمحيط الهادئ (APAC) والشرق الأوسط وأفريقيا (MEA) وأمريكا الجنوبية والوسطى.
ملفات تعريف الشركة
تعد شركة Koninklijke DSM NV، وSensient Technologies، وArcher Daniels Midland Company، وDöhler Group، وBASF SE، وNaturex SA، وAromata Group، وGivaudan، وDupont، وOterra A/S، وMane KANCOR من بين اللاعبين البارزين الذين يعملون في سوق الألوان الغذائية الطبيعية العالمية.
- التحليل التاريخي (سنتان)، السنة الأساسية، التوقعات (7 سنوات) مع معدل النمو السنوي المركب
- تحليل PEST و SWOT
- حجم السوق والقيمة / الحجم - عالميًا وإقليميًا وقطريًا
- الصناعة والمنافسة
- مجموعة بيانات Excel


Report Coverage
Revenue forecast, Company Analysis, Industry landscape, Growth factors, and Trends

Segment Covered
This text is related
to segments covered.

Regional Scope
North America, Europe, Asia Pacific, Middle East & Africa, South & Central America

Country Scope
This text is related
to country scope.
الأسئلة الشائعة
Availability of a wide range of natural food colors has allowed consumers to opt for natural food products instead of synthetic ones. There is a wide range of natural food colors that is available in the market. Newly introduced colors, and trends have increased the product portfolios of many companies. Manufacturers such as Naturex, Oterra, and Kancor offer wide range of natural food colors in the market. Growing trends of mix and match colors has also affected in increasing the range of colors. Aromata Group has recently added a range of shades range, that has many different colors used in sweet and savory applications.
Based on the application, beverages segment accounted for the highest share of the global market in 2021. The beverages industry is growing rapidly, and people are preferring beverages which contain natural ingredients.
Based on the segment type, anthocyanins is expected to be the fastest-growing segment during the forecast period. Anthocyanins possess antidiabetic, anticancer, anti-inflammatory, antimicrobial, and anti-obesity effects, as well as prevention of cardiovascular diseases (CVDs). Therefore, anthocyanins extracted from edible plants have various health benefits.
Rising consumer concerns about synthetic ingredients and increasing consumer proclivity towards clean label products are drivers of natural food colors market. Natural food colors contain antioxidants which are helpful in reducing risk of various diseases. Increasing health awareness among consumers have risen the demand for natural and organic food products.
The major players operating in the global natural food colors market are Koninklijke DSM N.V., Sensient Technologies, Archer Daniels Midland Company, Döhler Group, BASF SE, Naturex S.A, Aromata Group, Givaudan, Dupont, Oterra A/S, and Mane KANCOR.
In 2021, Europe accounted for the largest share of the global natural food colors market. The growth of the natural food colors industry is also attributed to the rising awareness regarding the harmful effects of synthetic colors. People are trying to consume organic and natural food products as they are safe and healthy for human body. This factor is driving the growth of the natural food colors market in the region.
Trends and growth analysis reports related to Food and Beverages : READ MORE..
The List of Companies - Natural Food Colors Market
- Koninklijke DSM N.V.
- Sensient Technologies
- Archer Daniels Midland Company
- Döhler Group
- BASF SE
- Naturex S.A
- Aromata Group
- Givaudan
- Dupont
- Oterra A/S
- Mane KANCOR
The Insight Partners performs research in 4 major stages: Data Collection & Secondary Research, Primary Research, Data Analysis and Data Triangulation & Final Review.
- Data Collection and Secondary Research:
As a market research and consulting firm operating from a decade, we have published and advised several client across the globe. First step for any study will start with an assessment of currently available data and insights from existing reports. Further, historical and current market information is collected from Investor Presentations, Annual Reports, SEC Filings, etc., and other information related to company’s performance and market positioning are gathered from Paid Databases (Factiva, Hoovers, and Reuters) and various other publications available in public domain.
Several associations trade associates, technical forums, institutes, societies and organization are accessed to gain technical as well as market related insights through their publications such as research papers, blogs and press releases related to the studies are referred to get cues about the market. Further, white papers, journals, magazines, and other news articles published in last 3 years are scrutinized and analyzed to understand the current market trends.
- Primary Research:
The primarily interview analysis comprise of data obtained from industry participants interview and answers to survey questions gathered by in-house primary team.
For primary research, interviews are conducted with industry experts/CEOs/Marketing Managers/VPs/Subject Matter Experts from both demand and supply side to get a 360-degree view of the market. The primary team conducts several interviews based on the complexity of the markets to understand the various market trends and dynamics which makes research more credible and precise.
A typical research interview fulfils the following functions:
- Provides first-hand information on the market size, market trends, growth trends, competitive landscape, and outlook
- Validates and strengthens in-house secondary research findings
- Develops the analysis team’s expertise and market understanding
Primary research involves email interactions and telephone interviews for each market, category, segment, and sub-segment across geographies. The participants who typically take part in such a process include, but are not limited to:
- Industry participants: VPs, business development managers, market intelligence managers and national sales managers
- Outside experts: Valuation experts, research analysts and key opinion leaders specializing in the electronics and semiconductor industry.
Below is the breakup of our primary respondents by company, designation, and region:

Once we receive the confirmation from primary research sources or primary respondents, we finalize the base year market estimation and forecast the data as per the macroeconomic and microeconomic factors assessed during data collection.
- Data Analysis:
Once data is validated through both secondary as well as primary respondents, we finalize the market estimations by hypothesis formulation and factor analysis at regional and country level.
- Macro-Economic Factor Analysis:
We analyse macroeconomic indicators such the gross domestic product (GDP), increase in the demand for goods and services across industries, technological advancement, regional economic growth, governmental policies, the influence of COVID-19, PEST analysis, and other aspects. This analysis aids in setting benchmarks for various nations/regions and approximating market splits. Additionally, the general trend of the aforementioned components aid in determining the market's development possibilities.
- Country Level Data:
Various factors that are especially aligned to the country are taken into account to determine the market size for a certain area and country, including the presence of vendors, such as headquarters and offices, the country's GDP, demand patterns, and industry growth. To comprehend the market dynamics for the nation, a number of growth variables, inhibitors, application areas, and current market trends are researched. The aforementioned elements aid in determining the country's overall market's growth potential.
- Company Profile:
The “Table of Contents” is formulated by listing and analyzing more than 25 - 30 companies operating in the market ecosystem across geographies. However, we profile only 10 companies as a standard practice in our syndicate reports. These 10 companies comprise leading, emerging, and regional players. Nonetheless, our analysis is not restricted to the 10 listed companies, we also analyze other companies present in the market to develop a holistic view and understand the prevailing trends. The “Company Profiles” section in the report covers key facts, business description, products & services, financial information, SWOT analysis, and key developments. The financial information presented is extracted from the annual reports and official documents of the publicly listed companies. Upon collecting the information for the sections of respective companies, we verify them via various primary sources and then compile the data in respective company profiles. The company level information helps us in deriving the base number as well as in forecasting the market size.
- Developing Base Number:
Aggregation of sales statistics (2020-2022) and macro-economic factor, and other secondary and primary research insights are utilized to arrive at base number and related market shares for 2022. The data gaps are identified in this step and relevant market data is analyzed, collected from paid primary interviews or databases. On finalizing the base year market size, forecasts are developed on the basis of macro-economic, industry and market growth factors and company level analysis.
- Data Triangulation and Final Review:
The market findings and base year market size calculations are validated from supply as well as demand side. Demand side validations are based on macro-economic factor analysis and benchmarks for respective regions and countries. In case of supply side validations, revenues of major companies are estimated (in case not available) based on industry benchmark, approximate number of employees, product portfolio, and primary interviews revenues are gathered. Further revenue from target product/service segment is assessed to avoid overshooting of market statistics. In case of heavy deviations between supply and demand side values, all thes steps are repeated to achieve synchronization.
We follow an iterative model, wherein we share our research findings with Subject Matter Experts (SME’s) and Key Opinion Leaders (KOLs) until consensus view of the market is not formulated – this model negates any drastic deviation in the opinions of experts. Only validated and universally acceptable research findings are quoted in our reports.
We have important check points that we use to validate our research findings – which we call – data triangulation, where we validate the information, we generate from secondary sources with primary interviews and then we re-validate with our internal data bases and Subject matter experts. This comprehensive model enables us to deliver high quality, reliable data in shortest possible time.


 احصل على عينة مجانية لهذا التقرير