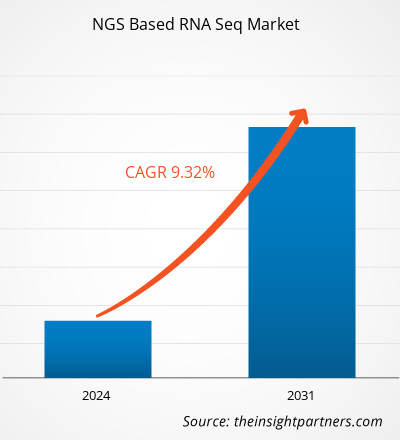
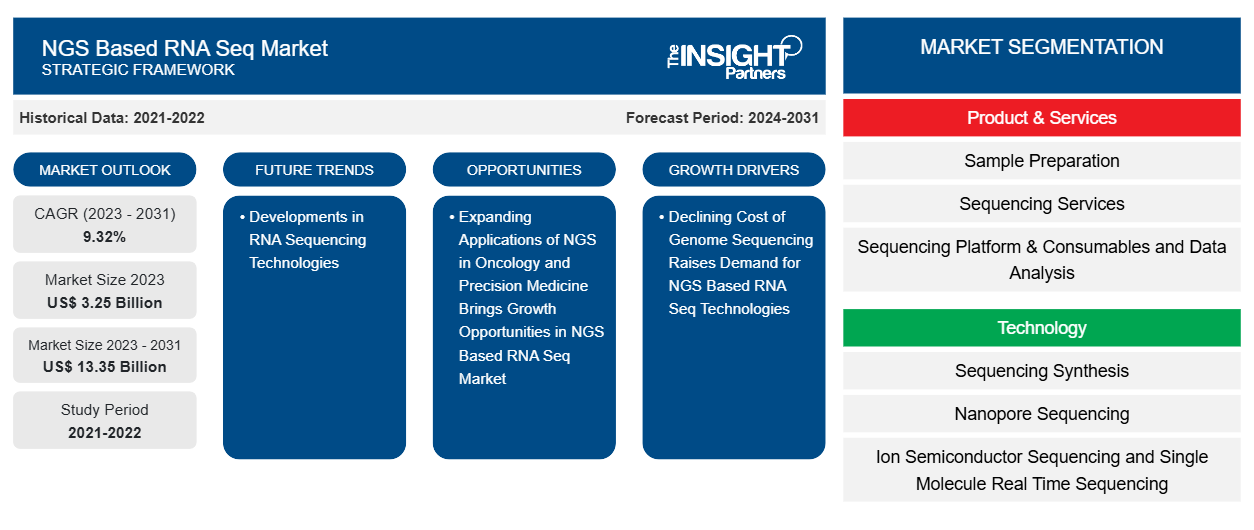
من المتوقع أن يصل حجم سوق تسلسل الحمض النووي الريبي المستند إلى الجيل التالي من التسلسلات إلى 13.35 مليار دولار أمريكي بحلول عام 2031 من 3.25 مليار دولار أمريكي في عام 2023. ومن المتوقع أن يسجل السوق معدل نمو سنوي مركب بنسبة 9.32٪ خلال الفترة 2023-2031. ومن المرجح أن يظل التبني المتزايد لمسح الباركود لتسلسلات الحمض النووي الريبي ذات القراءات الطويلة من الاتجاهات الرئيسية في السوق.
تحليل سوق RNA Seq القائم على NGS
التسلسل الجيني من الجيل التالي (NGS) هو تقنية عالية الإنتاجية وقابلة للتطوير وسريعة تُستخدم لتحديد ترتيب النوكليوتيدات في الجينومات بأكملها أو مناطق محددة من الحمض النووي أو الحمض النووي الريبي. وقد حولت تقنية التسلسل الجيني من الجيل التالي تسلسل الحمض النووي الريبي في السنوات الأخيرة من خلال تزويد الباحثين بالوصول إلى البيانات الجينومية والنسخية. وفي معظم الدول المتقدمة، تعمل طريقة التسلسل الجيني من الجيل التالي على تطوير علاجات للسرطان من خلال علاجات جديدة. ومن المتوقع أن يؤدي الانخفاض الملحوظ في تكلفة التسلسل الجيني القائم على تقنية التسلسل الجيني من الجيل التالي والتقدم في تقنية التسلسل إلى دفع نمو السوق خلال فترة التنبؤ.
نظرة عامة على سوق RNA Seq المستند إلى NGS
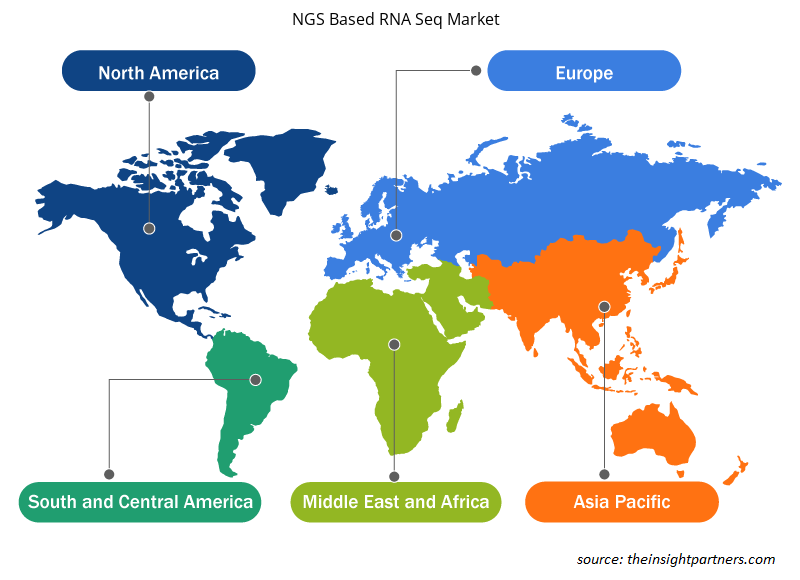
من المتوقع أن يتوسع آسيا والمحيط الهادئ بأعلى معدل نمو سنوي مركب من عام 2023 إلى عام 2031، وذلك بسبب الاستثمارات المتزايدة التي تقوم بها الحكومة الوطنية المعنية في ورش العمل والمؤتمرات المتنامية حول تسلسل الجيل التالي . لقد خضعت بلدان في آسيا والمحيط الهادئ، مثل الهند وسنغافورة، وما إلى ذلك، لتحولات اقتصادية مختلفة في السنوات الأخيرة بسبب آثار الركود والعولمة. وقد أدى هذا إلى ارتفاع الإنفاق على الرعاية الصحية. ومن المرجح أن تنمو اقتصادات بلدان مثل الصين واليابان. تجري الصين تجارب سريرية أكثر شمولاً للتسلسل من الولايات المتحدة. ويدعم اقتصاد البلاد بشكل كبير صناعة الرعاية الصحية. وبالمثل، يساهم قطاع الرعاية الصحية بشكل كبير في نمو اقتصاد اليابان. بالإضافة إلى ذلك، يساهم تقديم منتجات وخدمات تسلسل الحمض النووي الريبي الجديدة القائمة على الجيل التالي من الجينوم من قبل الشركات في نمو السوق.
قم بتخصيص هذا التقرير ليناسب متطلباتك
ستحصل على تخصيص لأي تقرير - مجانًا - بما في ذلك أجزاء من هذا التقرير، أو تحليل على مستوى الدولة، وحزمة بيانات Excel، بالإضافة إلى الاستفادة من العروض والخصومات الرائعة للشركات الناشئة والجامعات
-
احصل على أهم اتجاهات السوق الرئيسية لهذا التقرير.ستتضمن هذه العينة المجانية تحليلاً للبيانات، بدءًا من اتجاهات السوق وحتى التقديرات والتوقعات.
محركات وفرص سوق تسلسل الحمض النووي الريبي المستند إلى NGS
انخفاض تكلفة تسلسل الجينوم لصالح السوق
في السنوات الأخيرة، انخفضت أسعار تسلسل الجيل التالي بشكل كبير. وفقًا للمعهد الوطني لأبحاث الجينوم البشري (NHGRI)، كانت تكلفة التسلسل لكل جينوم 993 دولارًا أمريكيًا في فبراير 2019، والتي انخفضت إلى 525 دولارًا أمريكيًا في مايو 2022. يساعد الانخفاض السريع في التكلفة في تسريع البحث السريري بسعر أقل. من المرجح أن يكون هذا مغريًا لمساعدة الشركات الناشئة على صحة المستهلكين. على سبيل المثال، في فبراير 2020، أطلقت Nebula Genomics ابتكارها، حيث قدمت تسلسل الجينوم الكامل 30x مباشرة للمستهلك مقابل 299 دولارًا أمريكيًا.
بالإضافة إلى ذلك، قدم كبار اللاعبين في السوق مثل Illumina وHoffman La Roche Ltd تقنيات رائدة أدت إلى تقليل تكلفة ووقت تسلسل الجينوم
توسيع نطاق تطبيقات الجيل التالي من التسلسل في علم الأورام والطب الدقيق يوفر فرصًا للنمو
إن الطب الدقيق قادر على خفض النفقات الطبية من خلال التحول من العلاجات التقليدية المعممة إلى الأساليب الوقائية والتنبؤية الفردية. ويمكن لـ NGS تسريع التشخيص المبكر للأمراض واكتشاف المؤشرات الحيوية الدوائية التي تساعد في تخصيص العلاجات. وهو أحد أهم التطورات في التقنيات الجينومية فيما يتعلق باكتشاف المؤشرات الحيوية المسببة للسرطان وتشخيصها. ويمكن استخدام NGS في علم الأورام السريري لتعزيز علاج السرطان، بما في ذلك تحديد الطفرات الجديدة واكتشاف حاملي الطفرات السرطانية وتنفيذ الطب الشخصي. وبالتالي، فإن الطب الدقيق يمكّن من علاج الأمراض الوراثية المختلفة في حين يلعب NGS دورًا حيويًا في كلا التطبيقين، مما يمنحه مجموعة من الفرص في المستقبل.
تقرير تحليل تجزئة سوق التسلسل الجيني المستند إلى NGS
إن القطاعات الرئيسية التي ساهمت في اشتقاق تحليل سوق RNA seq القائم على NGS هي المنتج والخدمات والتكنولوجيا والتطبيق والمستخدم النهائي.
- تم تقسيم سوق تسلسل الحمض النووي الريبي المستند إلى NGS بناءً على المنتجات والخدمات إلى تحضير العينات وخدمات التسلسل ومنصة التسلسل والمواد الاستهلاكية وتحليل البيانات وتخزينها وإدارتها. احتل قطاع منصة التسلسل والمواد الاستهلاكية وتحليل البيانات أكبر حصة في السوق في عام 2023.
- من حيث التكنولوجيا، يتم تقسيم السوق إلى تسلسل عن طريق التخليق، وتسلسل النانوبور، وتسلسل أشباه الموصلات الأيونية، وتسلسل الجزيء الواحد في الوقت الفعلي. احتلت شريحة التسلسل عن طريق التخليق أكبر حصة في السوق في عام 2023.
- من حيث التطبيق، يتم تقسيم السوق إلى التشخيص واكتشاف الأدوية والطب الدقيق وغيرها. احتل قطاع التشخيص حصة كبيرة من السوق في عام 2023.
حسب المستخدم النهائي، يتم تقسيم السوق إلى شركات التكنولوجيا الحيوية والأدوية والمستشفيات والعيادات ومراكز الأبحاث والمعاهد الأكاديمية والحكومية وغيرها.
تحليل حصة سوق RNA Seq المستند إلى NGS حسب المنطقة الجغرافية
ينقسم النطاق الجغرافي لتقرير سوق RNA seq القائم على NGS بشكل أساسي إلى خمس مناطق: أمريكا الشمالية، وآسيا والمحيط الهادئ، وأوروبا، والشرق الأوسط وأفريقيا، وأمريكا الجنوبية والوسطى.
تحتل أمريكا الشمالية الحصة الأكبر في سوق تسلسل الجيل التالي. يتم تحليل سوق تسلسل الحمض النووي الريبي المستند إلى الجيل التالي في أمريكا الشمالية على أساس ثلاث دول رئيسية: الولايات المتحدة وكندا والمكسيك. ومن المتوقع أن تحظى الولايات المتحدة بحصة أكبر في سوق تسلسل الحمض النووي الريبي المستند إلى الجيل التالي في أمريكا الشمالية في عام 2023. يتميز النمو في هذه المنطقة بإطلاق المنتجات المتزايدة وتبني الاستراتيجيات غير العضوية من قبل اللاعبين الرئيسيين الموجودين في المنطقة. على سبيل المثال، في عام 2020، استحوذت شركة Pacific Biosciences of California, Inc. على شركة Omniome, Inc.، وهي شركة مطورة لتقنيات التسلسل الجديدة. كان الهدف من الاستحواذ توسيع محفظة منتجات Pacific Biosciences في سوق التسلسل.
رؤى إقليمية حول سوق RNA Seq المستند إلى NGS
لقد قام المحللون في Insight Partners بشرح الاتجاهات والعوامل الإقليمية المؤثرة على سوق NGS Based RNA Seq طوال فترة التنبؤ بشكل شامل. يناقش هذا القسم أيضًا قطاعات سوق NGS Based RNA Seq والجغرافيا في جميع أنحاء أمريكا الشمالية وأوروبا ومنطقة آسيا والمحيط الهادئ والشرق الأوسط وأفريقيا وأمريكا الجنوبية والوسطى.

- احصل على البيانات الإقليمية المحددة لسوق RNA Seq القائم على NGS
نطاق تقرير سوق تسلسل الحمض النووي الريبي المستند إلى NGS
| سمة التقرير | تفاصيل |
|---|---|
| حجم السوق في عام 2023 | 3.25 مليار دولار أمريكي |
| حجم السوق بحلول عام 2031 | 13.35 مليار دولار أمريكي |
| معدل النمو السنوي المركب العالمي (2023 - 2031) | 9.32% |
| البيانات التاريخية | 2021-2022 |
| فترة التنبؤ | 2024-2031 |
| القطاعات المغطاة |
حسب المنتج والخدمات
|
| المناطق والدول المغطاة |
أمريكا الشمالية
|
| قادة السوق وملفات تعريف الشركات الرئيسية |
|
كثافة اللاعبين في سوق تسلسل الحمض النووي الريبي المستند إلى NGS: فهم تأثيره على ديناميكيات الأعمال
يشهد سوق تسلسل الحمض النووي الريبي المستند إلى NGS نموًا سريعًا، مدفوعًا بالطلب المتزايد من المستخدم النهائي بسبب عوامل مثل تفضيلات المستهلك المتطورة والتقدم التكنولوجي والوعي الأكبر بفوائد المنتج. ومع ارتفاع الطلب، تعمل الشركات على توسيع عروضها والابتكار لتلبية احتياجات المستهلكين والاستفادة من الاتجاهات الناشئة، مما يؤدي إلى زيادة نمو السوق.
تشير كثافة اللاعبين في السوق إلى توزيع الشركات أو المؤسسات العاملة في سوق أو صناعة معينة. وهي تشير إلى عدد المنافسين (اللاعبين في السوق) الموجودين في مساحة سوق معينة نسبة إلى حجمها أو قيمتها السوقية الإجمالية.
الشركات الرئيسية العاملة في سوق RNA Seq القائم على NGS هي:
- شركة إيلومينا
- شركة بيركين إلمر
- شركة ف. هوفمان-لاروش المحدودة
- شركة كياجن
- شركة اجيلنت للتكنولوجيا
- شركة ثيرمو فيشر العلمية
إخلاء المسؤولية : الشركات المذكورة أعلاه ليست مرتبة بأي ترتيب معين.

- احصل على نظرة عامة على أهم اللاعبين الرئيسيين في سوق RNA Seq القائم على NGS
أخبار وتطورات سوق RNA Seq المستندة إلى NGS
يتم تقييم سوق تسلسل الحمض النووي الريبي المستند إلى NGS من خلال جمع البيانات النوعية والكمية من البحوث الأولية والثانوية، والتي تتضمن المنشورات المؤسسية الأساسية وبيانات الجمعيات وقواعد البيانات. فيما يلي بعض التطورات في سوق تسلسل الحمض النووي الريبي المستند إلى NGS:
- أطلقت شركة Twist Bioscience مجموعة من أدوات تسلسل الحمض النووي الريبي. تتضمن المجموعة Exome من Twist RNA، ومجموعة Twist RNA Library Prep Kit، ومجموعة Twist Ribosomal RNA (rRNA) وHemoglobin (Globin) Depletion Kit، بالإضافة إلى إمكانيات إثراء الهدف المخصص لتسلسل الحمض النووي الريبي والنسخ الكامل. تعتمد مجموعة تسلسل الحمض النووي الريبي من Twist على قدراتها الراسخة في تسلسل الجيل التالي من الجينوم واكتشاف الميثيل. كما تتوسع في تحليل التعبير الجيني، مما يفتح سوقًا جديدًا ومهمًا للشركة. (المصدر: Twist Bioscience، بيان صحفي، 2023)
- أطلقت شركة Illumina Inc. إصدارها DRAGEN v4.0، وهو عبارة عن منصة تحليل ثانوية دقيقة وشاملة. يتيح المنتج تحديد ملف تعريف دقة الخلية الفردية لإمكانية الوصول إلى الكروماتين. ويمكن تشغيله باستخدام خط أنابيب DRAGEN RNA-seq للخلية الفردية كجزء من خط أنابيب multiomics للخلية الفردية. (المصدر: Illumina Inc، بيان صحفي، 2022)
تغطية تقرير سوق RNA Seq القائم على NGS والمنتجات النهائية
يوفر تقرير "حجم سوق تسلسل الحمض النووي الريبي المستند إلى NGS والتوقعات (2021-2031)" تحليلاً مفصلاً للسوق يغطي المجالات التالية:
- حجم سوق تسلسل الحمض النووي الريبي المستند إلى NGS والتوقعات على المستويات العالمية والإقليمية والوطنية لجميع قطاعات السوق الرئيسية التي يغطيها النطاق
- اتجاهات سوق تسلسل الحمض النووي الريبي المستند إلى NGS، بالإضافة إلى ديناميكيات السوق مثل المحركات والقيود والفرص الرئيسية
- تحليل مفصل لقوى PEST/Porter الخمس وSWOT
- تحليل سوق RNA seq القائم على NGS والذي يغطي اتجاهات السوق الرئيسية والإطار العالمي والإقليمي واللاعبين الرئيسيين واللوائح والتطورات الأخيرة في السوق
- تحليل المشهد الصناعي والمنافسة الذي يغطي تركيز السوق، وتحليل خريطة الحرارة، واللاعبين البارزين، والتطورات الأخيرة في سوق تسلسل الحمض النووي الريبي القائم على NGS
- ملفات تعريف الشركة التفصيلية
- التحليل التاريخي (سنتان)، سنة الأساس، التوقعات (7 سنوات) مع معدل النمو السنوي المركب
- تحليل PEST و SWOT
- حجم السوق والقيمة / الحجم - عالمي، إقليمي، بلد
- الصناعة والمنافسة
- مجموعة بيانات إكسل
التقارير الحديثة
شهادات العملاء
سبب الشراء
- اتخاذ قرارات مدروسة
- فهم ديناميكيات السوق
- تحليل المنافسة
- رؤى العملاء
- توقعات السوق
- تخفيف المخاطر
- التخطيط الاستراتيجي
- مبررات الاستثمار
- تحديد الأسواق الناشئة
- تحسين استراتيجيات التسويق
- تعزيز الكفاءة التشغيلية
- مواكبة التوجهات التنظيمية


 احصل على عينة مجانية ل - سوق تسلسل الحمض النووي الريبي المستند إلى NGS