تحليل وتوقعات سوق مقياس جرعات الضوضاء حسب الحجم والمشاركة والنمو والاتجاهات 2031
البيانات التاريخية : 2021-2022 | سنة الأساس : 2023 | فترة التنبؤ : 2024-2031حجم سوق مقياس جرعات الضوضاء وتوقعاته (2021-2031)، والحصة العالمية والإقليمية، والاتجاه، وتغطية تقرير تحليل فرص النمو: حسب النوع (البرمجيات والأجهزة)، ووضع الجهاز (مقياس جرعات الضوضاء على الجسم، ومقياس جرعات الضوضاء في المجال الحر، ومقياس جرعات الضوضاء في/بالقرب من الأذن)، والتطبيق (الفضاء والدفاع، والسيارات، والبناء، والمصانع والمؤسسات) والجغرافيا.
- تاريخ التقرير : Mar 2026
- رمز التقرير : TIPEL100001356
- الفئة : الإلكترونيات وأشباه الموصلات
- الحالة : البيانات الصادرة
- تنسيقات التقارير المتاحة :


- عدد الصفحات : 150
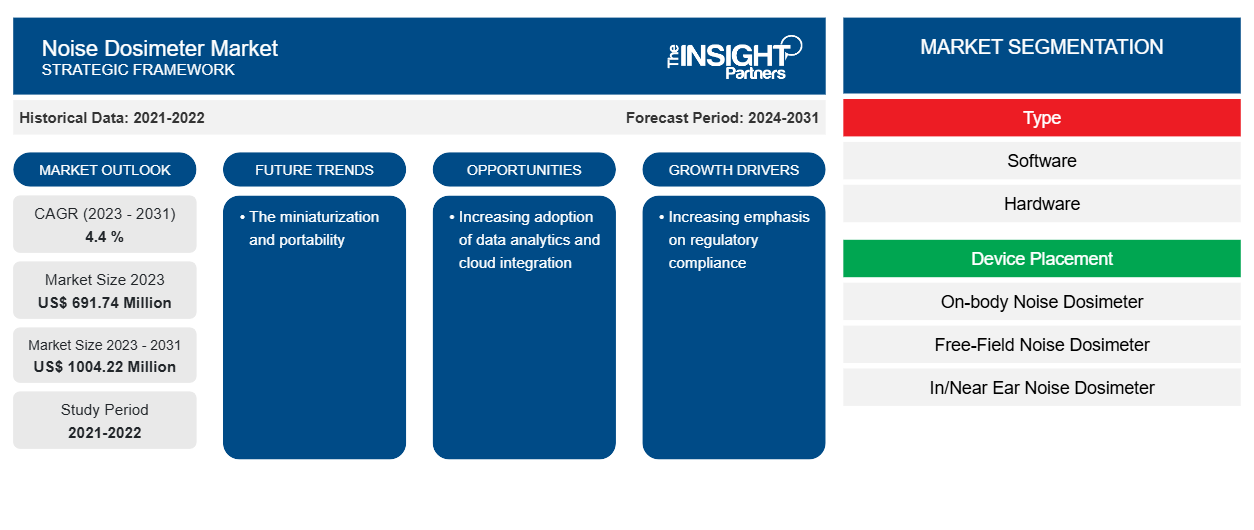
من المتوقع أن يصل حجم سوق مقياس الجرعات الضوضائية إلى 1004.22 مليون دولار أمريكي بحلول عام 2031 من 691.74 مليون دولار أمريكي في عام 2023. ومن المتوقع أن يسجل السوق معدل نمو سنوي مركب بنسبة 4.4٪ خلال الفترة 2023-2031. ومن المرجح أن يظل التصغير والقدرة على النقل اتجاهًا رئيسيًا في السوق.
تحليل سوق أجهزة قياس جرعات الضوضاء
إن الطلب على السوق يعزى إلى الاستخدام المتزايد لأجهزة قياس الضوضاء الشخصية. فبالنسبة لمهنيي الصحة والسلامة وخبراء النظافة الصناعية اليوم، تعد تدابير الضوضاء في مكان العمل ضرورية. ولا تزال العديد من مرافق التصنيع في العالم الصناعي تعاني من مستويات عالية من الضوضاء. وتفضل مناطق مختلفة استخدام جهاز شخصي للتحقق من جرعة الضوضاء التي يتعرض لها العامل. وفي الوقت نفسه، تستخدم دول أخرى مزيجًا من أجهزة قياس مستوى الضوضاء المحمولة وعدد أقل من أجهزة قياس الضوضاء الشخصية. وبالنسبة للشخص المشغول الذي قد يواجه العديد من المخاطر الإضافية في المكتب، فإن مزايا جهاز قياس الضوضاء الشخصي تتمثل في العديد من الأنظمة التي يتم استخدامها حاليًا مع أنظمة جديدة.
نظرة عامة على سوق أجهزة قياس جرعات الضوضاء
لا توجد طريقة واحدة لقياس الضوضاء المهنية. يمكن لمهنيي السلامة والصحة السمعية استخدام أدوات مختلفة لقياس الضوضاء ويمكنهم الاختيار من بين العديد من الأدوات والبرامج لفحص قياساتهم. يعتمد اختيار أداة ونهج محددين لتحليل وقياس الضوضاء المهنية على عوامل مختلفة، ليس أقلها سبب القياس والبيئة التي سيتم فيها إجراء القياس. تكون عملية قياس الضوضاء باستخدام مقياس مستوى الصوت مباشرة نسبيًا عندما تكون مستويات الضوضاء ثابتة وعندما يظل العامل ثابتًا بشكل أساسي أثناء نوبة العمل. يوصى باستخدام مقياس جرعة الضوضاء لقياس تعرض العامل للضوضاء عندما تكون مستويات الضوضاء متفاوتة أو متقطعة.
قم بتخصيص هذا التقرير ليناسب متطلباتك
ستحصل على تخصيص لأي تقرير - مجانًا - بما في ذلك أجزاء من هذا التقرير، أو تحليل على مستوى الدولة، وحزمة بيانات Excel، بالإضافة إلى الاستفادة من العروض والخصومات الرائعة للشركات الناشئة والجامعات
سوق أجهزة قياس جرعات الضوضاء: رؤى استراتيجية
-
احصل على أهم اتجاهات السوق الرئيسية لهذا التقرير.ستتضمن هذه العينة المجانية تحليلاً للبيانات، بدءًا من اتجاهات السوق وحتى التقديرات والتوقعات.
محركات وفرص سوق أجهزة قياس جرعات الضوضاء
زيادة التركيز على الامتثال التنظيمي
يسمح مقياس جرعات الضوضاء متعدد القنوات بقياس جميع المعلمات المطلوبة لتقييم تعرض العمال للضوضاء في وقت واحد واختيار حماية السمع باستخدام نطاقات SNR أو HML أو Octave. يمكن تكوين كل قناة بشكل فردي لتلبية أي معيار أو لائحة أو إرشادات لقياس الضوضاء. يتيح هذا لمقياس الجرعات قياس مجموعة واسعة من البيانات وتوفير المعلومات المطلوبة لتلبية أي معايير ضوضاء مهنية. وبالتالي، مع التركيز المتزايد على الامتثال التنظيمي، يتزايد الطلب على مقاييس جرعات الضوضاء.
زيادة اعتماد تحليلات البيانات والتكامل السحابي
من المرجح أن تؤدي الثورة الكبيرة القادمة في مجال قياس الضوضاء إلى تغيير طريقة قياس الضوضاء ومراقبتها. ويشكل دمج تكنولوجيا الحوسبة السحابية في قياس الضوضاء لحظة فاصلة في هذه الصناعة التي تعد بتطوير الطريقة التي تحمي بها المؤسسات في مختلف أنحاء العالم موظفيها والبيئة من مخاطر التعرض للضوضاء الشديدة. ويمكن تركيب أجهزة مراقبة الضوضاء المتصلة بالسحابة في مواقع مختلفة في موقع واحد أو عبر العديد من المواقع، بحيث تغطي أكبر مساحة جغرافية ممكنة. وتتغلب تكنولوجيا الحوسبة السحابية على التحديات التي تواجهها العمليات متعددة المواقع وتعد بجعل مراقبة الضوضاء أكثر كفاءة وسهولة من الطرق التقليدية. وبالتالي، فإن التبني المتزايد لتحليلات البيانات والتكامل السحابي يخلق المزيد من الفرص للسوق.
تقرير تحليل تجزئة سوق أجهزة قياس جرعات الضوضاء
إن القطاعات الرئيسية التي ساهمت في اشتقاق تحليل سوق مقياس جرعات الضوضاء هي النوع وموضع الجهاز والتطبيق.
- وفقًا للنوع، ينقسم سوق مقياس الجرعات الضوضائية إلى أجهزة وبرامج. احتل قطاع البرامج حصة سوقية أكبر في عام 2023.
- من خلال وضع الجهاز، يتم تقسيم السوق إلى أجهزة قياس جرعات الضوضاء على الجسم، وأجهزة قياس جرعات الضوضاء في المجال الحر، وأجهزة قياس جرعات الضوضاء داخل الأذن أو بالقرب منها.
- حسب التطبيق، يتم تقسيم السوق إلى الفضاء والدفاع، والسيارات، والبناء، والمصانع والمؤسسات.
تحليل حصة سوق أجهزة قياس جرعات الضوضاء حسب المنطقة الجغرافية
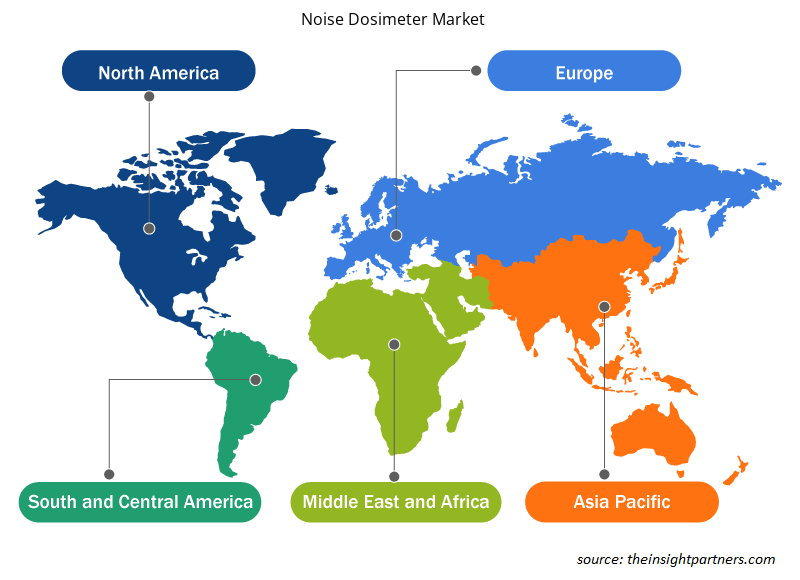
ينقسم النطاق الجغرافي لتقرير سوق مقياس الجرعات الضوضائية بشكل أساسي إلى خمس مناطق: أمريكا الشمالية، ومنطقة آسيا والمحيط الهادئ، وأوروبا، والشرق الأوسط وأفريقيا، وأمريكا الجنوبية والوسطى.
تهيمن منطقة آسيا والمحيط الهادئ على سوق أجهزة قياس جرعات الضوضاء. ويختلف تقدير الضوضاء الصناعية بشكل كبير عن تقدير ضوضاء النقل. وعلى النقيض من ضوضاء النقل، التي يمكن التنبؤ بها باستخدام مجموعة من مجموعات البيانات المدخلة، لا توجد طرق مماثلة للضوضاء الصناعية. والطريقة الوحيدة لتحديد مقدار ما ينبعث من مصدر صناعي هي تحديده. ويؤدي ارتفاع انبعاثات الضوضاء الصناعية والحاجة الملحة للسيطرة عليها إلى اعتماد أجهزة قياس جرعات الضوضاء بين العديد من الصناعات في منطقة آسيا والمحيط الهادئ.
رؤى إقليمية حول سوق أجهزة قياس جرعات الضوضاء
لقد قام المحللون في Insight Partners بشرح الاتجاهات والعوامل الإقليمية المؤثرة على سوق أجهزة قياس جرعات الضوضاء طوال فترة التوقعات بشكل شامل. يناقش هذا القسم أيضًا قطاعات سوق أجهزة قياس جرعات الضوضاء والجغرافيا في جميع أنحاء أمريكا الشمالية وأوروبا ومنطقة آسيا والمحيط الهادئ والشرق الأوسط وأفريقيا وأمريكا الجنوبية والوسطى.
- احصل على البيانات الإقليمية المحددة لسوق مقياس الجرعات الضوضائية
نطاق تقرير سوق أجهزة قياس جرعات الضوضاء
| سمة التقرير | تفاصيل |
|---|---|
| حجم السوق في عام 2023 | 691.74 مليون دولار أمريكي |
| حجم السوق بحلول عام 2031 | 1004.22 مليون دولار أمريكي |
| معدل النمو السنوي المركب العالمي (2023 - 2031) | 4.4% |
| البيانات التاريخية | 2021-2022 |
| فترة التنبؤ | 2024-2031 |
| القطاعات المغطاة |
حسب النوع
|
| المناطق والدول المغطاة |
أمريكا الشمالية
|
| قادة السوق وملفات تعريف الشركات الرئيسية |
|
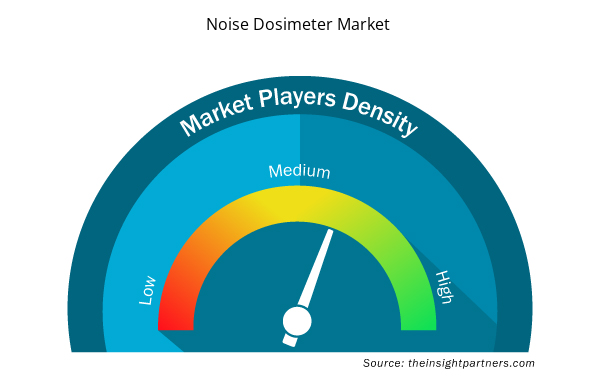
كثافة اللاعبين في سوق أجهزة قياس جرعات الضوضاء: فهم تأثيرها على ديناميكيات الأعمال
يشهد سوق أجهزة قياس جرعات الضوضاء نموًا سريعًا، مدفوعًا بالطلب المتزايد من جانب المستخدم النهائي بسبب عوامل مثل تفضيلات المستهلكين المتطورة والتقدم التكنولوجي والوعي المتزايد بفوائد المنتج. ومع ارتفاع الطلب، تعمل الشركات على توسيع عروضها والابتكار لتلبية احتياجات المستهلكين والاستفادة من الاتجاهات الناشئة، مما يؤدي إلى زيادة نمو السوق.
تشير كثافة اللاعبين في السوق إلى توزيع الشركات أو المؤسسات العاملة في سوق أو صناعة معينة. وهي تشير إلى عدد المنافسين (اللاعبين في السوق) الموجودين في مساحة سوق معينة نسبة إلى حجمها أو قيمتها السوقية الإجمالية.
الشركات الرئيسية العاملة في سوق مقياس جرعات الضوضاء هي:
- برويل وكايير
- كاسيلا (الصناعات المثالية، المحدودة)
- شركة سيسفا للأدوات المحدودة
- 3م
- سفانتيك
- شركة سيروس للأبحاث
إخلاء المسؤولية : الشركات المذكورة أعلاه ليست مرتبة بأي ترتيب معين.
- احصل على نظرة عامة على أهم اللاعبين الرئيسيين في سوق أجهزة قياس جرعات الضوضاء
أخبار سوق أجهزة قياس جرعات الضوضاء والتطورات الأخيرة
يتم تقييم سوق مقياس الجرعات الضوضائية من خلال جمع البيانات النوعية والكمية بعد البحث الأولي والثانوي، والتي تتضمن منشورات الشركات المهمة وبيانات الجمعيات وقواعد البيانات. فيما يلي بعض التطورات في سوق مقياس الجرعات الضوضائية:
- قدمت شركة TSI أحدث ما توصلت إليه تكنولوجيا قياس جرعات الضوضاء بإطلاق جهاز قياس جرعات الضوضاء الشخصي Quest™ Edge 7 الجديد كليًا. في بيئات العمل الصاخبة، يعد حماية سمع العمال أمرًا بالغ الأهمية للحفاظ على سلامتهم وصحتهم. يعد جهاز قياس جرعات الضوضاء الشخصي Quest™ Edge من TSI® جهازًا قويًا وبديهيًا مصممًا لتحديد تهديدات فقدان السمع وإبلاغ تصميم برامج حماية السمع وضوابط الهندسة. (المصدر: TSI، بيان صحفي، يوليو 2023.)
- تقديم جهاز قياس جرعات الضوضاء الشخصي الجديد SKC NoiseCHEK يمكن أن يؤدي التعرض المفرط لمستويات عالية من الضوضاء في مكان العمل إلى فقدان السمع ومشاكل صحية أخرى لدى العمال، وبالتالي يتم تنظيمه وفقًا لمعايير التعرض للضوضاء التي وضعتها Safe Work Australia. يعد استخدام معدات السلامة المناسبة لضمان عدم تجاوز التعرض للضوضاء متوسط 85 ديسيبل لمدة 8 ساعات أو ذروة 140 ديسيبل أمرًا حيويًا للحفاظ على سلامة فريقك. (المصدر: SKC NoiseCHEK، بيان صحفي، سبتمبر 2023)
تقرير سوق أجهزة قياس جرعات الضوضاء والتغطية والنتائج
يقدم تقرير "حجم سوق مقياس الجرعات الضوضائية والتوقعات (2021-2031)" تحليلاً مفصلاً للسوق يغطي المجالات التالية:
- حجم سوق مقياس جرعات الضوضاء وتوقعاته على المستويات العالمية والإقليمية والوطنية لجميع قطاعات السوق الرئيسية التي يغطيها النطاق
- اتجاهات سوق أجهزة قياس جرعات الضوضاء، بالإضافة إلى ديناميكيات السوق مثل العوامل المحركة، والقيود، والفرص الرئيسية
- تحليل مفصل لقوى PEST/Porter الخمس وSWOT
- تحليل سوق مقياس الجرعات الضوضائية يغطي اتجاهات السوق الرئيسية والإطار العالمي والإقليمي واللاعبين الرئيسيين واللوائح والتطورات الأخيرة في السوق
- تحليل المشهد الصناعي والمنافسة الذي يغطي تركيز السوق، وتحليل خريطة الحرارة، واللاعبين البارزين، والتطورات الأخيرة في سوق مقياس جرعات الضوضاء
- ملفات تعريف الشركة التفصيلية

نافين خبيرٌ متمرسٌ في أبحاث السوق والاستشارات، يتمتع بخبرةٍ تزيد عن 9 سنوات في مشاريع مُخصصة ومُشتركة واستشارية. يشغل حاليًا منصب نائب الرئيس المساعد، وقد نجح في إدارة أصحاب المصلحة عبر سلسلة قيمة المشاريع، وألّف أكثر من 100 تقرير بحثي وأكثر من 30 مهمة استشارية. يمتد نطاق عمله ليشمل مشاريع صناعية وحكومية، مساهمًا بشكل كبير في نجاح العملاء واتخاذ القرارات القائمة على البيانات.
نافين حاصلٌ على شهادة في هندسة الإلكترونيات والاتصالات من جامعة فرجينيا التقنية، كارناتاكا، وشهادة ماجستير في إدارة الأعمال في التسويق والعمليات من جامعة مانيبال. وهو عضوٌ نشطٌ في معهد مهندسي الكهرباء والإلكترونيات (IEEE) لمدة 9 سنوات، حيث شارك في مؤتمراتٍ وندواتٍ تقنية، وتطوّع على مستوى الأقسام والمناطق. قبل منصبه الحالي، عمل مستشارًا استراتيجيًا مساعدًا في IndustryARC، ومستشارًا للخوادم الصناعية في شركة هيوليت باكارد (HP Global).
- التحليل التاريخي (سنتان)، سنة الأساس، التوقعات (7 سنوات) مع معدل النمو السنوي المركب
- تحليل PEST و SWOT
- حجم السوق والقيمة / الحجم - عالمي، إقليمي، بلد
- الصناعة والمنافسة
- مجموعة بيانات إكسل
التقارير الحديثة
شهادات العملاء
تقرير سوق أنظمة SCADA من Insight Partners شامل، ويقدم رؤى قيّمة حول الاتجاهات الحالية والتوقعات المستقبلية. تميّز الفريق باحترافية عالية وسرعة في الاستجابة ودعم مستمر طوال الوقت. نحن راضون جدًا ونوصي بشدة بخدماتهم.
ران كيديم شريك, شركة ريالي تكنولوجيز المحدودةطلبتُ تقريرًا عن سوق برمجيات محدد، وأعدّه الفريق في غضون أيام قليلة. كانت المعلومات ذات صلة وثيقة وعرضها جيد. ثم طلبتُ بعض التعديلات والإضافات على التقرير. وكان الفريق متجاوبًا للغاية، وحصلتُ على التقرير النهائي في أقل من أسبوع.
جان هيرفيه جين رئيس مجلس الإدارة, فيوتشر أناليتيكاعملنا مع شركة "إنسايت بارتنرز" لإجراء دراسة سوقية وتوقعات مهمة. زودونا برؤى واضحة حول الفرص والمخاطر، مما ساعدنا في صياغة خططنا. كانت أبحاثهم سهلة الاستخدام ومبنية على بيانات دقيقة، مما ساعدنا على اتخاذ قرارات ذكية وواثقة. نوصي بهم بشدة.
بيوش ناجبال نائب الرئيس الأول, شعاع عالي عالميقدّمت شركة Insight Partners أبحاثًا سوقية ثاقبة ومنظمة جيدًا بخبرة واسعة في هذا المجال. تميّز فريقهم بالاحترافية وسرعة الاستجابة طوال الوقت. وسهّل موقعهم الإلكتروني سهل الاستخدام الوصول إلى تقارير القطاع. نوصي بهم بشدة لخدمات بحثية موثوقة وعالية الجودة.
يوكيهيكو أداتشي المدير التنفيذي, ديب بلو، ذ.م.م.هذه أول مرة أشتري فيها تقرير سوق من The Insight Partners. رغم أنني كنت مترددًا في البداية، إلا أنني زرت موقعهم الإلكتروني وشعرت براحة أكبر للمخاطرة وشراء تقرير السوق. أنا راضٍ تمامًا عن جودة التقرير وخدمة العملاء. كانت لديّ عدة أسئلة وتعليقات حول التقرير الأولي، ولكن بعد بضع محادثات عبر البريد الإلكتروني مع محللهم، أعتقد أن لديّ تقريرًا يمكنني استخدامه كمدخل لعملية التخطيط الاستراتيجي لدينا. شكرًا جزيلاً لكم على تخصيص وقتكم الإضافي وجعل هذه التجربة إيجابية. سأوصي بخدماتكم للآخرين بالتأكيد، وستكونون أول من ألجأ إليه عندما نحتاج إلى المزيد من بيانات السوق.
جون سوزوكي الرئيس والرئيس التنفيذي وعضو مجلس الإدارة, بي كيه تكنولوجيزأود أن أقدّر دعمكم واحترافيتكم في الاستجابة لطلبي للحصول على معلومات بشأن سوق التشخيص المخبري للأمراض المعدية في نيجيريا. كما أُقدّر صبركم وتوجيهكم، واستعدادكم لتقديم خصم، مما مكّننا في النهاية من إتمام الصفقة. أتطلع إلى التعامل مع "ذا إنسايت بارتنرز" مستقبلًا، كل ذلك بفضل الانطباع الذي تركتموه لديّ نتيجةً لهذا اللقاء الأول.
الدكتور تشيجيوك أونيا المدير الإداري, شركة باينكريست للرعاية الصحية المحدودةسبب الشراء
- اتخاذ قرارات مدروسة
- فهم ديناميكيات السوق
- تحليل المنافسة
- رؤى العملاء
- توقعات السوق
- تخفيف المخاطر
- التخطيط الاستراتيجي
- مبررات الاستثمار
- تحديد الأسواق الناشئة
- تحسين استراتيجيات التسويق
- تعزيز الكفاءة التشغيلية
- مواكبة التوجهات التنظيمية


 احصل على عينة مجانية ل - سوق أجهزة قياس جرعات الضوضاء