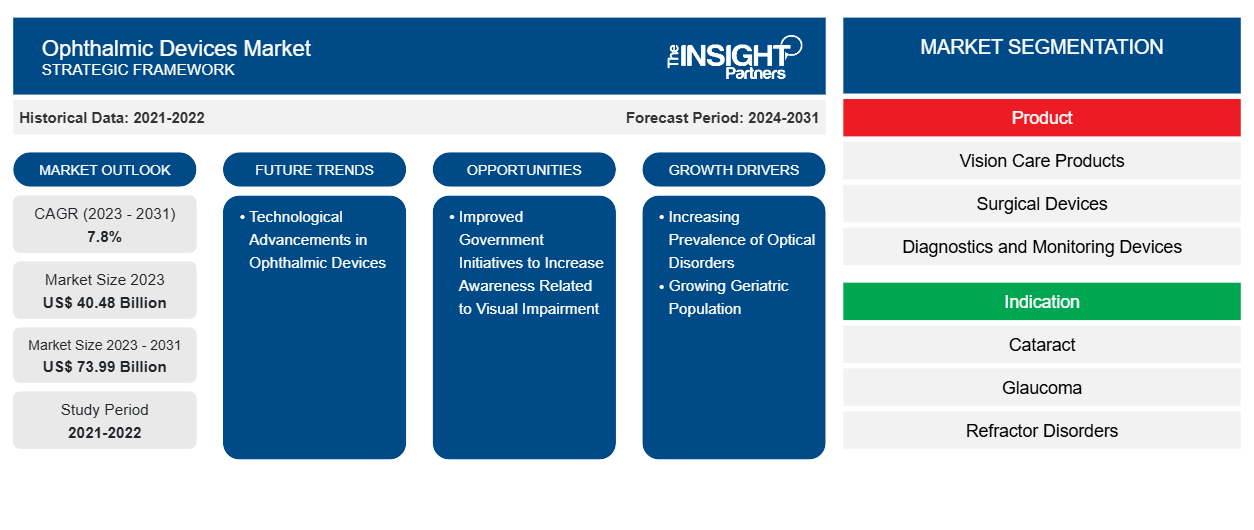
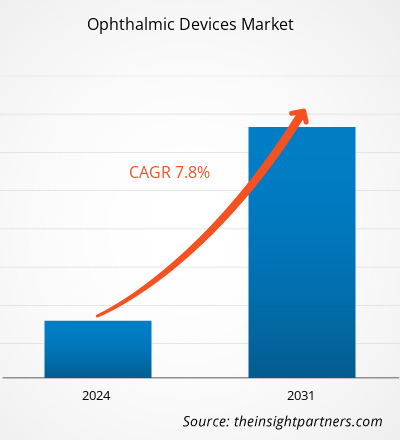
من المتوقع أن يصل حجم سوق الأجهزة الطبية للعيون إلى 73.99 مليار دولار أمريكي بحلول عام 2031 من 40.48 مليار دولار أمريكي في عام 2023؛ ومن المتوقع أن يسجل السوق معدل نمو سنوي مركب بنسبة 7.8٪ خلال الفترة 2023-2031.
الأجهزة العينية هي معدات طبية تستخدم لتصحيح الرؤية والتشخيص والأغراض الجراحية. وقد زاد الوعي بالأجهزة العينية وتبنيها في السنوات الأخيرة بسبب زيادة حالات الجلوكوما وإعتام عدسة العين وأمراض أخرى مرتبطة بالرؤية. ومن المتوقع أن يعزز ارتفاع عدد كبار السن وانتشار الاضطرابات البصرية سوق الأجهزة العينية في السنوات القادمة. وتشمل اتجاهات سوق الأجهزة العينية التطورات التكنولوجية في الأجهزة العينية التي من شأنها أن تعزز نمو السوق في المستقبل.
محركات النمو:
إن الزيادة المفاجئة في عدد السكان المسنين في البلدان المتقدمة مثل الولايات المتحدة والمملكة المتحدة وكندا واليابان، والبلدان النامية مثل الصين والهند وكوريا الجنوبية مدفوعة بتحديث مرافق الرعاية الصحية وتحسينات الخدمات الصحية، مما أدى إلى تحسين متوسط العمر المتوقع في هذه البلدان. إن الشيخوخة السكانية لها تأثير كبير على الجبهتين الاجتماعية والاقتصادية في العالم. يتم اعتماد تقنيات جديدة في مختلف البلدان في جميع أنحاء العالم لعلاج كبار السن بأمان وفعالية. وبالتالي، أدى ارتفاع جودة الحياة إلى انخفاض معدلات الوفيات، مما تسبب بدوره في زيادة كبيرة في عدد السكان المسنين. وفقًا لبيانات منظمة الصحة العالمية لعام 2022، سيكون 1 من كل 6 أشخاص يبلغ من العمر 60 عامًا أو أكثر بحلول عام 2030؛ من المتوقع أن ينمو عدد السكان الذين تبلغ أعمارهم 60 عامًا فأكثر من 900 مليون في عام 2021 إلى 2 مليار بحلول عام 2050. وستتضاعف نسبة سكان العالم في هذه الفئة العمرية من 12٪ في عام 2015 إلى 22٪ بحلول عام 2050. ووفقًا لإدارة الشؤون الاقتصادية والاجتماعية وتقرير الأمم المتحدة لعام 2019، فإن حوالي 703 مليون فرد تبلغ أعمارهم 65 عامًا فأكثر، ومن المتوقع أن يتضاعف العدد إلى 1.5 مليار بحلول عام 2050.
يعد الجلوكوما أحد الأسباب الرئيسية للعمى بين الأشخاص الذين تبلغ أعمارهم 60 عامًا أو أكثر، ويكون الأشخاص أكثر عرضة للإصابة بالجلوكوما بست مرات بعد بلوغهم سن الستين. وفقًا لورقة حقائق أبحاث الجلوكوما الوطنية لعام 2022، يعاني أكثر من 3 ملايين أمريكي من الجلوكوما، ومن بينهم 2.7 مليون شخص يعيشون مع هذه الحالة تبلغ أعمارهم 40 عامًا أو أكثر. تشمل الأسباب الأخرى للعمى اعتلال الشبكية السكري، والتنكس البقعي المرتبط بالعمر، وانفصال الشبكية. تنص مراكز السيطرة على الأمراض والوقاية منها على أن معدل انتشار اعتلال الشبكية السكري كان أدنى بين الأشخاص الذين تقل أعمارهم عن 25 عامًا (13.0٪) وأعلى بين الأشخاص من الفئة العمرية 65-79 (28.4٪) في الولايات المتحدة في عام 2021. كما يتم الاستشهاد بأمراض العيون المرتبطة بالعمر باعتبارها الأسباب الرئيسية للعمى وضعف البصر في الولايات المتحدة. وبالتالي، يصبح كبار السن أكثر عرضة للإصابة بمختلف أمراض العيون التي تتطلب التشخيص والعلاج المبكر، الأمر الذي يؤدي بدوره إلى زيادة الطلب على الأجهزة الطبية للعيون، مما يساهم في نمو سوق الأجهزة الطبية للعيون.
قم بتخصيص هذا التقرير ليناسب متطلباتك
ستحصل على تخصيص لأي تقرير - مجانًا - بما في ذلك أجزاء من هذا التقرير، أو تحليل على مستوى الدولة، وحزمة بيانات Excel، بالإضافة إلى الاستفادة من العروض والخصومات الرائعة للشركات الناشئة والجامعات
- احصل على أهم اتجاهات السوق الرئيسية لهذا التقرير.ستتضمن هذه العينة المجانية تحليلاً للبيانات، بدءًا من اتجاهات السوق وحتى التقديرات والتوقعات.
تقسيم التقرير ونطاقه:
تم إجراء تحليل سوق الأجهزة العينية من خلال النظر في القطاعات التالية: المنتج والمؤشر والمستخدم النهائي والجغرافيا. بناءً على المنتج، يتم تقسيم السوق إلى منتجات العناية بالرؤية والأجهزة الجراحية وأجهزة التشخيص والمراقبة. من حيث المؤشر، يتم تصنيف السوق إلى إعتام عدسة العين والجلوكوما واضطرابات الانكسار وغيرها من المؤشرات. بناءً على المستخدم النهائي، يتم تصنيف السوق إلى مستشفيات وعيادات عيون ومختبرات أكاديمية وبحثية ومستخدمين نهائيين آخرين. يغطي نطاق تقرير سوق الأجهزة العينية أمريكا الشمالية (الولايات المتحدة وكندا والمكسيك) وأوروبا (فرنسا وألمانيا والمملكة المتحدة وإسبانيا وإيطاليا وبقية أوروبا) وآسيا والمحيط الهادئ (الصين واليابان والهند وكوريا الجنوبية وأستراليا وبقية آسيا والمحيط الهادئ) والشرق الأوسط وأفريقيا (المملكة العربية السعودية وجنوب إفريقيا والإمارات العربية المتحدة وبقية الشرق الأوسط وأفريقيا) وأمريكا الجنوبية والوسطى (البرازيل والأرجنتين وبقية أمريكا الجنوبية والوسطى).
التحليل القطاعي:
يتم تصنيف سوق الأجهزة الطبية للعيون، حسب المنتج، إلى منتجات العناية بالبصر، والأجهزة الجراحية، وأجهزة التشخيص والمراقبة. احتل قطاع منتجات العناية بالبصر حصة سوقية كبيرة في عام 2023. ومن المتوقع أن يسجل أعلى معدل نمو سنوي مركب في السوق خلال الفترة 2023-2031.
بناءً على المؤشرات، يتم تصنيف السوق إلى إعتام عدسة العين، والزرق، واضطرابات الانكسار، ومؤشرات أخرى. احتل قطاع الجلوكوما حصة كبيرة في سوق الأجهزة العينية في عام 2023 ومن المتوقع أن يسجل أعلى معدل نمو سنوي مركب خلال الفترة 2023-2031.
بناءً على المستخدم النهائي، يتم تقسيم السوق إلى المستشفيات وعيادات العيون والمختبرات الأكاديمية والبحثية والمستخدمين النهائيين الآخرين. احتل قطاع المستشفيات وعيادات العيون حصة كبيرة في سوق الأجهزة الطبية للعيون في عام 2023 ومن المتوقع أن يسجل أعلى معدل نمو سنوي مركب خلال الفترة 2023-2031.
التحليل الإقليمي:
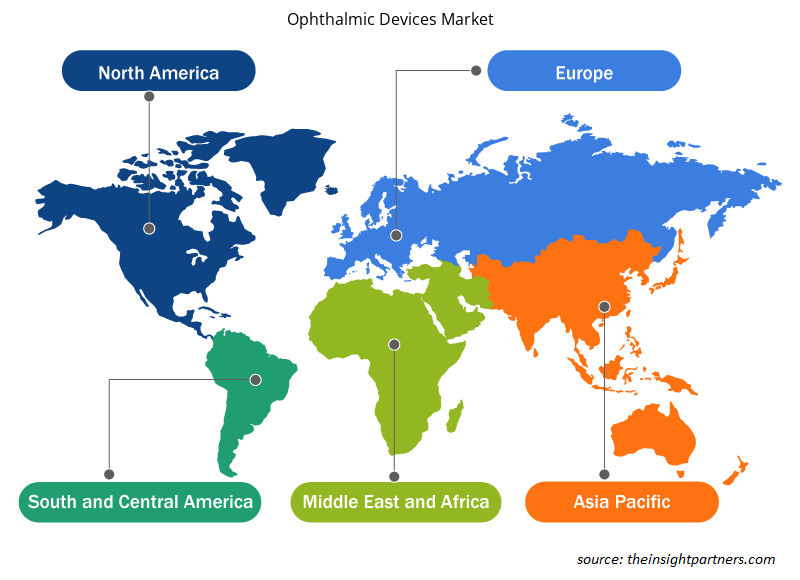
من حيث الجغرافيا، يتم تقسيم سوق الأجهزة الطبية للعيون إلى أمريكا الشمالية وأوروبا وآسيا والمحيط الهادئ وأمريكا الجنوبية والوسطى والشرق الأوسط وأفريقيا. في عام 2023، استحوذت أمريكا الشمالية على حصة كبيرة من السوق. في عام 2023، هيمنت الولايات المتحدة على سوق الأجهزة الطبية للعيون في هذه المنطقة. يُعزى نمو السوق في أمريكا الشمالية إلى العبء المتزايد لأمراض العيون، مثل إعتام عدسة العين، والزرق، واعتلال الشبكية السكري، والتنكس البقعي المرتبط بالعمر (AMD)، وأمراض الانكسار؛ وزيادة عدد السكان المسنين؛ والقبول المتزايد للأجهزة الطبية للعيون المتقدمة تقنيًا؛ ووجود لاعبين مهمين في السوق في المنطقة. مع ارتفاع عدد السكان الذين تبلغ أعمارهم 65 عامًا أو أكثر، فإن حالات الأمراض المرتبطة بالعمر مثل التنكس البقعي المرتبط بالعمر آخذة في الارتفاع في الولايات المتحدة. وفقًا لتقرير المعاهد الوطنية للصحة، ارتفع عدد الأشخاص المصابين بالضمور البقعي المرتبط بالعمر بنسبة 18% من عام 2000 إلى عام 2010، ليصل إلى 2.07 مليون بحلول عام 2010 من 1.75 مليون في عام 2000. ومن المتوقع أن يصل العدد بحلول عام 2050 إلى 5.44 مليون من 2.07 مليون. ووفقًا لدراسة "انتشار اعتلال الشبكية السكري في الولايات المتحدة في عام 2021"، التي نُشرت في عام 2023، كان يعيش حوالي 9.6 مليون شخص مع اعتلال الشبكية السكري، وكان يعيش حوالي 1.8 مليون شخص مع اعتلال الشبكية السكري الذي يهدد الرؤية في عام 2021 في الولايات المتحدة. وهذا يؤدي إلى زيادة الطلب على أدوات طب العيون التشخيصية، وبالتالي دفع نمو سوق أجهزة طب العيون في المنطقة.
رؤى إقليمية حول سوق الأجهزة الطبية للعيون
لقد قام المحللون في Insight Partners بشرح الاتجاهات والعوامل الإقليمية المؤثرة على سوق الأجهزة العينية طوال فترة التوقعات بشكل شامل. يناقش هذا القسم أيضًا قطاعات سوق الأجهزة العينية والجغرافيا في جميع أنحاء أمريكا الشمالية وأوروبا ومنطقة آسيا والمحيط الهادئ والشرق الأوسط وأفريقيا وأمريكا الجنوبية والوسطى.

- احصل على البيانات الإقليمية المحددة لسوق الأجهزة الطبية للعيون
نطاق تقرير سوق الأجهزة الطبية للعيون
| سمة التقرير | تفاصيل |
|---|---|
| حجم السوق في عام 2023 | 40.48 مليار دولار أمريكي |
| حجم السوق بحلول عام 2031 | 73.99 مليار دولار أمريكي |
| معدل النمو السنوي المركب العالمي (2023 - 2031) | 7.8% |
| البيانات التاريخية | 2021-2022 |
| فترة التنبؤ | 2024-2031 |
| القطاعات المغطاة | حسب المنتج
|
| المناطق والدول المغطاة | أمريكا الشمالية
|
| قادة السوق وملفات تعريف الشركات الرئيسية |
|
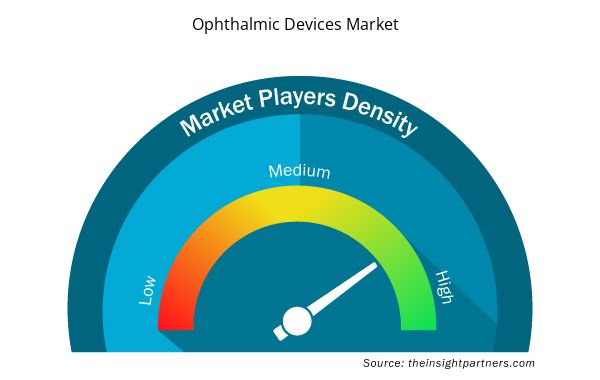
كثافة اللاعبين في سوق الأجهزة الطبية للعيون: فهم تأثيرها على ديناميكيات الأعمال
يشهد سوق الأجهزة الطبية للعيون نموًا سريعًا، مدفوعًا بالطلب المتزايد من جانب المستخدم النهائي بسبب عوامل مثل تفضيلات المستهلكين المتطورة والتقدم التكنولوجي والوعي المتزايد بفوائد المنتج. ومع ارتفاع الطلب، تعمل الشركات على توسيع عروضها والابتكار لتلبية احتياجات المستهلكين والاستفادة من الاتجاهات الناشئة، مما يؤدي إلى زيادة نمو السوق.
تشير كثافة اللاعبين في السوق إلى توزيع الشركات أو المؤسسات العاملة في سوق أو صناعة معينة. وهي تشير إلى عدد المنافسين (اللاعبين في السوق) الموجودين في مساحة سوق معينة نسبة إلى حجمها أو قيمتها السوقية الإجمالية.
الشركات الرئيسية العاملة في سوق الأجهزة الطبية للعيون هي:
- ألكون،
- توبكون،
- بوش + لومب،
- كارل زايس ميديتك،
- شركة هاج ستريت القابضة
- إيسيلور،
إخلاء المسؤولية : الشركات المذكورة أعلاه ليست مرتبة بأي ترتيب معين.

- احصل على نظرة عامة على أهم اللاعبين الرئيسيين في سوق الأجهزة العينية
تطورات الصناعة والفرص المستقبلية:
يتضمن تقرير سوق الأجهزة الطبية للعيون تحديد موقع الشركة وتركيزها لتقييم أداء المنافسين في السوق. وفقًا للبيانات الصحفية للشركة، تم ذكر بعض المبادرات التي اتخذتها الجهات الفاعلة الرئيسية العاملة في السوق أدناه:
- في يوليو 2021، استحوذت شركة Topcon Corporation على شركة VISIA Imaging Srl، وهي شركة مصنعة لأجهزة طب العيون ومقرها في ضواحي فلورنسا بإيطاليا. ومن خلال هذا الاستحواذ، تعتزم Topcon تعزيز محفظتها المتميزة من أجهزة تصوير قاع العين - والتي تشمل كاميرات قاع العين والتصوير المقطعي البصري. ويعزز هذا الاستحواذ قدرات Topcon على التطوير والإنتاج لأجهزة وبرامج الجزء الأمامي من العين. ويهدف الاستحواذ أيضًا إلى تعزيز مكانة Topcon كأفضل منتج لأدوات التشخيص في طب العيون.
- في مارس 2021، دخلت شركة Iridex Corporation في تعاون استراتيجي مع شركة Topcon Corporation. تعد شركة Iridex Corporation من المزودين المشهورين للمنتجات الطبية المبتكرة القائمة على الليزر لعلاج الجلوكوما وأمراض الشبكية. استحوذت شركة Iridex على خط منتجات PASCAL من Topcon، من خلال الجمع بين تقنية MicroPulse الخاصة بها ومنصة الليزر PASCAL من Topcon، لتوسيع حصتها في سوق منتجات مسح شبكية العين بالليزر.
المنافسة والشركات الرئيسية:
يمكن أن تساعد توقعات سوق الأجهزة الطبية للعيون أصحاب المصلحة في التخطيط لاستراتيجيات النمو الخاصة بهم. تعد Alcon وTopcon وBausch + Lomb وCarl Zeiss Meditec وHaag Streit Holding وEssilor وJohnson & Johnson Vision وNidek Co. Ltd وHoya Corporation وCooperVision من بين اللاعبين البارزين في السوق. تركز هذه الشركات على تقديم منتجات عالية التقنية جديدة، والتقدم في المنتجات الحالية، والتوسع الجغرافي لتلبية الطلب المتزايد من المستهلكين في جميع أنحاء العالم.
- Historical Analysis (2 Years), Base Year, Forecast (7 Years) with CAGR
- PEST and SWOT Analysis
- Market Size Value / Volume - Global, Regional, Country
- Industry and Competitive Landscape
- Excel Dataset

Report Coverage
Revenue forecast, Company Analysis, Industry landscape, Growth factors, and Trends

Segment Covered
This text is related
to segments covered.

Regional Scope
North America, Europe, Asia Pacific, Middle East & Africa, South & Central America

Country Scope
This text is related
to country scope.
Frequently Asked Questions
The ophthalmic devices market was valued at US$ 40.48 billion in 2023.
The global ophthalmic devices market is segmented based on by product, indication, and end user. The ophthalmic devices market, by product, is categorized into vision care products, surgical devices, and diagnostics and monitoring devices. The vision care products segment held a significant market share in 2023 and is anticipated to record the highest CAGR in the market during 2023–2031.
The ophthalmic devices market majorly consists of the players, including Alcon, Topcon, Bausch + Lomb, Carl Zeiss Meditec, Haag Streit Holding, Essilor, Johnson & Johnson Vision, Nidek Co. Ltd, Hoya Corporation, and CooperVision.
The factors driving the growth of the ophthalmic devices market include the increasing prevalence of optical disorders and the growing geriatric population. However, high cost of devices hampers the growth of the ophthalmic devices market.
The ophthalmic devices market is expected to be valued at US$ 73.79 billion in 2031.
The ophthalmic devices are used for diagnosis, surgical, and vision correction purposes. These devices include invasive devices such as implantable devices (intraocular lenses and glaucoma stents), and noninvasive diagnostic equipment and instruments. The adoption of these devices has increased due to increasing cases of glaucoma, cataract, and other vision-related issues worldwide.
Trends and growth analysis reports related to Life Sciences : READ MORE..
The List of Companies - Ophthalmic Devices Market
- Alcon
- Topcon Corp.
- Bausch + Lomb
- Carl Zeiss Meditec
- Haag?Streit Holding
- Essilor
- Johnson & Johnson Vision
- Nidek Co. Ltd
- Hoya Corporation
- CooperVision.
The Insight Partners performs research in 4 major stages: Data Collection & Secondary Research, Primary Research, Data Analysis and Data Triangulation & Final Review.
- Data Collection and Secondary Research:
As a market research and consulting firm operating from a decade, we have published and advised several client across the globe. First step for any study will start with an assessment of currently available data and insights from existing reports. Further, historical and current market information is collected from Investor Presentations, Annual Reports, SEC Filings, etc., and other information related to company’s performance and market positioning are gathered from Paid Databases (Factiva, Hoovers, and Reuters) and various other publications available in public domain.
Several associations trade associates, technical forums, institutes, societies and organization are accessed to gain technical as well as market related insights through their publications such as research papers, blogs and press releases related to the studies are referred to get cues about the market. Further, white papers, journals, magazines, and other news articles published in last 3 years are scrutinized and analyzed to understand the current market trends.
- Primary Research:
The primarily interview analysis comprise of data obtained from industry participants interview and answers to survey questions gathered by in-house primary team.
For primary research, interviews are conducted with industry experts/CEOs/Marketing Managers/VPs/Subject Matter Experts from both demand and supply side to get a 360-degree view of the market. The primary team conducts several interviews based on the complexity of the markets to understand the various market trends and dynamics which makes research more credible and precise.
A typical research interview fulfils the following functions:
- Provides first-hand information on the market size, market trends, growth trends, competitive landscape, and outlook
- Validates and strengthens in-house secondary research findings
- Develops the analysis team’s expertise and market understanding
Primary research involves email interactions and telephone interviews for each market, category, segment, and sub-segment across geographies. The participants who typically take part in such a process include, but are not limited to:
- Industry participants: VPs, business development managers, market intelligence managers and national sales managers
- Outside experts: Valuation experts, research analysts and key opinion leaders specializing in the electronics and semiconductor industry.
Below is the breakup of our primary respondents by company, designation, and region:

Once we receive the confirmation from primary research sources or primary respondents, we finalize the base year market estimation and forecast the data as per the macroeconomic and microeconomic factors assessed during data collection.
- Data Analysis:
Once data is validated through both secondary as well as primary respondents, we finalize the market estimations by hypothesis formulation and factor analysis at regional and country level.
- Macro-Economic Factor Analysis:
We analyse macroeconomic indicators such the gross domestic product (GDP), increase in the demand for goods and services across industries, technological advancement, regional economic growth, governmental policies, the influence of COVID-19, PEST analysis, and other aspects. This analysis aids in setting benchmarks for various nations/regions and approximating market splits. Additionally, the general trend of the aforementioned components aid in determining the market's development possibilities.
- Country Level Data:
Various factors that are especially aligned to the country are taken into account to determine the market size for a certain area and country, including the presence of vendors, such as headquarters and offices, the country's GDP, demand patterns, and industry growth. To comprehend the market dynamics for the nation, a number of growth variables, inhibitors, application areas, and current market trends are researched. The aforementioned elements aid in determining the country's overall market's growth potential.
- Company Profile:
The “Table of Contents” is formulated by listing and analyzing more than 25 - 30 companies operating in the market ecosystem across geographies. However, we profile only 10 companies as a standard practice in our syndicate reports. These 10 companies comprise leading, emerging, and regional players. Nonetheless, our analysis is not restricted to the 10 listed companies, we also analyze other companies present in the market to develop a holistic view and understand the prevailing trends. The “Company Profiles” section in the report covers key facts, business description, products & services, financial information, SWOT analysis, and key developments. The financial information presented is extracted from the annual reports and official documents of the publicly listed companies. Upon collecting the information for the sections of respective companies, we verify them via various primary sources and then compile the data in respective company profiles. The company level information helps us in deriving the base number as well as in forecasting the market size.
- Developing Base Number:
Aggregation of sales statistics (2020-2022) and macro-economic factor, and other secondary and primary research insights are utilized to arrive at base number and related market shares for 2022. The data gaps are identified in this step and relevant market data is analyzed, collected from paid primary interviews or databases. On finalizing the base year market size, forecasts are developed on the basis of macro-economic, industry and market growth factors and company level analysis.
- Data Triangulation and Final Review:
The market findings and base year market size calculations are validated from supply as well as demand side. Demand side validations are based on macro-economic factor analysis and benchmarks for respective regions and countries. In case of supply side validations, revenues of major companies are estimated (in case not available) based on industry benchmark, approximate number of employees, product portfolio, and primary interviews revenues are gathered. Further revenue from target product/service segment is assessed to avoid overshooting of market statistics. In case of heavy deviations between supply and demand side values, all thes steps are repeated to achieve synchronization.
We follow an iterative model, wherein we share our research findings with Subject Matter Experts (SME’s) and Key Opinion Leaders (KOLs) until consensus view of the market is not formulated – this model negates any drastic deviation in the opinions of experts. Only validated and universally acceptable research findings are quoted in our reports.
We have important check points that we use to validate our research findings – which we call – data triangulation, where we validate the information, we generate from secondary sources with primary interviews and then we re-validate with our internal data bases and Subject matter experts. This comprehensive model enables us to deliver high quality, reliable data in shortest possible time.


 Get Free Sample For