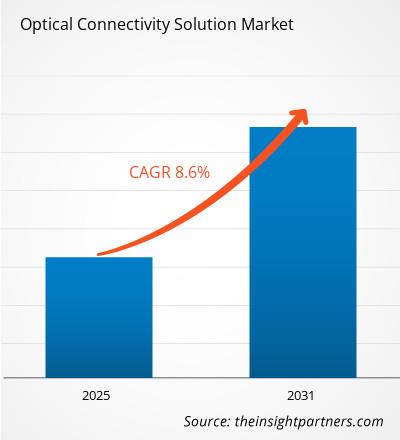
من المتوقع أن يسجل سوق حلول الاتصال البصري معدل نمو سنوي مركب بنسبة 8.6% خلال الفترة 2023-2031. ومن المرجح أن يظل التقدم المستمر في التقنيات البصرية، مثل الفوتونيات والألياف الضوئية، اتجاهًا رئيسيًا في السوق.
تحليل سوق حلول الاتصال البصري
- يتضمن سوق حلول الاتصال البصري آفاق نمو بسبب اتجاهات السوق الحالية وتأثيرها المتوقع خلال فترة التنبؤ.
- يشهد سوق حلول الاتصال البصري نموًا بسبب عوامل مثل الطلب المتزايد على الإنترنت عالي السرعة ونقل البيانات، والزيادة في اعتماد أجهزة إنترنت الأشياء، وزيادة الاستثمارات في مراكز البيانات.
- يوفر الاستثمار في المدن الذكية والطلب المتزايد في قطاعي التعليم والرعاية الصحية فرصًا مربحة لسوق حلول الاتصال البصري.
نظرة عامة على سوق حلول الاتصال البصري
- يشير الاتصال البصري إلى استخدام الضوء لنقل البيانات عبر كابلات الألياف الضوئية، مما يتيح الاتصال عالي السرعة لمسافات طويلة. وعلى النقيض من الأنظمة التقليدية القائمة على النحاس، تستخدم هذه التقنية الليزر أو مصابيح LED لتوصيل نبضات الضوء عبر خيوط صغيرة من الألياف الزجاجية أو البلاستيكية، مما يتيح سرعات نقل بيانات أسرع وفقدان إشارة أقل.
- نظرًا لأن الاتصال البصري يمكنه إرسال كميات هائلة من البيانات عبر مسافات كبيرة مع القليل من التداخل، فهو يستخدم على نطاق واسع في مراكز البيانات والبنية التحتية للإنترنت وشبكات الاتصالات .
- وهو بمثابة الأساس للإنترنت عالي السرعة المعاصر وهو ضروري لتلبية الطلب المتزايد على النطاق الترددي في مجتمعنا العولمي.
تخصيص البحث ليناسب متطلباتك
يمكننا تحسين وتخصيص التحليل والنطاق الذي لم يتم تحقيقه من خلال عروضنا القياسية. ستساعدك هذه المرونة في الحصول على المعلومات الدقيقة اللازمة لتخطيط أعمالك واتخاذ القرارات.
سوق حلول الاتصال البصري: رؤى استراتيجية

معدل النمو السنوي المركب (2024 - 2031)8.6%- حجم السوق 2023
XX مليون دولار أمريكي - حجم السوق 2031
مليون دولار أمريكي
ديناميكيات السوق
- ارتفاع الطلب على الإنترنت عالي السرعة ونقل البيانات، وزيادة في اعتماد أجهزة إنترنت الأشياء، وزيادة الاستثمارات في مراكز البيانات
- الاستثمار في المدن الذكية وزيادة الطلب في قطاعي التعليم والرعاية الصحية
- التطورات المستمرة في التقنيات البصرية، مثل الفوتونيات والألياف البصرية
اللاعبون الرئيسيون
- شركة أدران
- برودكوم
- شركة سيينا
- شركة انفينيرا
- شركة ريلاينس للاتصالات، ذ.م.م
- خدمات الألياف البصرية
- شركة كورنينج المحدودة
- فوجيتسو للمكونات البصرية المحدودة
- شركة فينيسار
- شركة هواوي للتكنولوجيا المحدودة
نظرة عامة إقليمية

- أمريكا الشمالية
- أوروبا
- آسيا والمحيط الهادئ
- أمريكا الجنوبية والوسطى
- الشرق الأوسط وأفريقيا
تقسيم السوق
 عنصر
عنصر- الموصلات
- المحولات
- تجميعات الكابلات
- لوحات خلفية
 حجم المؤسسة
- الشركات الكبيرة
- الشركات الصغيرة والمتوسطة
 طلب
طلب- مراكز البيانات
- الاتصالات السلكية واللاسلكية
- العسكرية والفضائية
- طبي
- يُظهر ملف PDF النموذجي بنية المحتوى وطبيعة المعلومات مع التحليل النوعي والكمي.
محركات وفرص سوق حلول الاتصال البصري
ارتفاع في اعتماد أجهزة إنترنت الأشياء لصالح السوق
- يصف إنترنت الأشياء (IoT) شبكة واسعة النطاق من الأجهزة المترابطة إلى جانب التقنيات التي تمكن الاتصالات بين هذه الأجهزة والسحابة.
- في الآونة الأخيرة، كان هناك ارتفاع كبير في اعتماد تقنيات إنترنت الأشياء بسبب التقدم في تقنيات الاتصال المحمولة واللاسلكية ، وانخفاض تدريجي في تكلفة أجهزة الاستشعار والمكونات الأخرى.
- ]تستخدم العديد من الصناعات إنترنت الأشياء لتحسين الكفاءة وتقليل تكاليف عملياتها.
- وفقًا لموقع Finance Online، كان هناك ما يقرب من 14.76 مليار جهاز متصل بالإنترنت اعتبارًا من نوفمبر 2023، ومن المتوقع أن يرتفع هذا الرقم إلى حوالي 25.44 مليار بحلول عام 2030. ووفقًا لتوقعات IoT Analytics، فإن 75٪ من إجمالي الأجهزة المستخدمة ستكون إنترنت الأشياء بحلول عام 2030. وعلاوة على ذلك، قدرت FinleyUSA الإنفاق العالمي على إنترنت الأشياء بنحو 1.1 تريليون دولار أمريكي في عام 2023.
- أصبح الاتصال العالمي ضروريًا بشكل متزايد مع اتصال المزيد من الأجهزة، حيث يلعب حل الاتصال البصري دورًا حاسمًا.
الاستثمار في المدن الذكية
- مع الاتجاه المستمر للتحضر، تتخذ العديد من الحكومات مبادرات لتطوير المدن الذكية في اقتصاداتها.
- على سبيل المثال، نشرت الحكومة الألمانية في يونيو/حزيران 2024 خطة لمساعدة المدن والمجتمعات المحلية في مختلف أنحاء البلاد على تبني تقنيات المدن الذكية. وتتضمن الخطة إنشاء مركز للكفاءة وسوق لتطبيقات المدن الذكية.
- في عام 2021، وفي إطار مبادرة المدينة الذكية في سنغافورة، أعلنت الحكومة عن بناء 42 ألف منزل متصل بوحدة تكييف مركزية واحدة.
- تستخدم المدن الذكية تقنية إنترنت الأشياء لتحسين الحياة الحضرية وتحسين الخدمات وتعزيز الاستدامة.
- تُستخدم تقنية الاتصال بالألياف الضوئية على نطاق واسع لتحسين المدينة الذكية.
تقرير تحليل تجزئة سوق حلول الاتصال البصري
إن القطاعات الرئيسية التي ساهمت في اشتقاق تحليل سوق حلول الاتصال البصري هي المكون وحجم المؤسسة والتطبيق.
- حسب المكون، يتم تقسيم السوق إلى موصلات ومحولات وتجميعات كابلات ولوحات خلفية وغيرها.
- بحسب حجم المؤسسة، ينقسم السوق إلى مؤسسات كبيرة ومؤسسات صغيرة ومتوسطة.
- حسب التطبيق، يتم تقسيم السوق إلى مراكز البيانات، والاتصالات، والجيش والفضاء، والطبية، وغيرها.
تحليل حصة سوق حلول الاتصال البصري حسب المنطقة الجغرافية
- يتضمن تقرير سوق حلول الاتصال البصري تحليلاً مفصلاً لخمس مناطق جغرافية رئيسية، والتي تتضمن حجم السوق الحالي والتاريخي وتوقعات الفترة من 2021 إلى 2031، والتي تغطي أمريكا الشمالية وأوروبا وآسيا والمحيط الهادئ (APAC) والشرق الأوسط وأفريقيا (MEA) وأمريكا الجنوبية والوسطى.
- يتم تقسيم كل منطقة إلى بلدان مختلفة. يقدم هذا التقرير تحليلات وتوقعات لأكثر من 18 دولة، ويغطي ديناميكيات سوق حلول الاتصال البصري مثل العوامل المحركة والاتجاهات والفرص التي تؤثر على الأسواق على المستوى الإقليمي.
- كما يغطي التقرير تحليل PEST، والذي يتضمن دراسة العوامل الرئيسية التي تؤثر على سوق حلول الاتصال البصري في هذه المناطق.
نطاق تقرير سوق حلول الاتصال البصري
| سمة التقرير | تفاصيل |
|---|---|
| حجم السوق في عام 2023 | XX مليون دولار أمريكي |
| حجم السوق بحلول عام 2031 | XX مليون دولار أمريكي |
| معدل النمو السنوي المركب العالمي (2024 - 2031) | 8.6% |
| البيانات التاريخية | 2021-2022 |
| فترة التنبؤ | 2024-2031 |
| القطاعات المغطاة | حسب المكون
|
| المناطق والدول المغطاة | أمريكا الشمالية
|
| قادة السوق وملفات تعريف الشركات الرئيسية |
|
- يُظهر ملف PDF النموذجي بنية المحتوى وطبيعة المعلومات مع التحليل النوعي والكمي.
أخبار سوق حلول الاتصال البصري والتطورات الأخيرة
يتم تقييم سوق حلول الاتصال البصري من خلال جمع البيانات النوعية والكمية بعد البحث الأولي والثانوي، والتي تتضمن منشورات الشركات المهمة وبيانات الجمعيات وقواعد البيانات. فيما يلي بعض التطورات في سوق حلول الاتصال البصري:
- أعلنت شركة STL، الشركة الرائدة في مجال الحلول البصرية والرقمية، عن توسيع قدراتها في مجال الشبكات البصرية بإضافة محفظة الاتصال البصري في السوق الأمريكية. تمثل هذه الخطوة خطوة محورية في تقديم قدرات بصرية قوية ومتكاملة مصممة خصيصًا للعملاء في الولايات المتحدة لتلبية احتياجاتهم من الألياف الضوئية. وبفضل قدرتها على تقديم كابلات الألياف الضوئية المتقدمة ومنتجات الاتصال البصري، تهدف الشركة إلى خدمة قاعدة عملائها التي تضم ما يقرب من 50 عميلًا في منطقة الولايات المتحدة بشكل استراتيجي. (STL، بيان صحفي، يوليو 2024)
- أعلنت شركة فوجيتسو أنها طورت FUJITSU Network 1FINITY T250، وهو حل لنقل الضوء من النوع المتفكك، لتحقيق مبادرة IOWN (الشبكة البصرية واللاسلكية المبتكرة) (2) وبدأت المبيعات في مايو 2024. يمكن للحل الجديد ترقية موثوقية الشبكات البصرية الحالية بسهولة، وبالتالي تمكين إنشاء خدمات اتصال جديدة لشركات الاتصالات وشركات البث في حالات استخدام جديدة مثل الطب عن بعد والبناء عن بعد. (فوجيتسو، بيان صحفي، مايو 2024)
تقرير سوق حلول الاتصال البصري والتغطية والنتائج المتوقعة
يوفر تقرير "حجم سوق حلول الاتصال البصري والتوقعات (2021-2031)" تحليلاً مفصلاً للسوق يغطي المجالات التالية:
- حجم سوق حلول الاتصال البصري والتوقعات على المستويات العالمية والإقليمية والوطنية لجميع قطاعات السوق الرئيسية التي يغطيها النطاق
- اتجاهات سوق حلول الاتصال البصري، بالإضافة إلى ديناميكيات السوق مثل المحركات والقيود والفرص الرئيسية
- تحليل مفصل لقوى PEST/Porter الخمس وSWOT
- تحليل سوق حلول الاتصال البصري الذي يغطي اتجاهات السوق الرئيسية والإطار العالمي والإقليمي والجهات الفاعلة الرئيسية واللوائح والتطورات الأخيرة في السوق
- تحليل المشهد الصناعي والمنافسة الذي يغطي تركيز السوق، وتحليل خريطة الحرارة، واللاعبين البارزين، والتطورات الأخيرة لسوق حلول الاتصال البصري
- ملفات تعريف الشركة التفصيلية
- التحليل التاريخي (سنتان)، السنة الأساسية، التوقعات (7 سنوات) مع معدل النمو السنوي المركب
- تحليل PEST و SWOT
- حجم السوق والقيمة / الحجم - عالميًا وإقليميًا وقطريًا
- الصناعة والمنافسة
- مجموعة بيانات Excel


- Equipment Rental Software Market
- Artwork Management Software Market
- Clear Aligners Market
- Virtual Event Software Market
- Small Internal Combustion Engine Market
- Mail Order Pharmacy Market
- Fish Protein Hydrolysate Market
- Bioremediation Technology and Services Market
- Hydrogen Compressors Market
- Broth Market

Report Coverage
Revenue forecast, Company Analysis, Industry landscape, Growth factors, and Trends

Segment Covered
This text is related
to segments covered.

Regional Scope
North America, Europe, Asia Pacific, Middle East & Africa, South & Central America

Country Scope
This text is related
to country scope.
الأسئلة الشائعة
The global optical connectivity solution market is expected to grow at a CAGR of 8.6% during the forecast period 2024 - 2031.
Rising demand for high-speed internet and data transfer, surge in the adoption of IoT devices, and increasing investments in data centers are the major factors driving the optical connectivity solution market.
Constant advancements in optical technologies, like photonics and fiber optics, are anticipated to play a significant role in the global optical connectivity solution market in the coming years.
The leading players operating in the optical connectivity solution market are ADTRAN Inc.; Broadcom; Ciena Corporation; Infinera Corporation; Reliance Communications, LLC; FIBER OPTIC SERVICES; Corning Incorporated; FUJITSU OPTICAL COMPONENTS LIMITED; Finisar Corporation; and Huawei Technologies Co. Ltd.
The report can be delivered in PDF/PPT format; we can also share an Excel dataset based on the request.
Some of the customization options available based on the request are an additional 3–5 company profiles and a country-specific analysis of 3–5 countries of your choice. Customizations are to be requested/discussed before making final order confirmation, as our team would review the same and check the feasibility.
The List of Companies
1. OFS Fitel, LLC.
2. Adtell Integration
3. ADVA Optical Networking
4. Fujitsu Optical Components Ltd.
5. Huawei Technologies Co.,
6. OptiLayer GmbH
7. ZTE Corporation
8. OPhylink Communication Technology Ltd.
9. POFC CORP.
10. LUMEOVA
The Insight Partners performs research in 4 major stages: Data Collection & Secondary Research, Primary Research, Data Analysis and Data Triangulation & Final Review.
- Data Collection and Secondary Research:
As a market research and consulting firm operating from a decade, we have published and advised several client across the globe. First step for any study will start with an assessment of currently available data and insights from existing reports. Further, historical and current market information is collected from Investor Presentations, Annual Reports, SEC Filings, etc., and other information related to company’s performance and market positioning are gathered from Paid Databases (Factiva, Hoovers, and Reuters) and various other publications available in public domain.
Several associations trade associates, technical forums, institutes, societies and organization are accessed to gain technical as well as market related insights through their publications such as research papers, blogs and press releases related to the studies are referred to get cues about the market. Further, white papers, journals, magazines, and other news articles published in last 3 years are scrutinized and analyzed to understand the current market trends.
- Primary Research:
The primarily interview analysis comprise of data obtained from industry participants interview and answers to survey questions gathered by in-house primary team.
For primary research, interviews are conducted with industry experts/CEOs/Marketing Managers/VPs/Subject Matter Experts from both demand and supply side to get a 360-degree view of the market. The primary team conducts several interviews based on the complexity of the markets to understand the various market trends and dynamics which makes research more credible and precise.
A typical research interview fulfils the following functions:
- Provides first-hand information on the market size, market trends, growth trends, competitive landscape, and outlook
- Validates and strengthens in-house secondary research findings
- Develops the analysis team’s expertise and market understanding
Primary research involves email interactions and telephone interviews for each market, category, segment, and sub-segment across geographies. The participants who typically take part in such a process include, but are not limited to:
- Industry participants: VPs, business development managers, market intelligence managers and national sales managers
- Outside experts: Valuation experts, research analysts and key opinion leaders specializing in the electronics and semiconductor industry.
Below is the breakup of our primary respondents by company, designation, and region:

Once we receive the confirmation from primary research sources or primary respondents, we finalize the base year market estimation and forecast the data as per the macroeconomic and microeconomic factors assessed during data collection.
- Data Analysis:
Once data is validated through both secondary as well as primary respondents, we finalize the market estimations by hypothesis formulation and factor analysis at regional and country level.
- Macro-Economic Factor Analysis:
We analyse macroeconomic indicators such the gross domestic product (GDP), increase in the demand for goods and services across industries, technological advancement, regional economic growth, governmental policies, the influence of COVID-19, PEST analysis, and other aspects. This analysis aids in setting benchmarks for various nations/regions and approximating market splits. Additionally, the general trend of the aforementioned components aid in determining the market's development possibilities.
- Country Level Data:
Various factors that are especially aligned to the country are taken into account to determine the market size for a certain area and country, including the presence of vendors, such as headquarters and offices, the country's GDP, demand patterns, and industry growth. To comprehend the market dynamics for the nation, a number of growth variables, inhibitors, application areas, and current market trends are researched. The aforementioned elements aid in determining the country's overall market's growth potential.
- Company Profile:
The “Table of Contents” is formulated by listing and analyzing more than 25 - 30 companies operating in the market ecosystem across geographies. However, we profile only 10 companies as a standard practice in our syndicate reports. These 10 companies comprise leading, emerging, and regional players. Nonetheless, our analysis is not restricted to the 10 listed companies, we also analyze other companies present in the market to develop a holistic view and understand the prevailing trends. The “Company Profiles” section in the report covers key facts, business description, products & services, financial information, SWOT analysis, and key developments. The financial information presented is extracted from the annual reports and official documents of the publicly listed companies. Upon collecting the information for the sections of respective companies, we verify them via various primary sources and then compile the data in respective company profiles. The company level information helps us in deriving the base number as well as in forecasting the market size.
- Developing Base Number:
Aggregation of sales statistics (2020-2022) and macro-economic factor, and other secondary and primary research insights are utilized to arrive at base number and related market shares for 2022. The data gaps are identified in this step and relevant market data is analyzed, collected from paid primary interviews or databases. On finalizing the base year market size, forecasts are developed on the basis of macro-economic, industry and market growth factors and company level analysis.
- Data Triangulation and Final Review:
The market findings and base year market size calculations are validated from supply as well as demand side. Demand side validations are based on macro-economic factor analysis and benchmarks for respective regions and countries. In case of supply side validations, revenues of major companies are estimated (in case not available) based on industry benchmark, approximate number of employees, product portfolio, and primary interviews revenues are gathered. Further revenue from target product/service segment is assessed to avoid overshooting of market statistics. In case of heavy deviations between supply and demand side values, all thes steps are repeated to achieve synchronization.
We follow an iterative model, wherein we share our research findings with Subject Matter Experts (SME’s) and Key Opinion Leaders (KOLs) until consensus view of the market is not formulated – this model negates any drastic deviation in the opinions of experts. Only validated and universally acceptable research findings are quoted in our reports.
We have important check points that we use to validate our research findings – which we call – data triangulation, where we validate the information, we generate from secondary sources with primary interviews and then we re-validate with our internal data bases and Subject matter experts. This comprehensive model enables us to deliver high quality, reliable data in shortest possible time.
 احصل على عينة مجانية لهذا التقرير