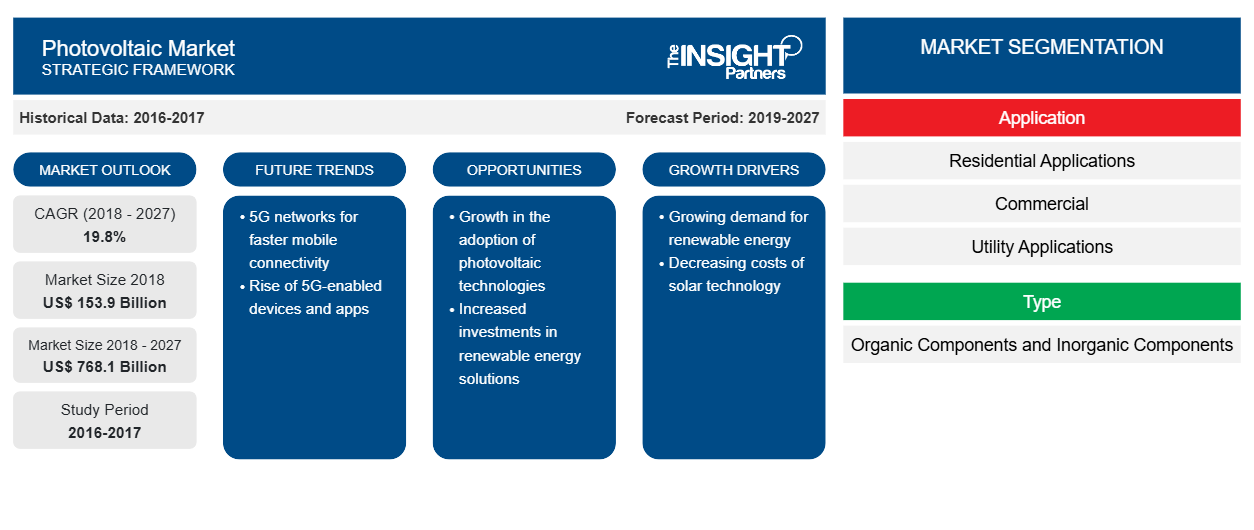
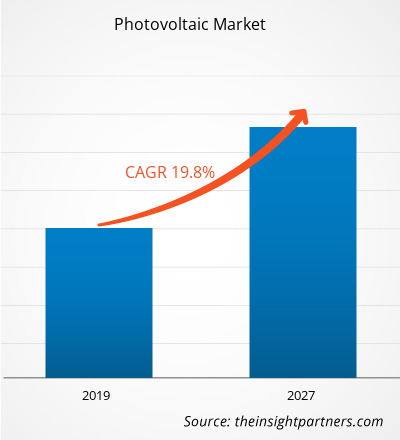
من المتوقع أن ينمو سوق الطاقة الكهروضوئية من 153.9 مليار دولار أمريكي في عام 2018 إلى 768.1 مليار دولار أمريكي بحلول عام 2027 بمعدل نمو سنوي مركب قدره 19.8٪ بين عامي 2019 و 2027.
في أعقاب التطور التكنولوجي والتركيز على الاتجاه المتزايد لتكنولوجيا الطاقة الشمسية الكهروضوئية، أنشأت الحكومتان الألمانية والإسبانية أطرًا سياسية قوية مثل الأهداف الوطنية الواضحة والحوافز الجذابة لتعزيز الاستهلاك والخطط المتكاملة لتعزيز التطور التكنولوجي وتبني تكنولوجيا الطاقة الكهروضوئية في مجال الطاقة الشمسية ودفع نمو سوق الطاقة الكهروضوئية. في منطقة آسيا والمحيط الهادئ، اتخذت الحكومات العديد من المبادرات لتقليل تكلفة الإعداد الإجمالي لتعظيم الفوائد البعيدة المدى لخيار خارج الشبكة في كهربة المناطق الريفية، جنبًا إلى جنب مع رفع التركيز نحو الظروف البيئية المستدامة. علاوة على ذلك، وضعت العديد من البلدان، مثل الصين، سياسات لتعزيز مستوى إنتاج طاقة الطاقة الشمسية الكهروضوئية . وبالتالي، تساهم العوامل المذكورة أعلاه في نمو سوق الطاقة الكهروضوئية.
تنمو الطاقة الكهروضوئية بوتيرة سريعة من خلال المساهمة بدور كبير في توازن الطاقة في أنظمة الطاقة في الاقتصاد. وقد أثبتت هذه الأنظمة أنها تقنية ناضجة تستخدم لتوليد الكهرباء السائدة ودفع نمو سوق الطاقة الكهروضوئية. ومع ذلك، تولد أنظمة الطاقة الكهروضوئية التي تعمل بالطاقة الشمسية الكهرباء بكميات زائدة. يوفر مزودو الطاقة في جميع أنحاء العالم القياس الصافي، والذي يُعرَّف بأنه ترتيب حيث تعود الكهرباء الزائدة التي تنتجها أنظمة الطاقة المتجددة المتصلة بالشبكة إلى عداد الكهرباء. وهذا يتجنب الهدر ويحسن توزيع الطاقة عند الحاجة. تمثل أنظمة الطاقة الكهروضوئية التي تستخدم تقنية الشبكة حوالي 99٪ من السعة المركبة مقارنة بالأنظمة المستقلة، والتي تتطلب بطاريات. تعتبر الطاقة الكهروضوئية المتصلة بالشبكة بدون بطاريات حلاً فعالاً من حيث التكلفة وتحتاج إلى صيانة أقل مما يزيد من اعتماد المنتجات القائمة على الطاقة الكهروضوئية وبالتالي يدفع حصة سوق الطاقة الكهروضوئية.
علاوة على ذلك، بالنسبة للأشخاص الذين يتحولون إلى الألواح الشمسية، تعتبر أنظمة الطاقة الكهروضوئية المتصلة بالشبكة خيارًا فعالاً من حيث التكلفة لتلبية احتياجاتهم الكهربائية بالكامل. كما أن تركيب أنظمة مستقلة يعد مهمة شاقة للغاية ويتطلب رأس مال ومساحة أكبر من أنظمة الطاقة الكهروضوئية المتصلة بالشبكة. وبالتالي، فإن الزيادة في اعتماد نظام الطاقة الكهروضوئية المتصلة بالشبكة من شأنها أن تدفع نمو سوق الطاقة الكهروضوئية . علاوة على ذلك، مع التركيز المتزايد على استخدام الطاقة المتجددة جنبًا إلى جنب مع الاتجاه نحو الحفاظ على الطاقة، أثبتت أنظمة الطاقة الكهروضوئية المتصلة بالشبكة أنها خيار قابل للتطبيق اقتصاديًا. ومع ذلك، فإن قابلية تطبيقها محدودة للغاية في الوقت الحالي وقد تزداد في السنوات القادمة.
قم بتخصيص هذا التقرير ليناسب متطلباتك
ستحصل على تخصيص لأي تقرير - مجانًا - بما في ذلك أجزاء من هذا التقرير، أو تحليل على مستوى الدولة، وحزمة بيانات Excel، بالإضافة إلى الاستفادة من العروض والخصومات الرائعة للشركات الناشئة والجامعات
- احصل على أهم اتجاهات السوق الرئيسية لهذا التقرير.ستتضمن هذه العينة المجانية تحليلاً للبيانات، بدءًا من اتجاهات السوق وحتى التقديرات والتوقعات.
رؤى حول سوق الطاقة الكهروضوئية
زيادة استخدام الدهانات الكهروضوئية للاستفادة من الطاقة الشمسية
لقد أدت التقلبات في أسعار النفط الخام، والمخاوف البيئية المتعلقة بالطاقة الكهرومائية، والمخاطر المرتبطة بالإشعاع النووي إلى تحويل عبء تلبية متطلبات الطاقة إلى الطاقة الشمسية. إن التقدم في التكنولوجيا، والتركيز على خفض تكاليف التركيب، والاستخدام السريع لتكنولوجيا الطاقة الكهروضوئية في التطبيقات السكنية من بين العوامل التي تعيد تعريف استخدام تكنولوجيا الطاقة الكهروضوئية. في عصر الاستخدام المتزايد للطاقة الشمسية، أصبح إدخال الدهانات الشمسية إنجازًا رائعًا. يمكن تطبيق الدهانات الشمسية، أو المعروفة شعبياً باسم الدهانات الكهروضوئية، على أي سطح لحبس الطاقة من الشمس وتحويلها إلى كهرباء. يتم دمج مكونات الطلاء مع مليارات القطع من المواد الحساسة للضوء المعلقة فيه، مما قد يساعد في تحويل الطلاء النموذجي إلى طلاء فائق الطاقة لالتقاط الطاقة. يمكن أن يؤدي استخدام الطلاء الكهروضوئي إلى تقليل الاعتماد على المعدن ومزيج من مبدأ الصمام الثنائي pn/التأثير الحراري الكهربائي لإنتاج الطاقة الكهربائية من التعرض لأشعة الشمس. وبالتالي، سيؤدي هذا إلى زيادة في اعتماد الطاقة الشمسية وفي نهاية المطاف دفع نمو سوق الطاقة الكهروضوئية. تهدف شركات مثل Onyx Solar Group LLC إلى تطوير التكنولوجيا من خلال التركيز على أنشطة البحث والتطوير والتعاون مع المعاهد لتطوير الطلاء الكهروضوئي وبالتالي دفع نمو سوق الطاقة الكهروضوئية. على الرغم من أن الدهانات الشمسية أو تقنية الطلاء الكهروضوئي في مرحلة الطفولة حاليًا، فمن المرجح أن تكتسب زخمًا في المستقبل القريب. مع تقدم وتقدم صناعة الطاقة الشمسية، فإن الطلاء الشمسي لديه فرصة ممتازة ليصبح خيارًا معقولاً. وبالتالي، فإن العوامل المذكورة أعلاه تخلق فرصة لسوق الطاقة الكهروضوئية.
رؤى إقليمية حول سوق الطاقة الكهروضوئية
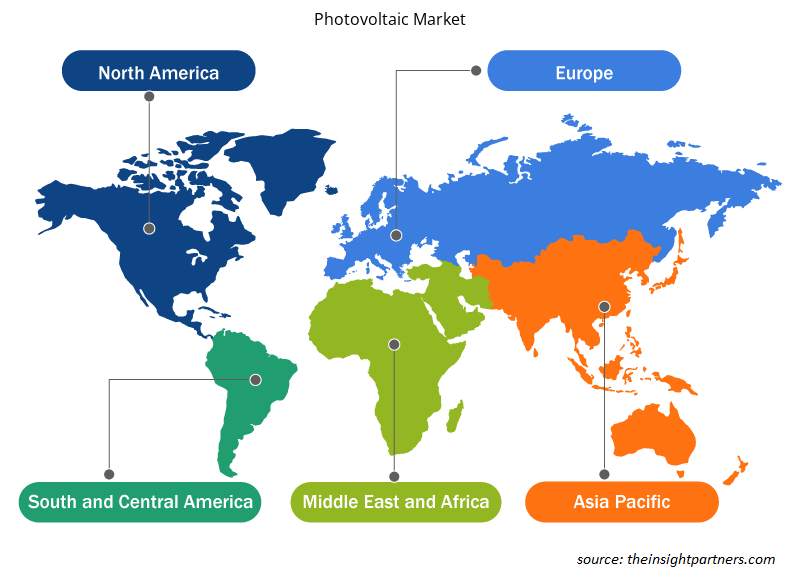
لقد قام المحللون في Insight Partners بشرح الاتجاهات والعوامل الإقليمية المؤثرة على سوق الطاقة الكهروضوئية طوال فترة التوقعات بشكل شامل. يناقش هذا القسم أيضًا قطاعات سوق الطاقة الكهروضوئية والجغرافيا في جميع أنحاء أمريكا الشمالية وأوروبا ومنطقة آسيا والمحيط الهادئ والشرق الأوسط وأفريقيا وأمريكا الجنوبية والوسطى.

- احصل على البيانات الإقليمية المحددة لسوق الطاقة الكهروضوئية
نطاق تقرير سوق الطاقة الكهروضوئية
| سمة التقرير | تفاصيل |
|---|---|
| حجم السوق في عام 2018 | 153.9 مليار دولار أمريكي |
| حجم السوق بحلول عام 2027 | 768.1 مليار دولار أمريكي |
| معدل النمو السنوي المركب العالمي (2018 - 2027) | 19.8% |
| البيانات التاريخية | 2016-2017 |
| فترة التنبؤ | 2019-2027 |
| القطاعات المغطاة | حسب الطلب
|
| المناطق والدول المغطاة | أمريكا الشمالية
|
| قادة السوق وملفات تعريف الشركات الرئيسية |
|
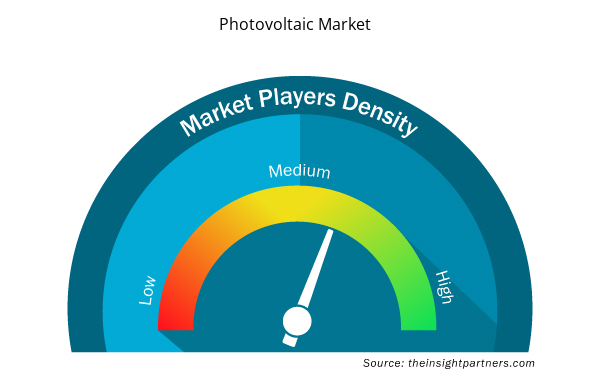
كثافة اللاعبين في السوق: فهم تأثيرها على ديناميكيات الأعمال
يشهد سوق الطاقة الكهروضوئية نموًا سريعًا، مدفوعًا بالطلب المتزايد من المستخدم النهائي بسبب عوامل مثل تفضيلات المستهلكين المتطورة والتقدم التكنولوجي والوعي المتزايد بفوائد المنتج. ومع ارتفاع الطلب، تعمل الشركات على توسيع عروضها والابتكار لتلبية احتياجات المستهلكين والاستفادة من الاتجاهات الناشئة، مما يؤدي إلى زيادة نمو السوق.
تشير كثافة اللاعبين في السوق إلى توزيع الشركات أو المؤسسات العاملة في سوق أو صناعة معينة. وهي تشير إلى عدد المنافسين (اللاعبين في السوق) الموجودين في مساحة سوق معينة نسبة إلى حجمها أو قيمتها السوقية الإجمالية.
الشركات الرئيسية العاملة في سوق الطاقة الكهروضوئية هي:
- شركة ميتسوبيشي الكتريك
- شركة باناسونيك
- شركة كانيكا
- شركة كيوسيرا
- شركة شارب
إخلاء المسؤولية : الشركات المذكورة أعلاه ليست مرتبة بأي ترتيب معين.

- احصل على نظرة عامة على أهم اللاعبين الرئيسيين في سوق الطاقة الكهروضوئية
رؤى السوق القائمة على المكونات
تتكون الخلايا الكهروضوئية من طبقتين أو أكثر من المواد شبه الموصلة. المادة الأكثر استخدامًا في الخلايا الكهروضوئية هي السيليكون. تتعرض الخلايا شبه الموصلة للضوء لتوليد الشحنات الكهربائية، ويمكن توصيل ذلك من خلال جهات اتصال معدنية كتيار مستمر (DC)، وبالتالي فإن زيادة اعتماد الخلايا الكهروضوئية من شأنها أن تزيد من حجم السوق الكهروضوئية العالمية في فترة التنبؤ.
يتبنى اللاعبون العاملون في سوق الطاقة الكهروضوئية استراتيجيات مثل عمليات الدمج والاستحواذ ومبادرات السوق للحفاظ على مواقعهم في سوق الطاقة الكهروضوئية. فيما يلي قائمة ببعض التطورات التي قام بها اللاعبون الرئيسيون:
- في عام 2021، أطلقت شركة رويال داتش شل مشروعها للطاقة الشمسية في قبص بقدرة 25 ميجاواط. ويتكون المشروع من أكثر من 88 ألف وحدة شمسية، ويقع على مساحة 50 هكتارًا في المنطقة الحرة بصحار شمال عُمان. ويساعد المشروع في تقليل حوالي 25 ألف طن متري من انبعاثات ثاني أكسيد الكربون سنويًا.
- وفي عام 2021، افتتحت شركة أكوا باور مشروع سكاكا للطاقة الشمسية الكهروضوئية بقدرة 300 ميجاوات، وهو أول مشروع للطاقة المتجددة على مستوى المرافق في المملكة، بتكلفة 1.2 مليار ريال سعودي. وقد فازت أكوا باور بالمشروع بسعر قياسي عالمي بلغ 2.3417 سنت أمريكي لكل كيلووات ساعة (8.781 هللة لكل كيلووات ساعة).
- التحليل التاريخي (سنتان)، السنة الأساسية، التوقعات (7 سنوات) مع معدل النمو السنوي المركب
- تحليل PEST و SWOT
- حجم السوق والقيمة / الحجم - عالميًا وإقليميًا وقطريًا
- الصناعة والمنافسة
- مجموعة بيانات Excel


Report Coverage
Revenue forecast, Company Analysis, Industry landscape, Growth factors, and Trends

Segment Covered
This text is related
to segments covered.

Regional Scope
North America, Europe, Asia Pacific, Middle East & Africa, South & Central America

Country Scope
This text is related
to country scope.
الأسئلة الشائعة
Renewable energy is regarded as a clean form of energy obtained from natural sources, which can be continuously replenished. Energy derived from renewable sources such as sunlight, wind, tides, and geothermal heat are sustainable and cost-effective. With the increase in population coupled with a rise in industrialization and economic development, the energy requirements have grown consistently, which is posing a burden upon natural resources. For instance, in the US, about 29% of global warming emissions are contributed to the electricity sector. Such emissions are resulted from the utilization of fossil fuels such as coal and natural gas. Over-exploitation and depletion of natural resources along with environmental degradation have led to a shift over renewable forms of energy. The demand for electricity is associated with social and economic development that generates a requirement to shift to renewables in order to tackle climate change and promote sustainability of the environment while meeting energy demands of future generations. Renewable forms of energy generate little or no global warming emissions.
The leading type of photovoltaic type is inorganic components that has noted to account a CAGR of 22.3%. Organic components or solar cells are made of thin films of organic semiconducting materials so as to convert solar energy into electrical energy. A typical organic components device consists of one or more photoactive materials between two electrodes. A primary advantage of organic components technology over inorganic components is its ability to be applied in a large area and flexible solar modules.
The Asia Pacific region led the photovoltaic market with a market share of 52.13%in 2018. Solar energy has brought significant changes to energy usage pattern, from being an alternative source of energy to becoming a primary source of energy for power generation. It is quite evitable with the growing research and development activities focused on the increased production of solar energy, coupled with positive government initiatives and decreasing costs of photovoltaic equipment, in the Asian countries. Further, the diversification in the use of solar energy generation techniques by harnessing various technologies such as PV cell, thermal heating, and concentrated solar power technology is also leading to the growth of this industry.
Trends and growth analysis reports related to Electronics and Semiconductor : READ MORE..
The List of Companies
- Mitsubishi Electric Corporation
- Panasonic Corporation
- Kaneka Corporation
- KYOCERA Corporation
- Sharp Corporation
- JA Solar Co.,Ltd.
- Renesola Co. Ltd
- Trina Solar
- Jinko Solar
- Shunfeng International Clean Energy Co., Ltd.
The Insight Partners performs research in 4 major stages: Data Collection & Secondary Research, Primary Research, Data Analysis and Data Triangulation & Final Review.
- Data Collection and Secondary Research:
As a market research and consulting firm operating from a decade, we have published and advised several client across the globe. First step for any study will start with an assessment of currently available data and insights from existing reports. Further, historical and current market information is collected from Investor Presentations, Annual Reports, SEC Filings, etc., and other information related to company’s performance and market positioning are gathered from Paid Databases (Factiva, Hoovers, and Reuters) and various other publications available in public domain.
Several associations trade associates, technical forums, institutes, societies and organization are accessed to gain technical as well as market related insights through their publications such as research papers, blogs and press releases related to the studies are referred to get cues about the market. Further, white papers, journals, magazines, and other news articles published in last 3 years are scrutinized and analyzed to understand the current market trends.
- Primary Research:
The primarily interview analysis comprise of data obtained from industry participants interview and answers to survey questions gathered by in-house primary team.
For primary research, interviews are conducted with industry experts/CEOs/Marketing Managers/VPs/Subject Matter Experts from both demand and supply side to get a 360-degree view of the market. The primary team conducts several interviews based on the complexity of the markets to understand the various market trends and dynamics which makes research more credible and precise.
A typical research interview fulfils the following functions:
- Provides first-hand information on the market size, market trends, growth trends, competitive landscape, and outlook
- Validates and strengthens in-house secondary research findings
- Develops the analysis team’s expertise and market understanding
Primary research involves email interactions and telephone interviews for each market, category, segment, and sub-segment across geographies. The participants who typically take part in such a process include, but are not limited to:
- Industry participants: VPs, business development managers, market intelligence managers and national sales managers
- Outside experts: Valuation experts, research analysts and key opinion leaders specializing in the electronics and semiconductor industry.
Below is the breakup of our primary respondents by company, designation, and region:

Once we receive the confirmation from primary research sources or primary respondents, we finalize the base year market estimation and forecast the data as per the macroeconomic and microeconomic factors assessed during data collection.
- Data Analysis:
Once data is validated through both secondary as well as primary respondents, we finalize the market estimations by hypothesis formulation and factor analysis at regional and country level.
- Macro-Economic Factor Analysis:
We analyse macroeconomic indicators such the gross domestic product (GDP), increase in the demand for goods and services across industries, technological advancement, regional economic growth, governmental policies, the influence of COVID-19, PEST analysis, and other aspects. This analysis aids in setting benchmarks for various nations/regions and approximating market splits. Additionally, the general trend of the aforementioned components aid in determining the market's development possibilities.
- Country Level Data:
Various factors that are especially aligned to the country are taken into account to determine the market size for a certain area and country, including the presence of vendors, such as headquarters and offices, the country's GDP, demand patterns, and industry growth. To comprehend the market dynamics for the nation, a number of growth variables, inhibitors, application areas, and current market trends are researched. The aforementioned elements aid in determining the country's overall market's growth potential.
- Company Profile:
The “Table of Contents” is formulated by listing and analyzing more than 25 - 30 companies operating in the market ecosystem across geographies. However, we profile only 10 companies as a standard practice in our syndicate reports. These 10 companies comprise leading, emerging, and regional players. Nonetheless, our analysis is not restricted to the 10 listed companies, we also analyze other companies present in the market to develop a holistic view and understand the prevailing trends. The “Company Profiles” section in the report covers key facts, business description, products & services, financial information, SWOT analysis, and key developments. The financial information presented is extracted from the annual reports and official documents of the publicly listed companies. Upon collecting the information for the sections of respective companies, we verify them via various primary sources and then compile the data in respective company profiles. The company level information helps us in deriving the base number as well as in forecasting the market size.
- Developing Base Number:
Aggregation of sales statistics (2020-2022) and macro-economic factor, and other secondary and primary research insights are utilized to arrive at base number and related market shares for 2022. The data gaps are identified in this step and relevant market data is analyzed, collected from paid primary interviews or databases. On finalizing the base year market size, forecasts are developed on the basis of macro-economic, industry and market growth factors and company level analysis.
- Data Triangulation and Final Review:
The market findings and base year market size calculations are validated from supply as well as demand side. Demand side validations are based on macro-economic factor analysis and benchmarks for respective regions and countries. In case of supply side validations, revenues of major companies are estimated (in case not available) based on industry benchmark, approximate number of employees, product portfolio, and primary interviews revenues are gathered. Further revenue from target product/service segment is assessed to avoid overshooting of market statistics. In case of heavy deviations between supply and demand side values, all thes steps are repeated to achieve synchronization.
We follow an iterative model, wherein we share our research findings with Subject Matter Experts (SME’s) and Key Opinion Leaders (KOLs) until consensus view of the market is not formulated – this model negates any drastic deviation in the opinions of experts. Only validated and universally acceptable research findings are quoted in our reports.
We have important check points that we use to validate our research findings – which we call – data triangulation, where we validate the information, we generate from secondary sources with primary interviews and then we re-validate with our internal data bases and Subject matter experts. This comprehensive model enables us to deliver high quality, reliable data in shortest possible time.


 احصل على عينة مجانية لهذا التقرير