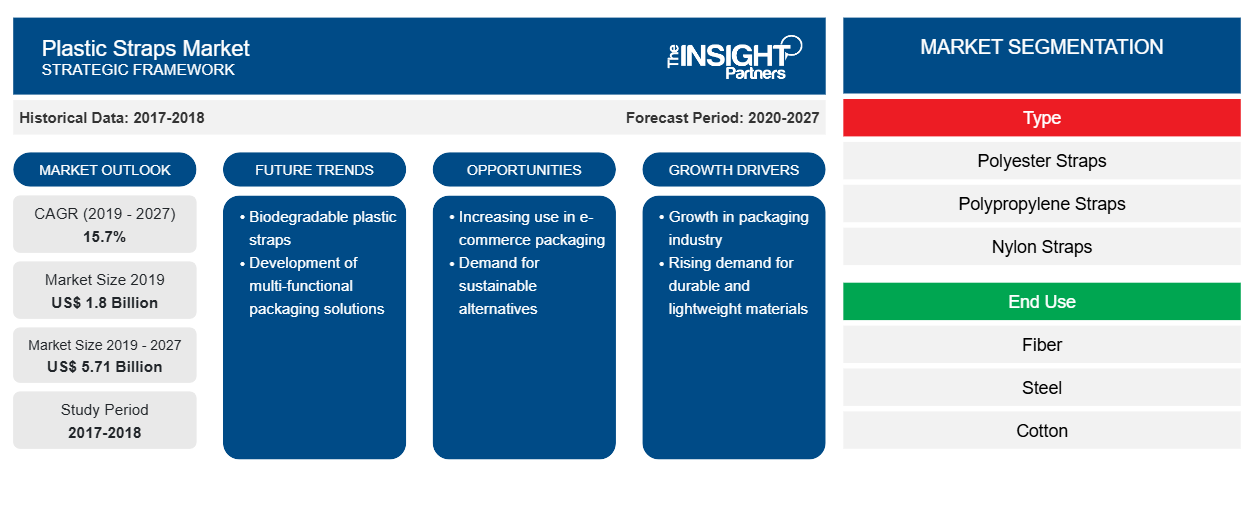
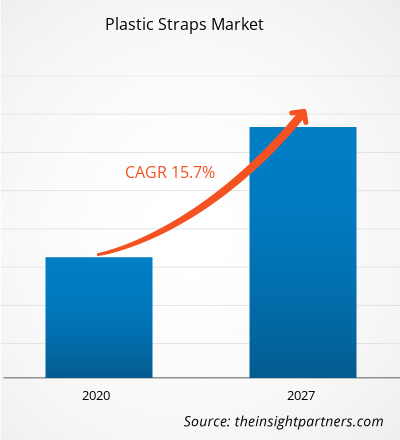
[تقرير بحثي] بلغت قيمة سوق الأشرطة البلاستيكية 1،802.47 مليون دولار أمريكي في عام 2019 ومن المتوقع أن تصل إلى 5،714.12 مليون دولار أمريكي بحلول عام 2027؛ ومن المتوقع أن تنمو بمعدل نمو سنوي مركب قدره 15.7٪ من عام 2020 إلى عام 2027.
يتزايد الطلب على الأشرطة البلاستيكية بسبب الارتفاع الكبير في الطلب على صناعة التعبئة والتغليف والخدمات اللوجستية الأفضل في جميع أنحاء العالم. علاوة على ذلك، يوفر ارتفاع صناعة الورق والبناء فرصة نمو لسوق الأشرطة البلاستيكية. بالإضافة إلى ذلك، فإن نمو سوق الأشرطة البلاستيكية مدفوع بالاستخدام المتزايد للأشرطة البلاستيكية في صناعات الورق والصلب والطوب والبلاط. يتم إنتاج مواد الأشرطة البلاستيكية من البولي بروبيلين والبوليستر، وهي متوفرة في مجموعة متنوعة من الأنماط والقوى واللمسات النهائية.
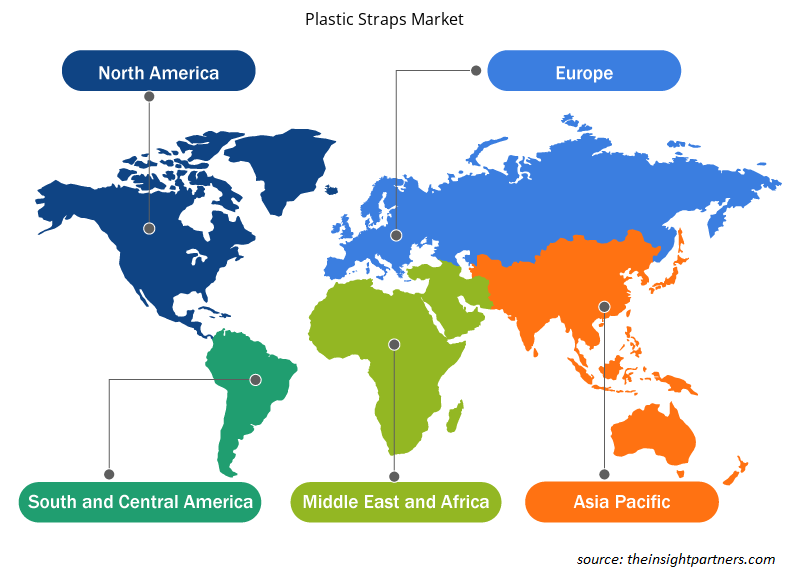
تمتلك منطقة أمريكا الشمالية أكبر حصة في سوق الأشرطة البلاستيكية العالمية . تعزى أكبر حصة سوقية لمنطقة أمريكا الشمالية في المقام الأول إلى ارتفاع إنتاج واستهلاك سوق الأشرطة البلاستيكية في الاقتصادات المتقدمة والنامية في أمريكا الشمالية. تعتبر الولايات المتحدة واحدة من أكبر الأسواق حيث يكون الطلب والإنتاج على الأشرطة البلاستيكية مرتفعًا بشكل كبير. تشمل الاقتصادات الأخرى التي تتبع نمط نمو سوق الأشرطة البلاستيكية كندا والمكسيك. تساهم منطقة أمريكا الشمالية بشكل كبير في نمو سوق الأشرطة البلاستيكية بسبب عوامل مثل التحضر السريع إلى جانب الميل المتزايد نحو منتجات متقدمة في صناعة اللوجستيات والتعبئة والتغليف مدعومة بارتفاع الدخل المتاح. وبصرف النظر عن هذا، فإن وجود الشركات المصنعة الكبرى في المنطقة يدفع بشكل كبير نمو سوق الأشرطة البلاستيكية في المنطقة.
الولايات المتحدة والبرازيل والهند وروسيا وجنوب إفريقيا والمكسيك وإسبانيا والمملكة المتحدة من بين الدول الأكثر تضررًا من حيث الحالات المؤكدة والوفيات المبلغ عنها اعتبارًا من أغسطس 2020. لقد أثر كوفيد-19 على الاقتصادات والصناعات في مختلف البلدان بسبب عمليات الإغلاق وحظر السفر وإغلاق الأعمال. تعد صناعة المواد الكيميائية والمواد العالمية واحدة من الصناعات الرئيسية التي تعاني من اضطرابات خطيرة مثل انقطاع سلسلة التوريد وانقطاعات التصنيع بسبب تفشي كوفيد-19. على سبيل المثال، تعد الصين المركز العالمي للتصنيع وأكبر مورد للمواد الخام لمختلف الصناعات. يؤثر إغلاق العديد من المصانع في الصين والمناطق الرائدة مثل منطقة آسيا والمحيط الهادئ وأوروبا على سلاسل التوريد العالمية ويؤثر سلبًا على التصنيع وجداول التسليم ومبيعات السلع المختلفة. كل هذه العوامل أثرت بشكل كبير على سوق الأشرطة البلاستيكية العالمية.
قم بتخصيص هذا التقرير ليناسب متطلباتك
ستحصل على تخصيص لأي تقرير - مجانًا - بما في ذلك أجزاء من هذا التقرير، أو تحليل على مستوى الدولة، وحزمة بيانات Excel، بالإضافة إلى الاستفادة من العروض والخصومات الرائعة للشركات الناشئة والجامعات
- احصل على أهم اتجاهات السوق الرئيسية لهذا التقرير.ستتضمن هذه العينة المجانية تحليلاً للبيانات، بدءًا من اتجاهات السوق وحتى التقديرات والتوقعات.
رؤى السوق
تطوير البلاستيك الحيوي يقود نمو السوق
يعد تطوير البلاستيك الحيوي أحد الاتجاهات الرئيسية التي شوهدت في صناعة الأشرطة البلاستيكية العالمية. ينمو الطلب على المنتجات البلاستيكية القابلة للتحلل بسرعة في التطبيقات الصناعية والسلع الاستهلاكية، وخاصة في صناعة التعبئة والتغليف. لقد وسعت المواد البلاستيكية الحيوية، المصنوعة من مواد أساسية قابلة للتحلل الحيوي تستخدم في الأشرطة البلاستيكية الحيوية، نطاق الأشرطة البلاستيكية في الصناعات الصناعية والسلع الاستهلاكية. كما أعطى الطلب المتزايد على إدارة النفايات دفعة لصناعة البلاستيك الحيوي. مع ظهور المواد الخام الحيوية والمستدامة في الأسواق الناشئة، من المتوقع أن تكون المواد البلاستيكية الحيوية مفيدة في تطبيقات جديدة مختلفة في المستقبل. في الوقت الحاضر، تتبنى بعض الشركات أشرطة بلاستيكية صديقة للبيئة للحفاظ على البيئة وتحسين عملية التعبئة والتغليف. يتم تصنيع أشرطة PET بالكامل من زجاجات PET، والتي يتم جمعها وتوزيعها على الاقتصاد عن طريق تحويلها إلى منتجات جديدة.
رؤى النوع
بناءً على النوع، يتم تقسيم سوق الأشرطة البلاستيكية إلى أحزمة البوليستر، وأحزمة البولي بروبيلين، وأحزمة النايلون، وأحزمة الورق، والأحزمة المركبة، والأحزمة المنسوجة والحبال. شكلت شريحة أحزمة البولي بروبيلين أكبر حصة من السوق العالمية في عام 2019؛ في حين من المتوقع أن ينمو قطاع أحزمة البوليستر بأعلى معدل نمو سنوي مركب خلال فترة التنبؤ. ظهرت أحزمة البوليستر كخيار ممكن لأحزمة الفولاذ حيث كانت هناك مشكلة تآكل مع الفولاذ، ولكن مع ظهور حزام البوليستر، تم التعامل معها. في وقت سابق، تم استخدام أحزمة الفولاذ لتغليف المنتجات حتى تم طرح أحزمة البوليستر في السوق. ومع ذلك، أدى هذا إلى تدهور جودة المنتجات المعبأة بها حيث يميل الفولاذ إلى التآكل. وكان لهذا تأثير ضار على صناعة النقل والصناعات الأخرى ذات الصلة. ونتيجة لهذا، بدأت سوق حلول الأشرطة البديلة في الظهور، والتي كان لابد أن تكون خفيفة ولطيفة أيضًا. كبديل عملي للأشرطة الفولاذية، أدى هذا إلى زيادة استخدام أحزمة البوليستر. لقد كان المصنعون بارعين في الاستفادة من مزايا أحزمة البوليستر، ونتيجة لذلك، هناك طلب متزايد على أحزمة البوليستر في السوق. هناك طلب متزايد على أحزمة البوليستر في منطقة أمريكا الشمالية لأن أحزمة البوليستر تعمل كحل متين ومنخفض التكلفة في صناعة السيارات. أيضًا، أحزمة البوليستر أرخص وأكثر فعالية من حيث التكلفة من حلول الأشرطة الأخرى، وخاصة أحزمة الفولاذ.
رؤى الاستخدام النهائي
بناءً على الاستخدام النهائي، يتم تقسيم سوق الأشرطة البلاستيكية إلى الألياف والصلب والقطن والورق والطوب والبلاط. شكلت شريحة الورق أكبر حصة من السوق في عام 2019، في حين من المتوقع أن تسجل شريحة القطن أعلى معدل نمو سنوي مركب خلال فترة التنبؤ. القطن غير كاشط وناعم بدرجة كافية لإحكام قبضة المشابك. ونظرًا للخصائص الناعمة غير الكاشطة لألياف القطن، لا يزال القطن يستخدم بشكل شائع في الملابس ومفروشات المنزل. يمكن استخدام أحزمة وأشرطة شبكية قطنية في العديد من الأماكن والصناعات أيضًا. يتم استخدامه لإنتاج الأشرطة والأحزمة والربطات. هناك نمو في الأشرطة البلاستيكية لحاويات التعبئة والتغليف وصناديق بالات القطن لتحسين سلامة المنتج.
تتبنى الشركات عادةً عمليات الدمج والاستحواذ والبحث والتطوير لتوسيع نطاق وجودها في جميع أنحاء العالم، وهو ما يؤثر بشكل أكبر على حجم السوق. تعد Teufelberger Stralsund GmbH وCyklop International وFROMM Group وPolychem Corporation وCrown Holdings, Inc. من بين اللاعبين الرئيسيين في السوق العاملين في سوق الأشرطة البلاستيكية. تقدم هذه الشركات منتجاتها في جميع أنحاء العالم، مما يساعدها في تلبية قاعدة عملاء أوسع. يركز هؤلاء اللاعبون الرئيسيون في السوق بشكل كبير على تطوير منتجات عالية الجودة ومبتكرة لتلبية متطلبات العملاء.
تقرير يسلط الضوء على
- اتجاهات الصناعة التقدمية في سوق الأشرطة البلاستيكية العالمية التي تساعد اللاعبين على تطوير استراتيجيات فعالة طويلة الأجل
- استراتيجيات نمو الأعمال التي تتبناها الأسواق المتقدمة والنامية
- التحليل الكمي لسوق الأشرطة البلاستيكية من 2017 إلى 2027
- تقدير الطلب العالمي على الأشرطة البلاستيكية عبر مختلف الصناعات
- تحليل PEST لتوضيح فعالية المشترين والموردين العاملين في الصناعة للتنبؤ بنمو السوق
- التطورات الأخيرة لفهم سيناريو السوق التنافسية والطلب العالمي على الأشرطة البلاستيكية
- اتجاهات السوق وتوقعاته والعوامل التي تدفع وتكبح نمو السوق
- فهم الاستراتيجيات التي تدعم المصلحة التجارية فيما يتعلق بنمو سوق الأشرطة البلاستيكية العالمية، مما يسهل عملية اتخاذ القرار الفعّال
- حجم سوق الأشرطة البلاستيكية في مختلف عقد السوق
- نظرة عامة مفصلة وتقسيم السوق، بالإضافة إلى ديناميكيات الصناعة
- حجم سوق الأشرطة البلاستيكية العالمية في مناطق مختلفة مع فرص نمو واعدة في هذه المناطق
رؤى إقليمية حول سوق الأشرطة البلاستيكية
لقد قام المحللون في Insight Partners بشرح الاتجاهات والعوامل الإقليمية المؤثرة على سوق الأشرطة البلاستيكية طوال فترة التوقعات بشكل شامل. يناقش هذا القسم أيضًا قطاعات سوق الأشرطة البلاستيكية والجغرافيا في جميع أنحاء أمريكا الشمالية وأوروبا ومنطقة آسيا والمحيط الهادئ والشرق الأوسط وأفريقيا وأمريكا الجنوبية والوسطى.

- احصل على البيانات الإقليمية المحددة لسوق الأشرطة البلاستيكية
نطاق تقرير سوق الأشرطة البلاستيكية
| سمة التقرير | تفاصيل |
|---|---|
| حجم السوق في عام 2019 | 1.8 مليار دولار أمريكي |
| حجم السوق بحلول عام 2027 | 5.71 مليار دولار أمريكي |
| معدل النمو السنوي المركب العالمي (2019 - 2027) | 15.7% |
| البيانات التاريخية | 2017-2018 |
| فترة التنبؤ | 2020-2027 |
| القطاعات المغطاة | حسب النوع
|
| المناطق والدول المغطاة | أمريكا الشمالية
|
| قادة السوق وملفات تعريف الشركات الرئيسية |
|
كثافة اللاعبين في سوق الأشرطة البلاستيكية: فهم تأثيرها على ديناميكيات الأعمال
يشهد سوق الأشرطة البلاستيكية نموًا سريعًا، مدفوعًا بالطلب المتزايد من المستخدم النهائي بسبب عوامل مثل تفضيلات المستهلك المتطورة والتقدم التكنولوجي والوعي المتزايد بفوائد المنتج. ومع ارتفاع الطلب، تعمل الشركات على توسيع عروضها والابتكار لتلبية احتياجات المستهلكين والاستفادة من الاتجاهات الناشئة، مما يؤدي إلى زيادة نمو السوق.
تشير كثافة اللاعبين في السوق إلى توزيع الشركات أو المؤسسات العاملة في سوق أو صناعة معينة. وهي تشير إلى عدد المنافسين (اللاعبين في السوق) الموجودين في مساحة سوق معينة نسبة إلى حجمها أو قيمتها السوقية الإجمالية.
الشركات الرئيسية العاملة في سوق الأشرطة البلاستيكية هي:
- حزام تلقائي
- موافقة ذات مسؤولية محدودة
- كراون القابضة المحدودة
- شركة سيكلوب نيدرلاند بي في
- شركة دوبوز سترابينج المحدودة
إخلاء المسؤولية : الشركات المذكورة أعلاه ليست مرتبة بأي ترتيب معين.

- احصل على نظرة عامة على أهم اللاعبين الرئيسيين في سوق الأشرطة البلاستيكية
سوق الأشرطة البلاستيكية حسب النوع
- أشرطة البوليستر
- أشرطة البولي بروبلين
- أحزمة النايلون
- أشرطة ورقية
- الأشرطة المركبة
- أحزمة سلكية ومنسوجة
سوق الأشرطة البلاستيكية حسب الاستخدام النهائي
- الفيبر
- فُولاَذ
- القطن
- ورق
- الطوب والبلاط
- آحرون
نبذة عن الشركة
- شركة تيوفيليبرجر سترالسوند المحدودة
- سيكلوب الدولية
- مجموعة فروم
- حزام السيارة في الهند
- موافقة ذات مسؤولية محدودة
- شركة دوبوز للأشرطة
- شركة ليندر المحدودة
- شركة PAC Strapping Products, Inc.
- كراون القابضة المحدودة
- شركة بوليكيم
- التحليل التاريخي (سنتان)، السنة الأساسية، التوقعات (7 سنوات) مع معدل النمو السنوي المركب
- تحليل PEST و SWOT
- حجم السوق والقيمة / الحجم - عالميًا وإقليميًا وقطريًا
- الصناعة والمنافسة
- مجموعة بيانات Excel


Report Coverage
Revenue forecast, Company Analysis, Industry landscape, Growth factors, and Trends

Segment Covered
This text is related
to segments covered.

Regional Scope
North America, Europe, Asia Pacific, Middle East & Africa, South & Central America

Country Scope
This text is related
to country scope.
الأسئلة الشائعة
Mergers and acquisition and research and development are commonly adopted by companies to expand their footprint worldwide, which is further impacting the size of the market. Teufelberger Stralsund GmbH, Cyklop International, FROMM Group, Polychem Corporation, and Crown Holdings, Inc. are amongst the major market players operating in the plastic straps market. These companies offer their products worldwide, which helps them in catering to a wider customer base. These major players in the market are highly focused on the development of high quality and innovative products to fulfill the customer’s requirements.
The development of bio-based plastics is one of the major trends seen in the global plastic straps industry. Demand for biodegradable plastic products is growing rapidly in industrial and consumer goods applications, especially in the packaging industry. Bio-based plastics, which are made of biodegradable base materials used in bio-based plastic straps, have further extended the scope of plastic straps in the industrial and consumer goods industries. The growing demand for waste management has also given a boost to the bio-based plastics industry. Nowadays, some companies are adopting eco- friendly plastic strappings for environmentally conscious and improve the packaging process. PET strapping is made entirely from PET bottles, which are collected and distributed to the economy by converting them into new products.
In 2019, North America region possesses the largest share in the global plastic straps market. The largest market share of the North America region is primarily attributed to the rise in production and consumption of plastic straps market in developed and developing economies of North America. US is considered to be one of the largest markets where the demand and production of plastic straps is significantly high. The other economies following the growth pattern of plastic straps market includes Canada and Mexico.
The major players operating in the global plastic strap market are Auto Strap India; CONSENT L.L.C; Cyklop International; DuBose Strapping, Inc.; FROMM Group; LINDER GmbH; Crown Holdings, Inc.; PAC Strapping Products, Inc.; Polychem Corporation; Teufelberger Stralsund GmbH and among others.
The polypropylene straps segment accounted for the largest share of the global market in 2019; whereas, the polyester straps segment is expected to grow at the highest CAGR during the forecast period. The polyester straps have emerged as a feasible option to steel strapping as there was a problem of corrosion with steel, but with the advent of the polyester strap, it has been tackled.
cotton segment is expected to register the highest CAGR during the forecast period. Cotton is non-abrasive and soft enough to make a tight grip on the buckles. Owing to the smooth, non-abrasive properties of cotton fiber, cotton is still commonly used in clothing and home furnishings. Cotton webbing belts and straps can be used in many places and industries, also. It is used for the production of straps, belts, and tie-downs. There is a growing of plastic straps for packaging containers and boxes of cotton bale for better safety of the product.
The List of Companies - Plastic Straps Market
- Auto Strap
- Consent L.L.C
- Crown Holdings, INC.
- Cyklop Nederland B.V.
- Dubose Strapping INC.
- FROMM PACKAGING
- Linder GMBH
- PAC Strapping Products, INC.
- Polychem Corporation
- Teufelberger Holding Aktiengesellschaft
The Insight Partners performs research in 4 major stages: Data Collection & Secondary Research, Primary Research, Data Analysis and Data Triangulation & Final Review.
- Data Collection and Secondary Research:
As a market research and consulting firm operating from a decade, we have published and advised several client across the globe. First step for any study will start with an assessment of currently available data and insights from existing reports. Further, historical and current market information is collected from Investor Presentations, Annual Reports, SEC Filings, etc., and other information related to company’s performance and market positioning are gathered from Paid Databases (Factiva, Hoovers, and Reuters) and various other publications available in public domain.
Several associations trade associates, technical forums, institutes, societies and organization are accessed to gain technical as well as market related insights through their publications such as research papers, blogs and press releases related to the studies are referred to get cues about the market. Further, white papers, journals, magazines, and other news articles published in last 3 years are scrutinized and analyzed to understand the current market trends.
- Primary Research:
The primarily interview analysis comprise of data obtained from industry participants interview and answers to survey questions gathered by in-house primary team.
For primary research, interviews are conducted with industry experts/CEOs/Marketing Managers/VPs/Subject Matter Experts from both demand and supply side to get a 360-degree view of the market. The primary team conducts several interviews based on the complexity of the markets to understand the various market trends and dynamics which makes research more credible and precise.
A typical research interview fulfils the following functions:
- Provides first-hand information on the market size, market trends, growth trends, competitive landscape, and outlook
- Validates and strengthens in-house secondary research findings
- Develops the analysis team’s expertise and market understanding
Primary research involves email interactions and telephone interviews for each market, category, segment, and sub-segment across geographies. The participants who typically take part in such a process include, but are not limited to:
- Industry participants: VPs, business development managers, market intelligence managers and national sales managers
- Outside experts: Valuation experts, research analysts and key opinion leaders specializing in the electronics and semiconductor industry.
Below is the breakup of our primary respondents by company, designation, and region:

Once we receive the confirmation from primary research sources or primary respondents, we finalize the base year market estimation and forecast the data as per the macroeconomic and microeconomic factors assessed during data collection.
- Data Analysis:
Once data is validated through both secondary as well as primary respondents, we finalize the market estimations by hypothesis formulation and factor analysis at regional and country level.
- Macro-Economic Factor Analysis:
We analyse macroeconomic indicators such the gross domestic product (GDP), increase in the demand for goods and services across industries, technological advancement, regional economic growth, governmental policies, the influence of COVID-19, PEST analysis, and other aspects. This analysis aids in setting benchmarks for various nations/regions and approximating market splits. Additionally, the general trend of the aforementioned components aid in determining the market's development possibilities.
- Country Level Data:
Various factors that are especially aligned to the country are taken into account to determine the market size for a certain area and country, including the presence of vendors, such as headquarters and offices, the country's GDP, demand patterns, and industry growth. To comprehend the market dynamics for the nation, a number of growth variables, inhibitors, application areas, and current market trends are researched. The aforementioned elements aid in determining the country's overall market's growth potential.
- Company Profile:
The “Table of Contents” is formulated by listing and analyzing more than 25 - 30 companies operating in the market ecosystem across geographies. However, we profile only 10 companies as a standard practice in our syndicate reports. These 10 companies comprise leading, emerging, and regional players. Nonetheless, our analysis is not restricted to the 10 listed companies, we also analyze other companies present in the market to develop a holistic view and understand the prevailing trends. The “Company Profiles” section in the report covers key facts, business description, products & services, financial information, SWOT analysis, and key developments. The financial information presented is extracted from the annual reports and official documents of the publicly listed companies. Upon collecting the information for the sections of respective companies, we verify them via various primary sources and then compile the data in respective company profiles. The company level information helps us in deriving the base number as well as in forecasting the market size.
- Developing Base Number:
Aggregation of sales statistics (2020-2022) and macro-economic factor, and other secondary and primary research insights are utilized to arrive at base number and related market shares for 2022. The data gaps are identified in this step and relevant market data is analyzed, collected from paid primary interviews or databases. On finalizing the base year market size, forecasts are developed on the basis of macro-economic, industry and market growth factors and company level analysis.
- Data Triangulation and Final Review:
The market findings and base year market size calculations are validated from supply as well as demand side. Demand side validations are based on macro-economic factor analysis and benchmarks for respective regions and countries. In case of supply side validations, revenues of major companies are estimated (in case not available) based on industry benchmark, approximate number of employees, product portfolio, and primary interviews revenues are gathered. Further revenue from target product/service segment is assessed to avoid overshooting of market statistics. In case of heavy deviations between supply and demand side values, all thes steps are repeated to achieve synchronization.
We follow an iterative model, wherein we share our research findings with Subject Matter Experts (SME’s) and Key Opinion Leaders (KOLs) until consensus view of the market is not formulated – this model negates any drastic deviation in the opinions of experts. Only validated and universally acceptable research findings are quoted in our reports.
We have important check points that we use to validate our research findings – which we call – data triangulation, where we validate the information, we generate from secondary sources with primary interviews and then we re-validate with our internal data bases and Subject matter experts. This comprehensive model enables us to deliver high quality, reliable data in shortest possible time.


 احصل على عينة مجانية لهذا التقرير