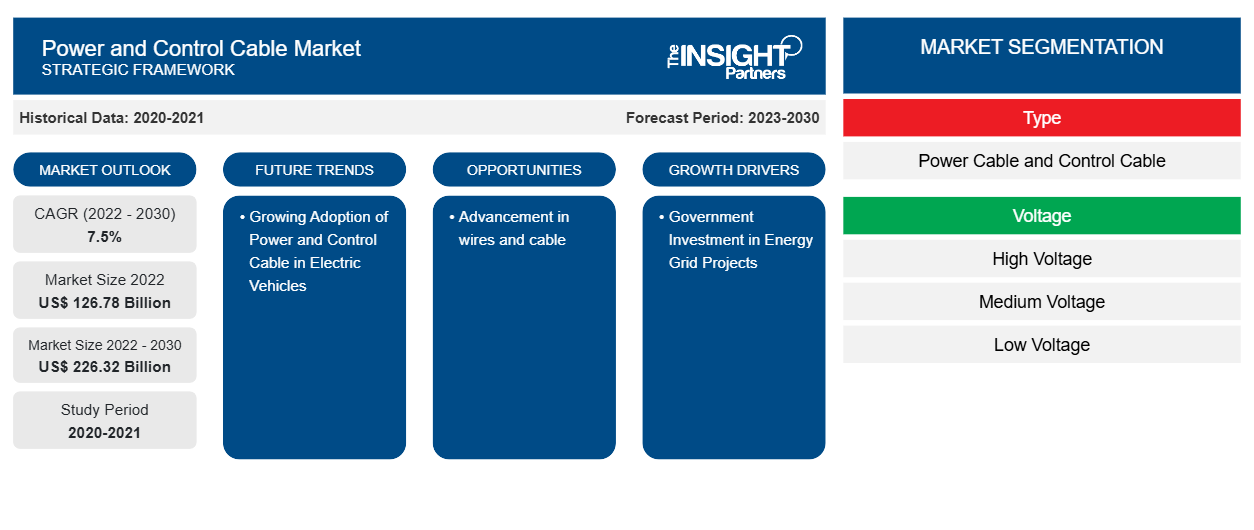
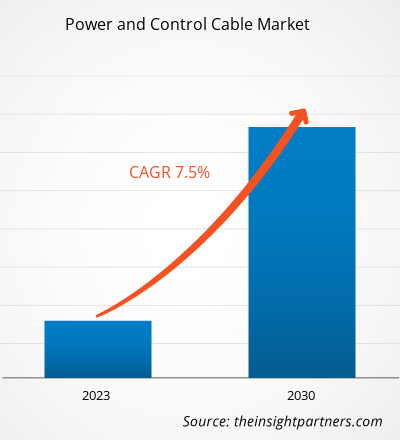
من المتوقع أن يصل حجم سوق كابلات الطاقة والتحكم إلى 226.32 مليار دولار أمريكي بحلول عام 2030 من 126.78 مليار دولار أمريكي في عام 2022. ومن المتوقع أن يسجل السوق معدل نمو سنوي مركب بنسبة 7.5٪ خلال الفترة 2022-2030. ومن المرجح أن يظل التقدم في الأسلاك والكابلات اتجاهًا رئيسيًا في السوق.
تحليل سوق كابلات الطاقة والتحكم
إن الاعتماد المتزايد على كابلات الطاقة والتحكم في المركبات الكهربائية والطلب المتزايد على الكهرباء الموثوقة من العوامل التي تدفع السوق إلى النمو. ومن المتوقع أن ينمو السوق خلال فترة التوقعات بسبب تطوير قطاع النقل والتوزيع. وعلاوة على ذلك، فإن الاستثمار الحكومي في مشاريع شبكات الطاقة والطلب المتزايد على مراكز البيانات والحوسبة السحابية يخلق فرصًا مربحة للسوق.
نظرة عامة على سوق كابلات الطاقة والتحكم
تنقل كابلات الطاقة الطاقة من مصدر إلى جهاز. تنقل كابلات التحكم الإشارات التي تتحكم في تشغيل الأجهزة. تعد كابلات الطاقة والتحكم النوع الأكثر شيوعًا من الكابلات الكهربائية المستخدمة في التطبيقات السكنية والتجارية والصناعية لتوفير الطاقة ونقل الإشارات. تختلف متطلبات التطبيقات لكابلات الطاقة والتحكم من حيث مستويات الجهد وبدائل الحماية ومتطلبات المرونة ومقاومة الزيت وأنواع العزل للبقاء في ظل الظروف البيئية والتشغيلية.
قم بتخصيص هذا التقرير ليناسب متطلباتك
ستحصل على تخصيص لأي تقرير - مجانًا - بما في ذلك أجزاء من هذا التقرير، أو تحليل على مستوى الدولة، وحزمة بيانات Excel، بالإضافة إلى الاستفادة من العروض والخصومات الرائعة للشركات الناشئة والجامعات
سوق كابلات الطاقة والتحكم:
- احصل على أهم اتجاهات السوق الرئيسية لهذا التقرير.ستتضمن هذه العينة المجانية تحليلاً للبيانات، بدءًا من اتجاهات السوق وحتى التقديرات والتوقعات.
محركات وفرص سوق كابلات الطاقة والتحكم
تزايد استخدام كابلات الطاقة والتحكم في المركبات الكهربائية لصالح السوق
في أغسطس 2022، قدرت وزارة الاقتصاد والتجارة والصناعة اليابانية ضرورة استثمار أكثر من 24 مليار دولار أمريكي لتطوير قاعدة تصنيع تنافسية للبطاريات المستخدمة في المركبات الكهربائية وأنظمة تخزين الطاقة. إن الطلب المتزايد على المركبات الكهربائية والدعم الحكومي نحو تبني المركبات الكهربائية هو الذي يقود السوق. في فبراير 2023، أعلنت حكومة كوريا الجنوبية عن خطتها لزيادة عدد المركبات الكهربائية المدعومة بنسبة 34٪، من 160.000 وحدة في عام 2022 إلى 215.000 سيارة في عام 2023. إن الطلب المتزايد على المركبات الكهربائية يزيد من الحاجة إلى البنية التحتية للشحن، وبالتالي تعزيز الحاجة إلى كابلات الطاقة.
الاستثمار الحكومي في مشاريع شبكة الطاقة
إن العدد المتزايد من الأنشطة الصناعية يزيد من الطلب على الطاقة بين الصناعات ويزيد من اعتماد كابلات الطاقة والتحكم لنقل الطاقة بشكل مناسب. إن الطلب على الطاقة يشجع الحكومة على اتخاذ خطوات تصحيحية في نقل الطاقة بشكل فعال. وفيما يلي العديد من الاستثمارات الحكومية لتوسيع مشاريع شبكة الطاقة:
- في يونيو 2023، وافق البنك الدولي على قرض بقيمة 268.4 مليون دولار أمريكي لمشروع الربط الكهربائي بين تونس وإيطاليا (ELMED) الذي يهدف إلى ربط شبكة الطاقة في تونس بشبكة الكهرباء الأوروبية من خلال كابل بحري بقوة 600 ميغاواط إلى إيطاليا. سيمول البنك الأوروبي لإعادة الإعمار والتنمية (EBRD) والبنك الأوروبي للاستثمار (EIB) والبنك الحكومي الألماني - KfW جزءًا من المشروع البالغ 1.08 مليار دولار أمريكي، وستمول شركة نقل الطاقة الإيطالية Terna الباقي.
- في مارس 2023، أعلنت شركة نقل الطاقة الإيطالية تيرنا عن خططها لاستثمار أكثر من 22.2 مليار دولار أمريكي في تطوير شبكة الطاقة الإيطالية على مدى السنوات العشر المقبلة. وكان إعلان الاستثمار جزءًا من خطة تيرنا لتطوير الشبكة الوطنية لعام 2023.
علاوة على ذلك، فإن زيادة الاستثمار الحكومي في مشاريع شبكات الطاقة يخلق فرصًا في السوق خلال فترة التوقعات .
تقرير تحليل تجزئة سوق كابلات الطاقة والتحكم
إن القطاعات الرئيسية التي ساهمت في اشتقاق تحليل سوق كابلات الطاقة والتحكم هي النوع والجهد والتطبيق.
- وفقًا للنوع، ينقسم سوق كابلات الطاقة والتحكم إلى كابلات الطاقة وكابلات التحكم. احتل قطاع كابلات الطاقة حصة سوقية أكبر في عام 2022.
- من حيث الجهد، يتم تقسيم السوق إلى جهد عالي وجهد متوسط وجهد منخفض. احتلت شريحة الجهد المنخفض حصة سوقية أكبر في عام 2022.
- على أساس التطبيق، ينقسم السوق إلى قطاع المرافق والقطاع الصناعي. وقد احتل قطاع المرافق حصة سوقية أكبر في عام 2022.
تحليل حصة سوق كابلات الطاقة والتحكم حسب المنطقة الجغرافية
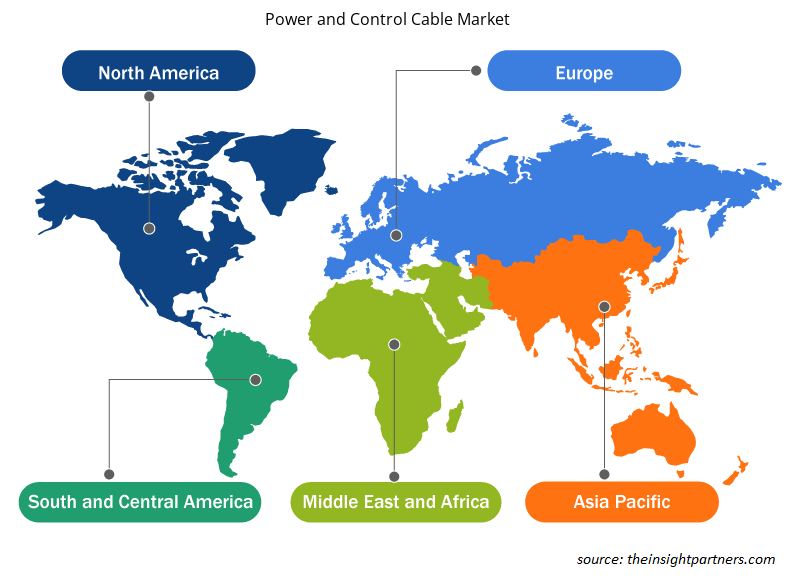
ينقسم النطاق الجغرافي لتقرير سوق كابلات الطاقة والتحكم بشكل أساسي إلى خمس مناطق: أمريكا الشمالية، وآسيا والمحيط الهادئ، وأوروبا، والشرق الأوسط وأفريقيا، وأمريكا الجنوبية والوسطى.
من المتوقع أن يتوسع السوق في منطقة آسيا والمحيط الهادئ خلال الفترة المتوقعة. في أبريل 2023، أعلنت حكومة الهند عن خطط للتوسع من 425500 كيلومتر دائرة (موجودة اعتبارًا من 31 مايو 2020) إلى 454200 كيلومتر دائرة بحلول عام 2024-2025، مما أدى إلى إضافة حوالي 28700 كيلومتر دائرة بموجب خطة Gati Shakti الرئيسية. تم اقتراح الإضافة في شبكة نظام النقل بين الولايات (ISTS) ولمستويات الجهد 220 كيلو فولت وما فوق. وبالمثل، في فبراير 2023، حصلت شركة Power Grid Corporation المملوكة للدولة على خمسة مشاريع لنقل الكهرباء بين الولايات من خلال طريق عطاءات تنافسية قائمة على التعرفة، والتي سيتم إكمالها على أساس البناء والتملك والتشغيل والنقل (BOOT). وبالتالي، تعمل المبادرات الحكومية لتحسين نقل الكهرباء على تعزيز السوق في المنطقة.
رؤى إقليمية حول سوق كابلات الطاقة والتحكم
لقد قام المحللون في Insight Partners بشرح الاتجاهات والعوامل الإقليمية المؤثرة على سوق كابلات الطاقة والتحكم طوال فترة التوقعات بشكل شامل. يناقش هذا القسم أيضًا قطاعات سوق كابلات الطاقة والتحكم والجغرافيا في جميع أنحاء أمريكا الشمالية وأوروبا ومنطقة آسيا والمحيط الهادئ والشرق الأوسط وأفريقيا وأمريكا الجنوبية والوسطى.
- احصل على البيانات الإقليمية المحددة لسوق كابلات الطاقة والتحكم
نطاق تقرير سوق كابلات الطاقة والتحكم
| سمة التقرير | تفاصيل |
|---|---|
| حجم السوق في عام 2022 | 126.78 مليار دولار أمريكي |
| حجم السوق بحلول عام 2030 | 226.32 مليار دولار أمريكي |
| معدل النمو السنوي المركب العالمي (2022 - 2030) | 7.5% |
| البيانات التاريخية | 2020-2021 |
| فترة التنبؤ | 2023-2030 |
| القطاعات المغطاة | حسب النوع
|
| المناطق والدول المغطاة | أمريكا الشمالية
|
| قادة السوق وملفات تعريف الشركات الرئيسية |
|
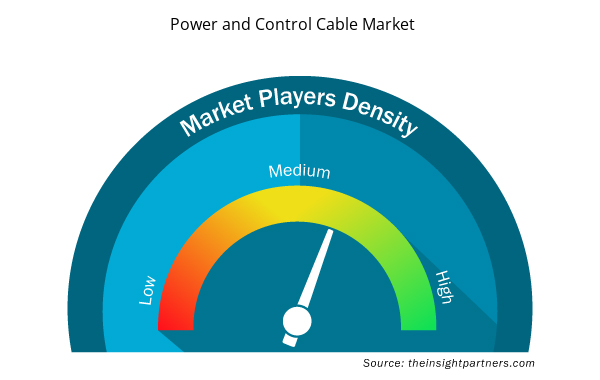
كثافة اللاعبين في السوق: فهم تأثيرها على ديناميكيات الأعمال
يشهد سوق كابلات الطاقة والتحكم نموًا سريعًا، مدفوعًا بالطلب المتزايد من المستخدم النهائي بسبب عوامل مثل تفضيلات المستهلكين المتطورة والتقدم التكنولوجي والوعي المتزايد بفوائد المنتج. ومع ارتفاع الطلب، تعمل الشركات على توسيع عروضها والابتكار لتلبية احتياجات المستهلكين والاستفادة من الاتجاهات الناشئة، مما يؤدي إلى زيادة نمو السوق.
تشير كثافة اللاعبين في السوق إلى توزيع الشركات أو المؤسسات العاملة في سوق أو صناعة معينة. وهي تشير إلى عدد المنافسين (اللاعبين في السوق) الموجودين في مساحة سوق معينة نسبة إلى حجمها أو قيمتها السوقية الإجمالية.
الشركات الرئيسية العاملة في سوق كابلات الطاقة والتحكم هي:
- شركة بيلدن
- شركة إنكور واير
- شركة فوروكاوا الكهربائية المحدودة
- مجموعة هينجتونج المحدودة
- ليوني ايه جي
- نيكسانز إس إيه
إخلاء المسؤولية : الشركات المذكورة أعلاه ليست مرتبة بأي ترتيب معين.
- احصل على نظرة عامة على أهم اللاعبين الرئيسيين في سوق كابلات الطاقة والتحكم
أخبار سوق كابلات الطاقة والتحكم والتطورات الأخيرة
يتم تقييم سوق كابلات الطاقة والتحكم من خلال جمع البيانات النوعية والكمية بعد البحث الأولي والثانوي، والتي تتضمن منشورات الشركات المهمة وبيانات الجمعيات وقواعد البيانات. فيما يلي بعض التطورات في سوق كابلات الطاقة والتحكم:
- أعلنت شركة سوميتومو للصناعات الكهربائية المحدودة عن خطة لإنشاء مصنع لكابلات الطاقة في اسكتلندا بالمملكة المتحدة. (المصدر: شركة سوميتومو للصناعات الكهربائية المحدودة، موقع الشركة الإلكتروني، مارس 2023)
تقرير سوق كابلات الطاقة والتحكم والتغطية والمخرجات
يوفر تقرير "حجم سوق كابلات الطاقة والتحكم والتوقعات (2020-2030)" تحليلاً مفصلاً للسوق يغطي المجالات التالية:
- حجم سوق كابلات الطاقة والتحكم وتوقعاته على المستويات العالمية والإقليمية والوطنية لجميع قطاعات السوق الرئيسية التي يغطيها النطاق
- اتجاهات سوق كابلات الطاقة والتحكم بالإضافة إلى ديناميكيات السوق مثل المحركات والقيود والفرص الرئيسية
- تحليل مفصل لقوى PEST/Porter الخمس وSWOT
- تحليل سوق كابلات الطاقة والتحكم يغطي اتجاهات السوق الرئيسية والإطار العالمي والإقليمي والجهات الفاعلة الرئيسية واللوائح والتطورات الأخيرة في السوق
- تحليل المشهد الصناعي والمنافسة الذي يغطي تركيز السوق، وتحليل خريطة الحرارة، واللاعبين البارزين، والتطورات الأخيرة لسوق كابلات الطاقة والتحكم
- ملفات تعريف الشركة التفصيلية
- التحليل التاريخي (سنتان)، السنة الأساسية، التوقعات (7 سنوات) مع معدل النمو السنوي المركب
- تحليل PEST و SWOT
- حجم السوق والقيمة / الحجم - عالميًا وإقليميًا وقطريًا
- الصناعة والمنافسة
- مجموعة بيانات Excel


Report Coverage
Revenue forecast, Company Analysis, Industry landscape, Growth factors, and Trends

Segment Covered
This text is related
to segments covered.

Regional Scope
North America, Europe, Asia Pacific, Middle East & Africa, South & Central America

Country Scope
This text is related
to country scope.
الأسئلة الشائعة
The global power and control cable market is estimated to register a CAGR of 7.5% during the forecast period 2022–2030.
The key players holding majority shares in the global power and control cable market are Belden Inc, Encore Wire Corp, Furukawa Electric Co Ltd, HENGTONG GROUP CO., LTD, LEONI AG, Nexans SA, Prysmian SpA, Riyadh Cables Group Co, Southwire Company LLC, Sumitomo Electric Industries Ltd.
The global power and control cable market is expected to reach US$ 226.32 billion by 2030.
Asia Pacific dominated the power and control cable market in 2022.
The growing adoption of video analytics powered by computer vision and the rising adoption of the Industry 4.0 Concept are the major factors that propel the global power and control cable market.
Advancements in wires and cable to play a significant role in the global power and control cable market in the coming years.
Trends and growth analysis reports related to Electronics and Semiconductor : READ MORE..
The List of Companies - Power and Control Cable Market
- Belden Inc
- Encore Wire Corp
- Furukawa Electric Co Ltd
- HENGTONG GROUP CO., LTD
- LEONI AG
- Nexans SA
- Prysmian SpA
- Riyadh Cables Group
- Southwire Company LLC
- Sumitomo Electric Industries Ltd
The Insight Partners performs research in 4 major stages: Data Collection & Secondary Research, Primary Research, Data Analysis and Data Triangulation & Final Review.
- Data Collection and Secondary Research:
As a market research and consulting firm operating from a decade, we have published and advised several client across the globe. First step for any study will start with an assessment of currently available data and insights from existing reports. Further, historical and current market information is collected from Investor Presentations, Annual Reports, SEC Filings, etc., and other information related to company’s performance and market positioning are gathered from Paid Databases (Factiva, Hoovers, and Reuters) and various other publications available in public domain.
Several associations trade associates, technical forums, institutes, societies and organization are accessed to gain technical as well as market related insights through their publications such as research papers, blogs and press releases related to the studies are referred to get cues about the market. Further, white papers, journals, magazines, and other news articles published in last 3 years are scrutinized and analyzed to understand the current market trends.
- Primary Research:
The primarily interview analysis comprise of data obtained from industry participants interview and answers to survey questions gathered by in-house primary team.
For primary research, interviews are conducted with industry experts/CEOs/Marketing Managers/VPs/Subject Matter Experts from both demand and supply side to get a 360-degree view of the market. The primary team conducts several interviews based on the complexity of the markets to understand the various market trends and dynamics which makes research more credible and precise.
A typical research interview fulfils the following functions:
- Provides first-hand information on the market size, market trends, growth trends, competitive landscape, and outlook
- Validates and strengthens in-house secondary research findings
- Develops the analysis team’s expertise and market understanding
Primary research involves email interactions and telephone interviews for each market, category, segment, and sub-segment across geographies. The participants who typically take part in such a process include, but are not limited to:
- Industry participants: VPs, business development managers, market intelligence managers and national sales managers
- Outside experts: Valuation experts, research analysts and key opinion leaders specializing in the electronics and semiconductor industry.
Below is the breakup of our primary respondents by company, designation, and region:

Once we receive the confirmation from primary research sources or primary respondents, we finalize the base year market estimation and forecast the data as per the macroeconomic and microeconomic factors assessed during data collection.
- Data Analysis:
Once data is validated through both secondary as well as primary respondents, we finalize the market estimations by hypothesis formulation and factor analysis at regional and country level.
- Macro-Economic Factor Analysis:
We analyse macroeconomic indicators such the gross domestic product (GDP), increase in the demand for goods and services across industries, technological advancement, regional economic growth, governmental policies, the influence of COVID-19, PEST analysis, and other aspects. This analysis aids in setting benchmarks for various nations/regions and approximating market splits. Additionally, the general trend of the aforementioned components aid in determining the market's development possibilities.
- Country Level Data:
Various factors that are especially aligned to the country are taken into account to determine the market size for a certain area and country, including the presence of vendors, such as headquarters and offices, the country's GDP, demand patterns, and industry growth. To comprehend the market dynamics for the nation, a number of growth variables, inhibitors, application areas, and current market trends are researched. The aforementioned elements aid in determining the country's overall market's growth potential.
- Company Profile:
The “Table of Contents” is formulated by listing and analyzing more than 25 - 30 companies operating in the market ecosystem across geographies. However, we profile only 10 companies as a standard practice in our syndicate reports. These 10 companies comprise leading, emerging, and regional players. Nonetheless, our analysis is not restricted to the 10 listed companies, we also analyze other companies present in the market to develop a holistic view and understand the prevailing trends. The “Company Profiles” section in the report covers key facts, business description, products & services, financial information, SWOT analysis, and key developments. The financial information presented is extracted from the annual reports and official documents of the publicly listed companies. Upon collecting the information for the sections of respective companies, we verify them via various primary sources and then compile the data in respective company profiles. The company level information helps us in deriving the base number as well as in forecasting the market size.
- Developing Base Number:
Aggregation of sales statistics (2020-2022) and macro-economic factor, and other secondary and primary research insights are utilized to arrive at base number and related market shares for 2022. The data gaps are identified in this step and relevant market data is analyzed, collected from paid primary interviews or databases. On finalizing the base year market size, forecasts are developed on the basis of macro-economic, industry and market growth factors and company level analysis.
- Data Triangulation and Final Review:
The market findings and base year market size calculations are validated from supply as well as demand side. Demand side validations are based on macro-economic factor analysis and benchmarks for respective regions and countries. In case of supply side validations, revenues of major companies are estimated (in case not available) based on industry benchmark, approximate number of employees, product portfolio, and primary interviews revenues are gathered. Further revenue from target product/service segment is assessed to avoid overshooting of market statistics. In case of heavy deviations between supply and demand side values, all thes steps are repeated to achieve synchronization.
We follow an iterative model, wherein we share our research findings with Subject Matter Experts (SME’s) and Key Opinion Leaders (KOLs) until consensus view of the market is not formulated – this model negates any drastic deviation in the opinions of experts. Only validated and universally acceptable research findings are quoted in our reports.
We have important check points that we use to validate our research findings – which we call – data triangulation, where we validate the information, we generate from secondary sources with primary interviews and then we re-validate with our internal data bases and Subject matter experts. This comprehensive model enables us to deliver high quality, reliable data in shortest possible time.
 احصل على عينة مجانية لهذا التقرير