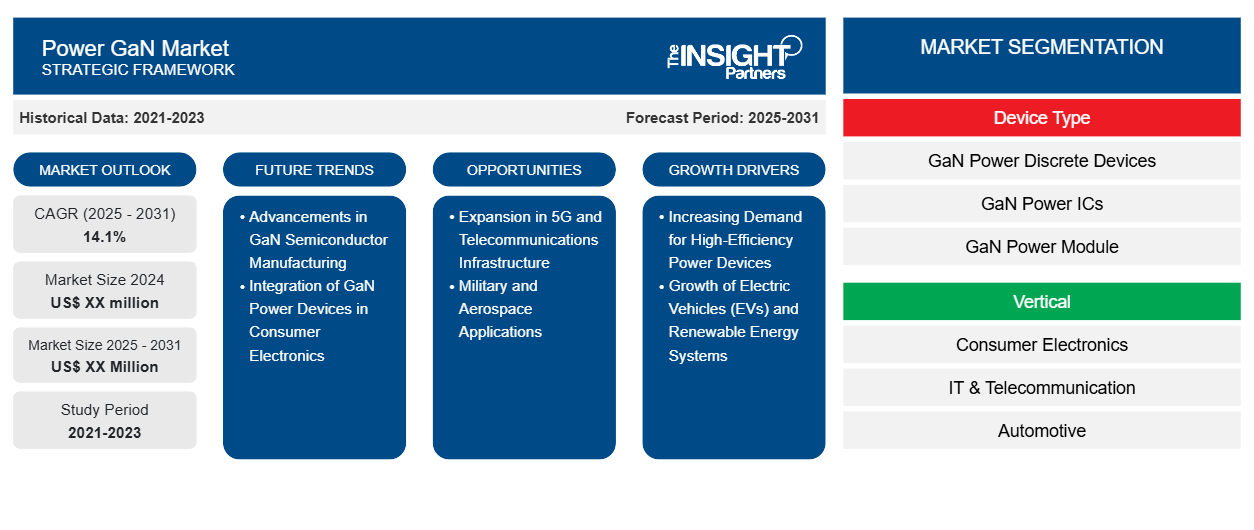
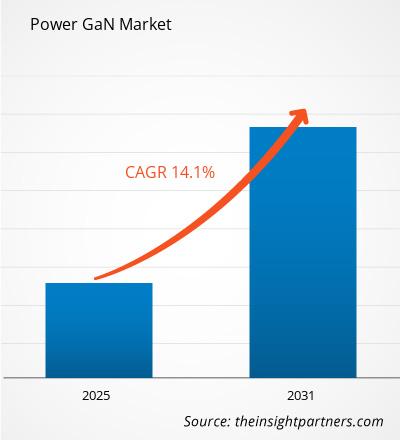
من المتوقع أن يسجل سوق GaN للطاقة معدل نمو سنوي مركب بنسبة 14.1٪ من عام 2024 إلى عام 2031، مع توسع حجم السوق من XX مليون دولار أمريكي في عام 2024 إلى XX مليون دولار أمريكي بحلول عام 2031.
تم تقسيم التقرير حسب نوع الجهاز (أجهزة GaN Power المنفصلة، وGaN Power ICs، وGaN Power Module)؛ والقطاعات الرأسية (الإلكترونيات الاستهلاكية، وتكنولوجيا المعلومات والاتصالات، والسيارات، والفضاء والدفاع، والرعاية الصحية). كما تم تقسيم التحليل العالمي بشكل أكبر على المستوى الإقليمي والدول الرئيسية. يقدم التقرير القيمة بالدولار الأمريكي للتحليل والقطاعات المذكورة أعلاه.
غرض التقرير
يهدف تقرير Power GaN Market الصادر عن The Insight Partners إلى وصف المشهد الحالي والنمو المستقبلي وأهم العوامل الدافعة والتحديات والفرص. سيوفر هذا رؤى لمختلف أصحاب المصلحة في الأعمال التجارية، مثل:
- مزودي/مصنعي التكنولوجيا: لفهم ديناميكيات السوق المتطورة ومعرفة فرص النمو المحتملة، وتمكينهم من اتخاذ قرارات استراتيجية مستنيرة.
- المستثمرون: إجراء تحليل شامل للاتجاهات فيما يتعلق بمعدل نمو السوق، وتوقعات السوق المالية، والفرص المتاحة عبر سلسلة القيمة.
- الهيئات التنظيمية: لتنظيم السياسات ومراقبة الأنشطة في السوق بهدف تقليل الانتهاكات والحفاظ على ثقة المستثمرين ودعم سلامة السوق واستقرارها.
تجزئة سوق GaN الطاقة
نوع الجهاز
- أجهزة GaN Power المنفصلة
- دوائر متكاملة للطاقة من GaN
- وحدة الطاقة GaN
رَأسِيّ
- الالكترونيات الاستهلاكية
- تكنولوجيا المعلومات والاتصالات
- السيارات
- الفضاء والدفاع
- الرعاية الصحية
قم بتخصيص هذا التقرير ليناسب متطلباتك
ستحصل على تخصيص لأي تقرير - مجانًا - بما في ذلك أجزاء من هذا التقرير، أو تحليل على مستوى الدولة، وحزمة بيانات Excel، بالإضافة إلى الاستفادة من العروض والخصومات الرائعة للشركات الناشئة والجامعات
سوق GaN للطاقة: رؤى استراتيجية
- احصل على أهم اتجاهات السوق الرئيسية لهذا التقرير.ستتضمن هذه العينة المجانية تحليلاً للبيانات، بدءًا من اتجاهات السوق وحتى التقديرات والتوقعات.
محركات نمو سوق GaN للطاقة
- الطلب المتزايد على أجهزة الطاقة عالية الكفاءة: إن الحاجة المتزايدة إلى حلول موفرة للطاقة في مختلف الصناعات، بما في ذلك الإلكترونيات الاستهلاكية والسيارات والاتصالات، تشكل محركًا رئيسيًا لسوق الطاقة من نتريد الغاليوم (GaN). توفر أجهزة الطاقة القائمة على نتريد الغاليوم كفاءة فائقة وسرعات تحويل أسرع وعوامل شكل أصغر مقارنة بالأجهزة التقليدية القائمة على السيليكون. ومع تزايد أهمية تحسين استهلاك الطاقة، يتم اعتماد تقنية نتريد الغاليوم بشكل متزايد في الإلكترونيات الكهربائية لتطبيقات مثل إمدادات الطاقة والمركبات الكهربائية وأنظمة الطاقة المتجددة.
- نمو المركبات الكهربائية وأنظمة الطاقة المتجددة: إن التبني المتسارع للمركبات الكهربائية ومصادر الطاقة المتجددة مثل الطاقة الشمسية وطاقة الرياح يدفع الطلب على أجهزة الطاقة القائمة على GaN. تعد تقنية GaN مناسبة للغاية للاستخدام في محطات شحن المركبات الكهربائية، ومحولات التيار المستمر والتيار المتردد نظرًا لقدرتها على التعامل مع مستويات الطاقة العالية مع خسائر منخفضة وإدارة حرارية محسنة. بالإضافة إلى ذلك، تدعم أجهزة GaN تصغير وكفاءة أنظمة تحويل الطاقة في تطبيقات الطاقة المتجددة، مما يجعلها ضرورية لتوسيع البنية التحتية للطاقة النظيفة.
الاتجاهات المستقبلية لسوق GaN للطاقة
- التطورات في تصنيع أشباه الموصلات GaN: تؤدي التحسينات المستمرة في عمليات تصنيع أشباه الموصلات GaN إلى تحسين الأداء وخفض التكاليف، مما يجعل أجهزة GaN أكثر سهولة في الوصول إليها لمجموعة واسعة من الصناعات. تتيح الابتكارات مثل تقنية GaN-on-Silicon دمج أجهزة GaN مع عمليات تصنيع السيليكون الحالية، مما يقلل من تكاليف الإنتاج ويسهل التبني على نطاق واسع في التطبيقات الاستهلاكية والصناعية.
- دمج أجهزة GaN للطاقة في الأجهزة الإلكترونية الاستهلاكية: مع ارتفاع الطلب على الأجهزة الإلكترونية الاستهلاكية الأصغر والأخف وزناً والأكثر كفاءة في استخدام الطاقة، يتم دمج أجهزة GaN للطاقة بشكل متزايد في محولات الطاقة وأجهزة الشحن وغيرها من الأنظمة الإلكترونية المدمجة. تمكن تقنية GaN من حلول أصغر وأكثر كثافة للطاقة توفر شحنًا أسرع وعمر بطارية أطول، خاصة في الأجهزة مثل الهواتف الذكية وأجهزة الكمبيوتر المحمولة وأجهزة الألعاب. ومن المتوقع أن ينمو هذا الاتجاه مع تحول المزيد من المنتجات الإلكترونية الاستهلاكية نحو حلول الطاقة القائمة على GaN.
فرص سوق GaN للطاقة
- التوسع في البنية التحتية لشبكات الجيل الخامس والاتصالات: إن طرح شبكات الجيل الخامس يخلق فرصة كبيرة لأجهزة GaN القوية في البنية التحتية للاتصالات. إن كثافة الطاقة العالية لـ GaN وكفاءتها وقدرتها على التعامل مع الإشارات عالية التردد تجعلها خيارًا مثاليًا لمضخمات الطاقة ومكونات التردد اللاسلكي ومحطات القاعدة المستخدمة في تقنيات الجيل الخامس. ومع توسع البنية التحتية لشبكة الجيل الخامس العالمية، من المتوقع أن ينمو الطلب على الحلول القائمة على GaN في تطبيقات الاتصالات، مما يخلق فرصة سوقية واسعة لمصنعي GaN.
- التطبيقات العسكرية والفضائية: إن القدرات العالية للأداء التي يتمتع بها GaN، بما في ذلك الإدارة الحرارية الأفضل والكفاءة، تجعله مثاليًا للاستخدام في التطبيقات العسكرية والفضائية. يمكن للأجهزة القائمة على GaN تحسين أنظمة الرادار والاتصالات عبر الأقمار الصناعية والطاقة، مما يوفر فرصًا كبيرة للنمو في قطاعي الدفاع والطيران.
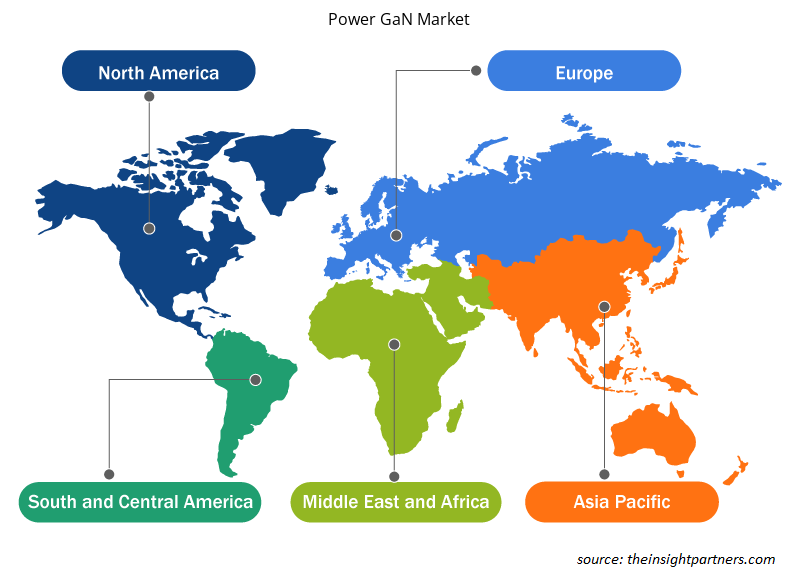
رؤى إقليمية حول سوق GaN للطاقة
لقد قام المحللون في Insight Partners بشرح الاتجاهات والعوامل الإقليمية المؤثرة على سوق Power GaN طوال فترة التوقعات بشكل شامل. يناقش هذا القسم أيضًا قطاعات سوق Power GaN والجغرافيا في جميع أنحاء أمريكا الشمالية وأوروبا ومنطقة آسيا والمحيط الهادئ والشرق الأوسط وأفريقيا وأمريكا الجنوبية والوسطى.
- احصل على البيانات الإقليمية المحددة لسوق GaN للطاقة
نطاق تقرير سوق GaN للطاقة
| سمة التقرير | تفاصيل |
|---|---|
| حجم السوق في عام 2024 | XX مليون دولار أمريكي |
| حجم السوق بحلول عام 2031 | XX مليون دولار أمريكي |
| معدل النمو السنوي المركب العالمي (2025 - 2031) | 14.1% |
| البيانات التاريخية | 2021-2023 |
| فترة التنبؤ | 2025-2031 |
| القطاعات المغطاة | حسب نوع الجهاز
|
| المناطق والدول المغطاة | أمريكا الشمالية
|
| قادة السوق وملفات تعريف الشركات الرئيسية |
|
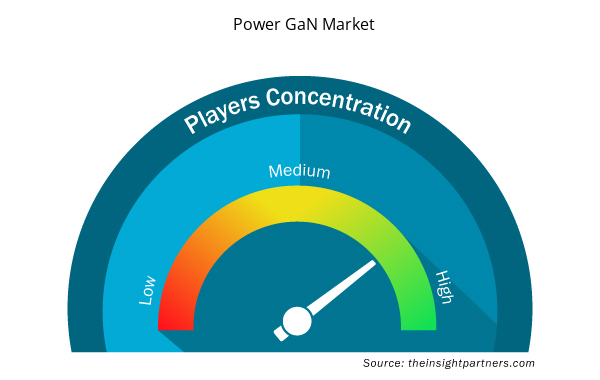
كثافة اللاعبين في سوق GaN للطاقة: فهم تأثيرها على ديناميكيات الأعمال
يشهد سوق GaN Power نموًا سريعًا، مدفوعًا بالطلب المتزايد من المستخدم النهائي بسبب عوامل مثل تفضيلات المستهلكين المتطورة والتقدم التكنولوجي والوعي المتزايد بفوائد المنتج. ومع ارتفاع الطلب، تعمل الشركات على توسيع عروضها والابتكار لتلبية احتياجات المستهلكين والاستفادة من الاتجاهات الناشئة، مما يؤدي إلى زيادة نمو السوق.
تشير كثافة اللاعبين في السوق إلى توزيع الشركات أو المؤسسات العاملة في سوق أو صناعة معينة. وهي تشير إلى عدد المنافسين (اللاعبين في السوق) الموجودين في مساحة سوق معينة نسبة إلى حجمها أو قيمتها السوقية الإجمالية.
الشركات الرئيسية العاملة في سوق الطاقة GaN هي:
- شركة تحويل الطاقة الفعالة
- فوجيتسو
- شركة إنفينيون للتكنولوجيا
- شركة كري
- ميتسوبيشي الكتريك
إخلاء المسؤولية : الشركات المذكورة أعلاه ليست مرتبة بأي ترتيب معين.
- احصل على نظرة عامة على أهم اللاعبين الرئيسيين في سوق Power GaN
نقاط البيع الرئيسية
- التغطية الشاملة: يغطي التقرير بشكل شامل تحليل المنتجات والخدمات والأنواع والمستخدمين النهائيين لسوق Power GaN، مما يوفر صورة شاملة.
- تحليل الخبراء: تم تجميع التقرير على أساس الفهم العميق لخبراء الصناعة والمحللين.
- معلومات محدثة: يضمن التقرير أهمية الأعمال التجارية بسبب تغطيته للمعلومات الحديثة واتجاهات البيانات.
- خيارات التخصيص: يمكن تخصيص هذا التقرير لتلبية متطلبات العملاء المحددة وبما يتناسب مع استراتيجيات العمل بشكل مناسب.
وبالتالي، يمكن أن يساعد تقرير البحث حول سوق GaN للطاقة في تمهيد الطريق لفك شفرة وفهم سيناريو الصناعة وآفاق النمو. ورغم وجود بعض المخاوف المشروعة، فإن الفوائد الإجمالية لهذا التقرير تميل إلى التفوق على العيوب.
- التحليل التاريخي (سنتان)، السنة الأساسية، التوقعات (7 سنوات) مع معدل النمو السنوي المركب
- تحليل PEST و SWOT
- حجم السوق والقيمة / الحجم - عالميًا وإقليميًا وقطريًا
- الصناعة والمنافسة
- مجموعة بيانات Excel


- Microplate Reader Market
- Surgical Gowns Market
- Electronic Data Interchange Market
- Retinal Imaging Devices Market
- Nuclear Decommissioning Services Market
- Neurovascular Devices Market
- Biopharmaceutical Contract Manufacturing Market
- Fill Finish Manufacturing Market
- Digital Language Learning Market
- Piling Machines Market

Report Coverage
Revenue forecast, Company Analysis, Industry landscape, Growth factors, and Trends

Segment Covered
This text is related
to segments covered.

Regional Scope
North America, Europe, Asia Pacific, Middle East & Africa, South & Central America

Country Scope
This text is related
to country scope.
الأسئلة الشائعة
Some of the customization options available based on the request are an additional 3-5 company profiles and country-specific analysis of 3-5 countries of your choice. Customizations are to be requested/discussed before making final order confirmation# as our team would review the same and check the feasibility
Expansion in 5G and Telecommunications Infrastructure is likely to remain a key trend in the market.
Key players in the power GaN market include EFFICIENT POWER CONVERSION CORPORATION, FUJITSU, INFINEON TECHNOLOGIES AG, CREE INC, MITSUBISHI ELECTRIC, TOSHIBA CORP , TAIWAN SEMICONDUCTOR MANUFACTURING COMPANY, GAN SYSTEMS, VISIC TECHNOLOGIES, and NAVITAS SEMICONDUCTOR
The major factors driving the power GaN market are:
1. Increasing Demand for High-Efficiency Power Devices.
2.Growth of Electric Vehicles (EVs) and Renewable Energy Systems
The Power GaN Market Source: https://www.theinsightpartners.com/reports/power-gan-market is estimated to witness a CAGR of 14.1% from 2023 to 2031
1. EFFICIENT POWER CONVERSION CORPORATION
2. FUJITSU
3. INFINEON TECHNOLOGIES AG
4. CREE INC.
5. MITSUBISHI ELECTRIC
6. TOSHIBA CORP.
7. TAIWAN SEMICONDUCTOR MANUFACTURING COMPANY
8. GAN SYSTEMS
9. VISIC TECHNOLOGIES
10. NAVITAS SEMICONDUCTOR
The Insight Partners performs research in 4 major stages: Data Collection & Secondary Research, Primary Research, Data Analysis and Data Triangulation & Final Review.
- Data Collection and Secondary Research:
As a market research and consulting firm operating from a decade, we have published and advised several client across the globe. First step for any study will start with an assessment of currently available data and insights from existing reports. Further, historical and current market information is collected from Investor Presentations, Annual Reports, SEC Filings, etc., and other information related to company’s performance and market positioning are gathered from Paid Databases (Factiva, Hoovers, and Reuters) and various other publications available in public domain.
Several associations trade associates, technical forums, institutes, societies and organization are accessed to gain technical as well as market related insights through their publications such as research papers, blogs and press releases related to the studies are referred to get cues about the market. Further, white papers, journals, magazines, and other news articles published in last 3 years are scrutinized and analyzed to understand the current market trends.
- Primary Research:
The primarily interview analysis comprise of data obtained from industry participants interview and answers to survey questions gathered by in-house primary team.
For primary research, interviews are conducted with industry experts/CEOs/Marketing Managers/VPs/Subject Matter Experts from both demand and supply side to get a 360-degree view of the market. The primary team conducts several interviews based on the complexity of the markets to understand the various market trends and dynamics which makes research more credible and precise.
A typical research interview fulfils the following functions:
- Provides first-hand information on the market size, market trends, growth trends, competitive landscape, and outlook
- Validates and strengthens in-house secondary research findings
- Develops the analysis team’s expertise and market understanding
Primary research involves email interactions and telephone interviews for each market, category, segment, and sub-segment across geographies. The participants who typically take part in such a process include, but are not limited to:
- Industry participants: VPs, business development managers, market intelligence managers and national sales managers
- Outside experts: Valuation experts, research analysts and key opinion leaders specializing in the electronics and semiconductor industry.
Below is the breakup of our primary respondents by company, designation, and region:

Once we receive the confirmation from primary research sources or primary respondents, we finalize the base year market estimation and forecast the data as per the macroeconomic and microeconomic factors assessed during data collection.
- Data Analysis:
Once data is validated through both secondary as well as primary respondents, we finalize the market estimations by hypothesis formulation and factor analysis at regional and country level.
- Macro-Economic Factor Analysis:
We analyse macroeconomic indicators such the gross domestic product (GDP), increase in the demand for goods and services across industries, technological advancement, regional economic growth, governmental policies, the influence of COVID-19, PEST analysis, and other aspects. This analysis aids in setting benchmarks for various nations/regions and approximating market splits. Additionally, the general trend of the aforementioned components aid in determining the market's development possibilities.
- Country Level Data:
Various factors that are especially aligned to the country are taken into account to determine the market size for a certain area and country, including the presence of vendors, such as headquarters and offices, the country's GDP, demand patterns, and industry growth. To comprehend the market dynamics for the nation, a number of growth variables, inhibitors, application areas, and current market trends are researched. The aforementioned elements aid in determining the country's overall market's growth potential.
- Company Profile:
The “Table of Contents” is formulated by listing and analyzing more than 25 - 30 companies operating in the market ecosystem across geographies. However, we profile only 10 companies as a standard practice in our syndicate reports. These 10 companies comprise leading, emerging, and regional players. Nonetheless, our analysis is not restricted to the 10 listed companies, we also analyze other companies present in the market to develop a holistic view and understand the prevailing trends. The “Company Profiles” section in the report covers key facts, business description, products & services, financial information, SWOT analysis, and key developments. The financial information presented is extracted from the annual reports and official documents of the publicly listed companies. Upon collecting the information for the sections of respective companies, we verify them via various primary sources and then compile the data in respective company profiles. The company level information helps us in deriving the base number as well as in forecasting the market size.
- Developing Base Number:
Aggregation of sales statistics (2020-2022) and macro-economic factor, and other secondary and primary research insights are utilized to arrive at base number and related market shares for 2022. The data gaps are identified in this step and relevant market data is analyzed, collected from paid primary interviews or databases. On finalizing the base year market size, forecasts are developed on the basis of macro-economic, industry and market growth factors and company level analysis.
- Data Triangulation and Final Review:
The market findings and base year market size calculations are validated from supply as well as demand side. Demand side validations are based on macro-economic factor analysis and benchmarks for respective regions and countries. In case of supply side validations, revenues of major companies are estimated (in case not available) based on industry benchmark, approximate number of employees, product portfolio, and primary interviews revenues are gathered. Further revenue from target product/service segment is assessed to avoid overshooting of market statistics. In case of heavy deviations between supply and demand side values, all thes steps are repeated to achieve synchronization.
We follow an iterative model, wherein we share our research findings with Subject Matter Experts (SME’s) and Key Opinion Leaders (KOLs) until consensus view of the market is not formulated – this model negates any drastic deviation in the opinions of experts. Only validated and universally acceptable research findings are quoted in our reports.
We have important check points that we use to validate our research findings – which we call – data triangulation, where we validate the information, we generate from secondary sources with primary interviews and then we re-validate with our internal data bases and Subject matter experts. This comprehensive model enables us to deliver high quality, reliable data in shortest possible time.
 احصل على عينة مجانية لهذا التقرير